XRP suffered a rough week as its price declined by 12%. The cryptocurrency attempts to recover, and it marked an increase of 1.69% over the past 24 hours to reach the current price of %excerpt%.2220The cryptocurrency has been trapped within a wide range between 3324 SAT and 3000 SAT against BTC in November 2019.XRP may be able to go higher as the technical indicators start to flatten out in oversold conditions.Key Support & Resistance LevelsXRP/USDSupport: %excerpt%.215, %excerpt%.200, %excerpt%.185 Resistance: %excerpt%.234, %excerpt%.252, %excerpt%.281XRP/BTC:Support: 3000 SAT, 2900 SAT, 2710 SATResistance: 3200 SAT, 3325 SAT, 3500 SATThe daily chart above shows XRP bouncing from the strong support at %excerpt%.215 over the past three days. Like the majority of the altcoin market, XRP suffered heavily in November after dropping by a total of
Topics:
Yaz Sheikh considers the following as important: Ripple Price, XRP Analysis, XRP News
This could be interesting, too:
Guest User writes XRP Price Faces Potential Drop: Leading KOL Warns of Imminent Correction with TD Sequential Sell Signal!
CryptoVizArt writes XRP Breakout Imminent? Ripple Price Analysis Suggests a Decisive Move
CryptoVizArt writes Ripple Price Analysis: Where Is XRP Headed Following Massive Crash and Swift Rebound?
CryptoVizArt writes Ripple Price Analysis: Can XRP Reach in the Following Months?
- XRP suffered a rough week as its price declined by 12%. The cryptocurrency attempts to recover, and it marked an increase of 1.69% over the past 24 hours to reach the current price of $0.2220
- The cryptocurrency has been trapped within a wide range between 3324 SAT and 3000 SAT against BTC in November 2019.
- XRP may be able to go higher as the technical indicators start to flatten out in oversold conditions.
Key Support & Resistance Levels
XRP/USD
Support: $0.215, $0.200, $0.185
Resistance: $0.234, $0.252, $0.281
XRP/BTC:
Support: 3000 SAT, 2900 SAT, 2710 SAT
Resistance: 3200 SAT, 3325 SAT, 3500 SAT
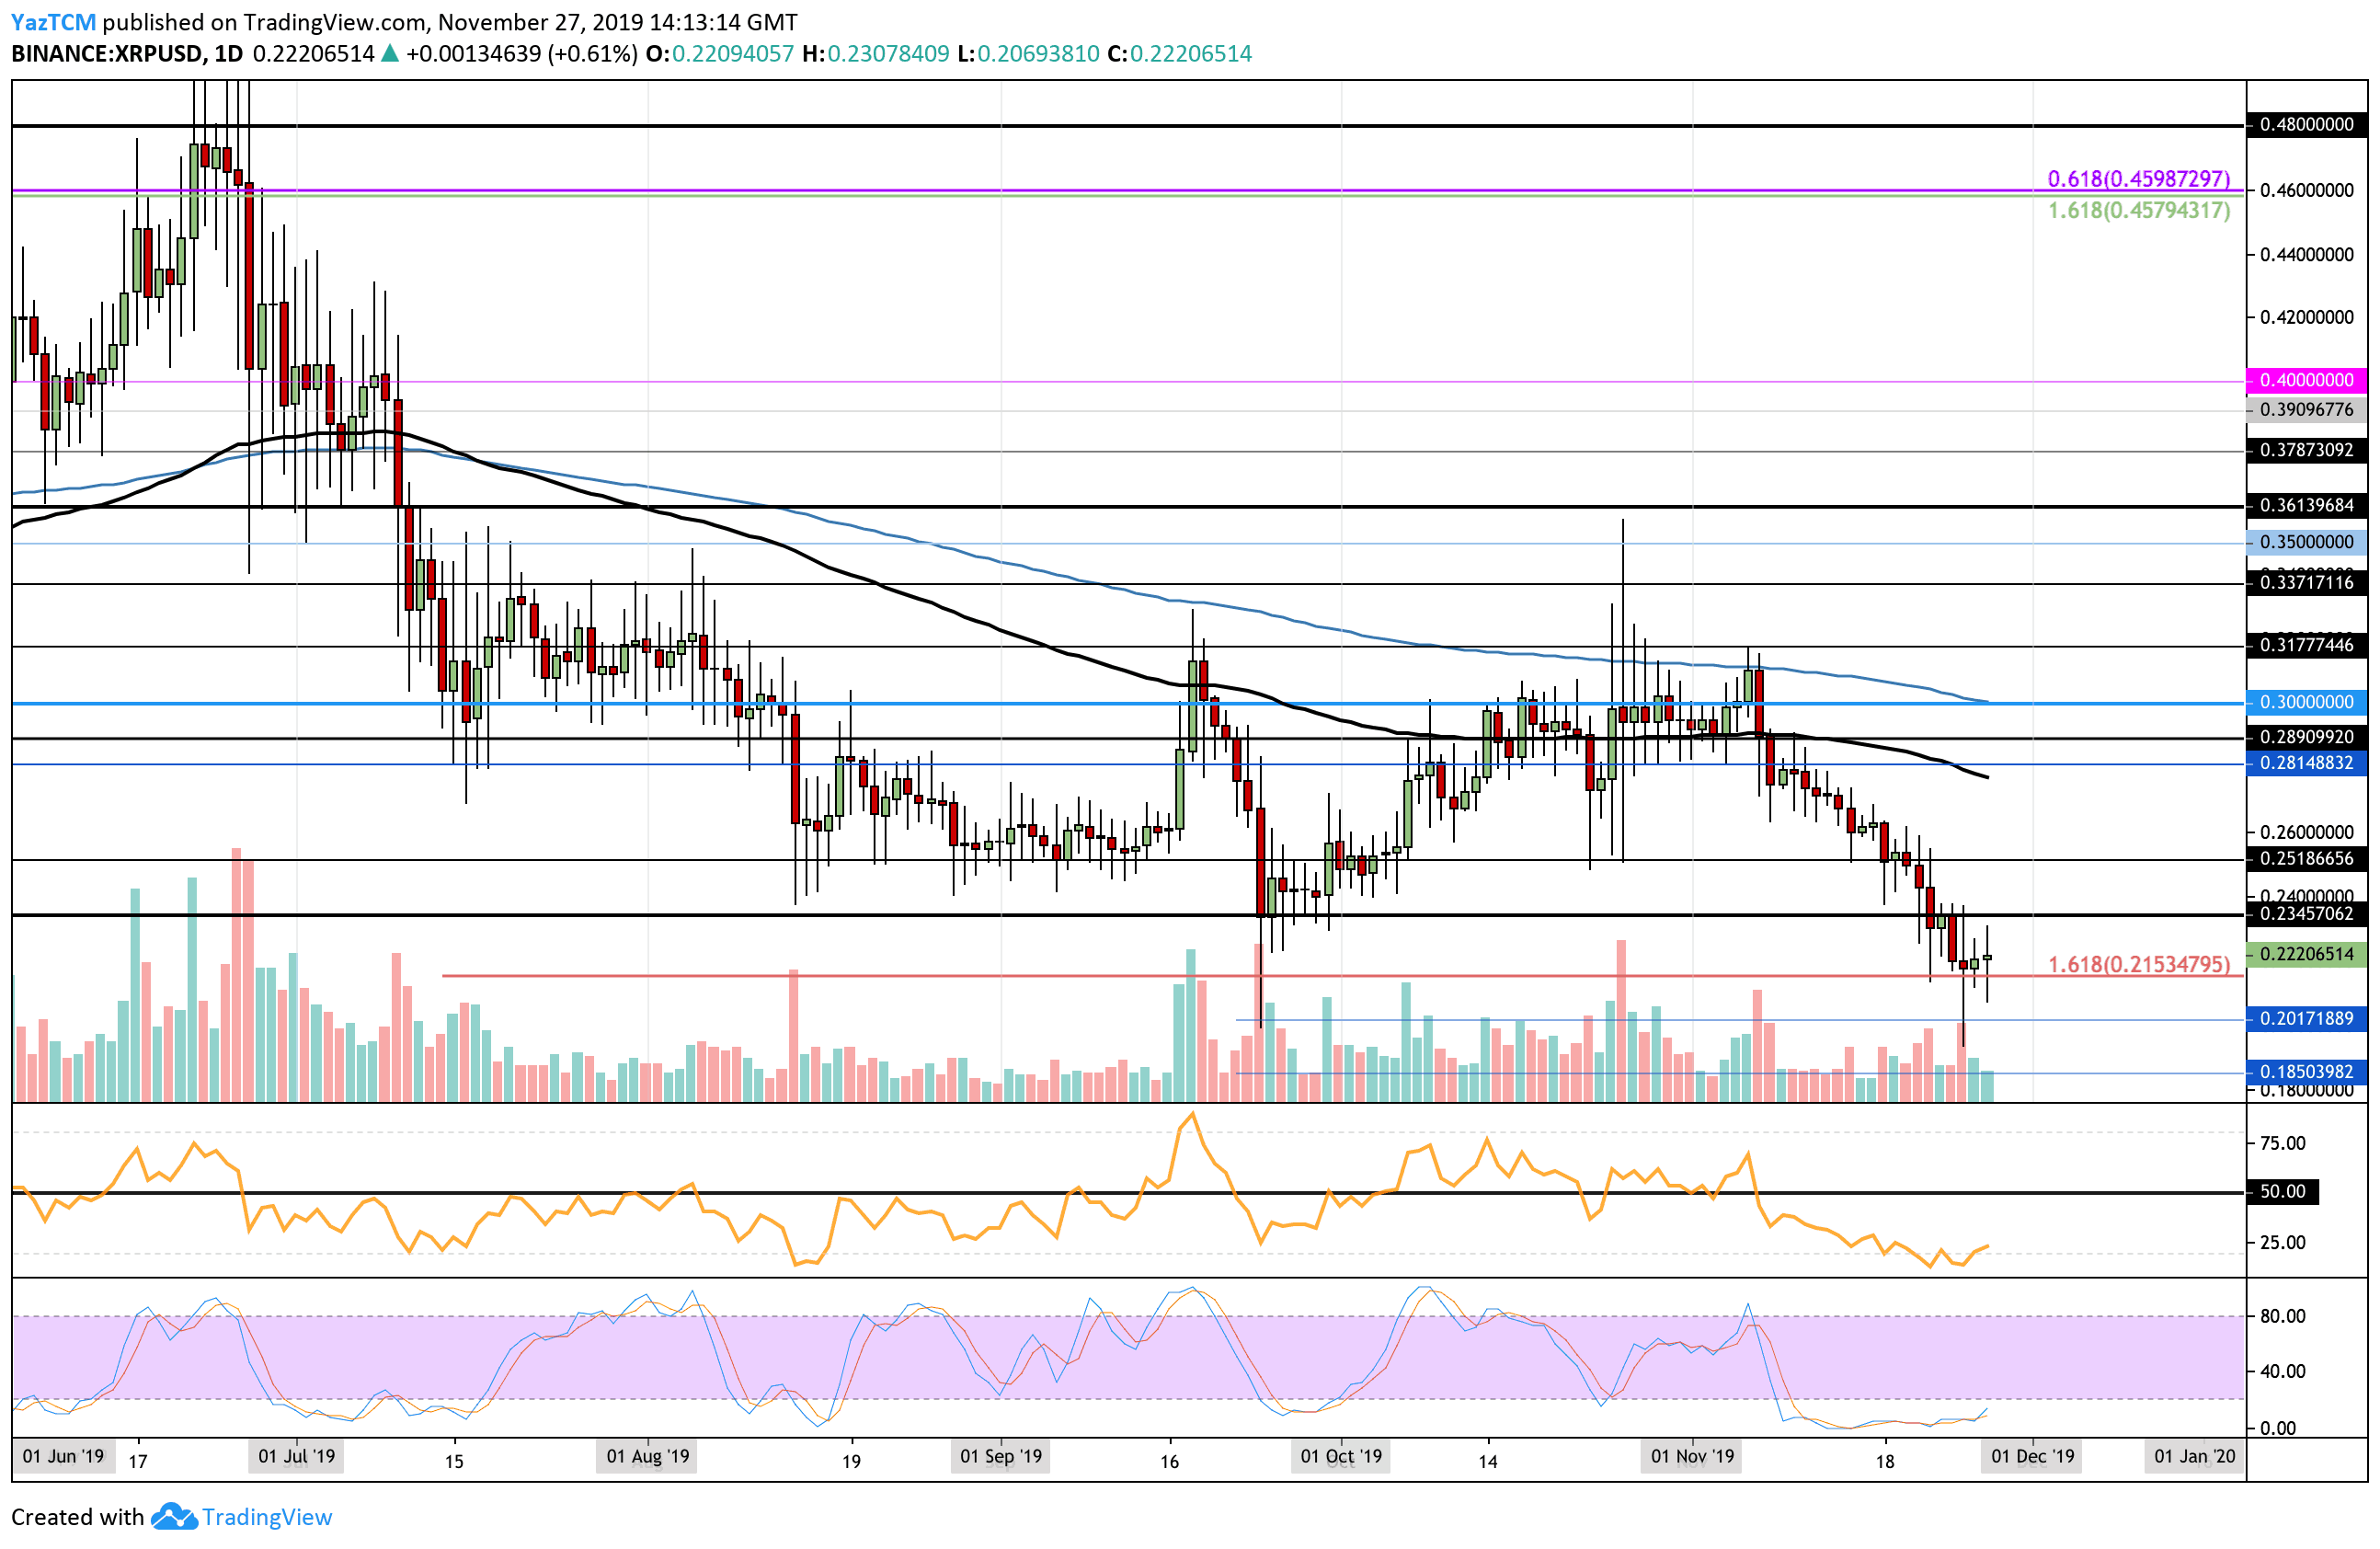
The daily chart above shows XRP bouncing from the strong support at $0.215 over the past three days. Like the majority of the altcoin market, XRP suffered heavily in November after dropping by a total of 25% to create a multi-year low, not seen since December 2017.
Nevertheless, the support at $0.215 looks to be strong, and it’s interesting to see if XRP will start to rebound higher from here.
XRP Short Term Price Prediction
If the bulls start to push higher, an initial resistance is expected at the $0.234 level, which had provided strong support for the market during September 2019. Above this, resistance lies at $0.2520, which is the low from September 2018. Beyond $0.2520, resistance can be found at $0.281, where lies the 100-days EMA.
Alternatively, if the sellers regroup and push lower, immediate strong support is expected at $0.215. Beneath this, support lies at $0.20- and $0.185.
The RSI has recently turned upward, which is a sign that the selling momentum may be starting to fade. Furthermore, the Stochastic RSI has been in extremely oversold conditions for the entire period of November 2019. It is beginning to shape up for a bullish crossover signal, which should certainly help it rebound higher.
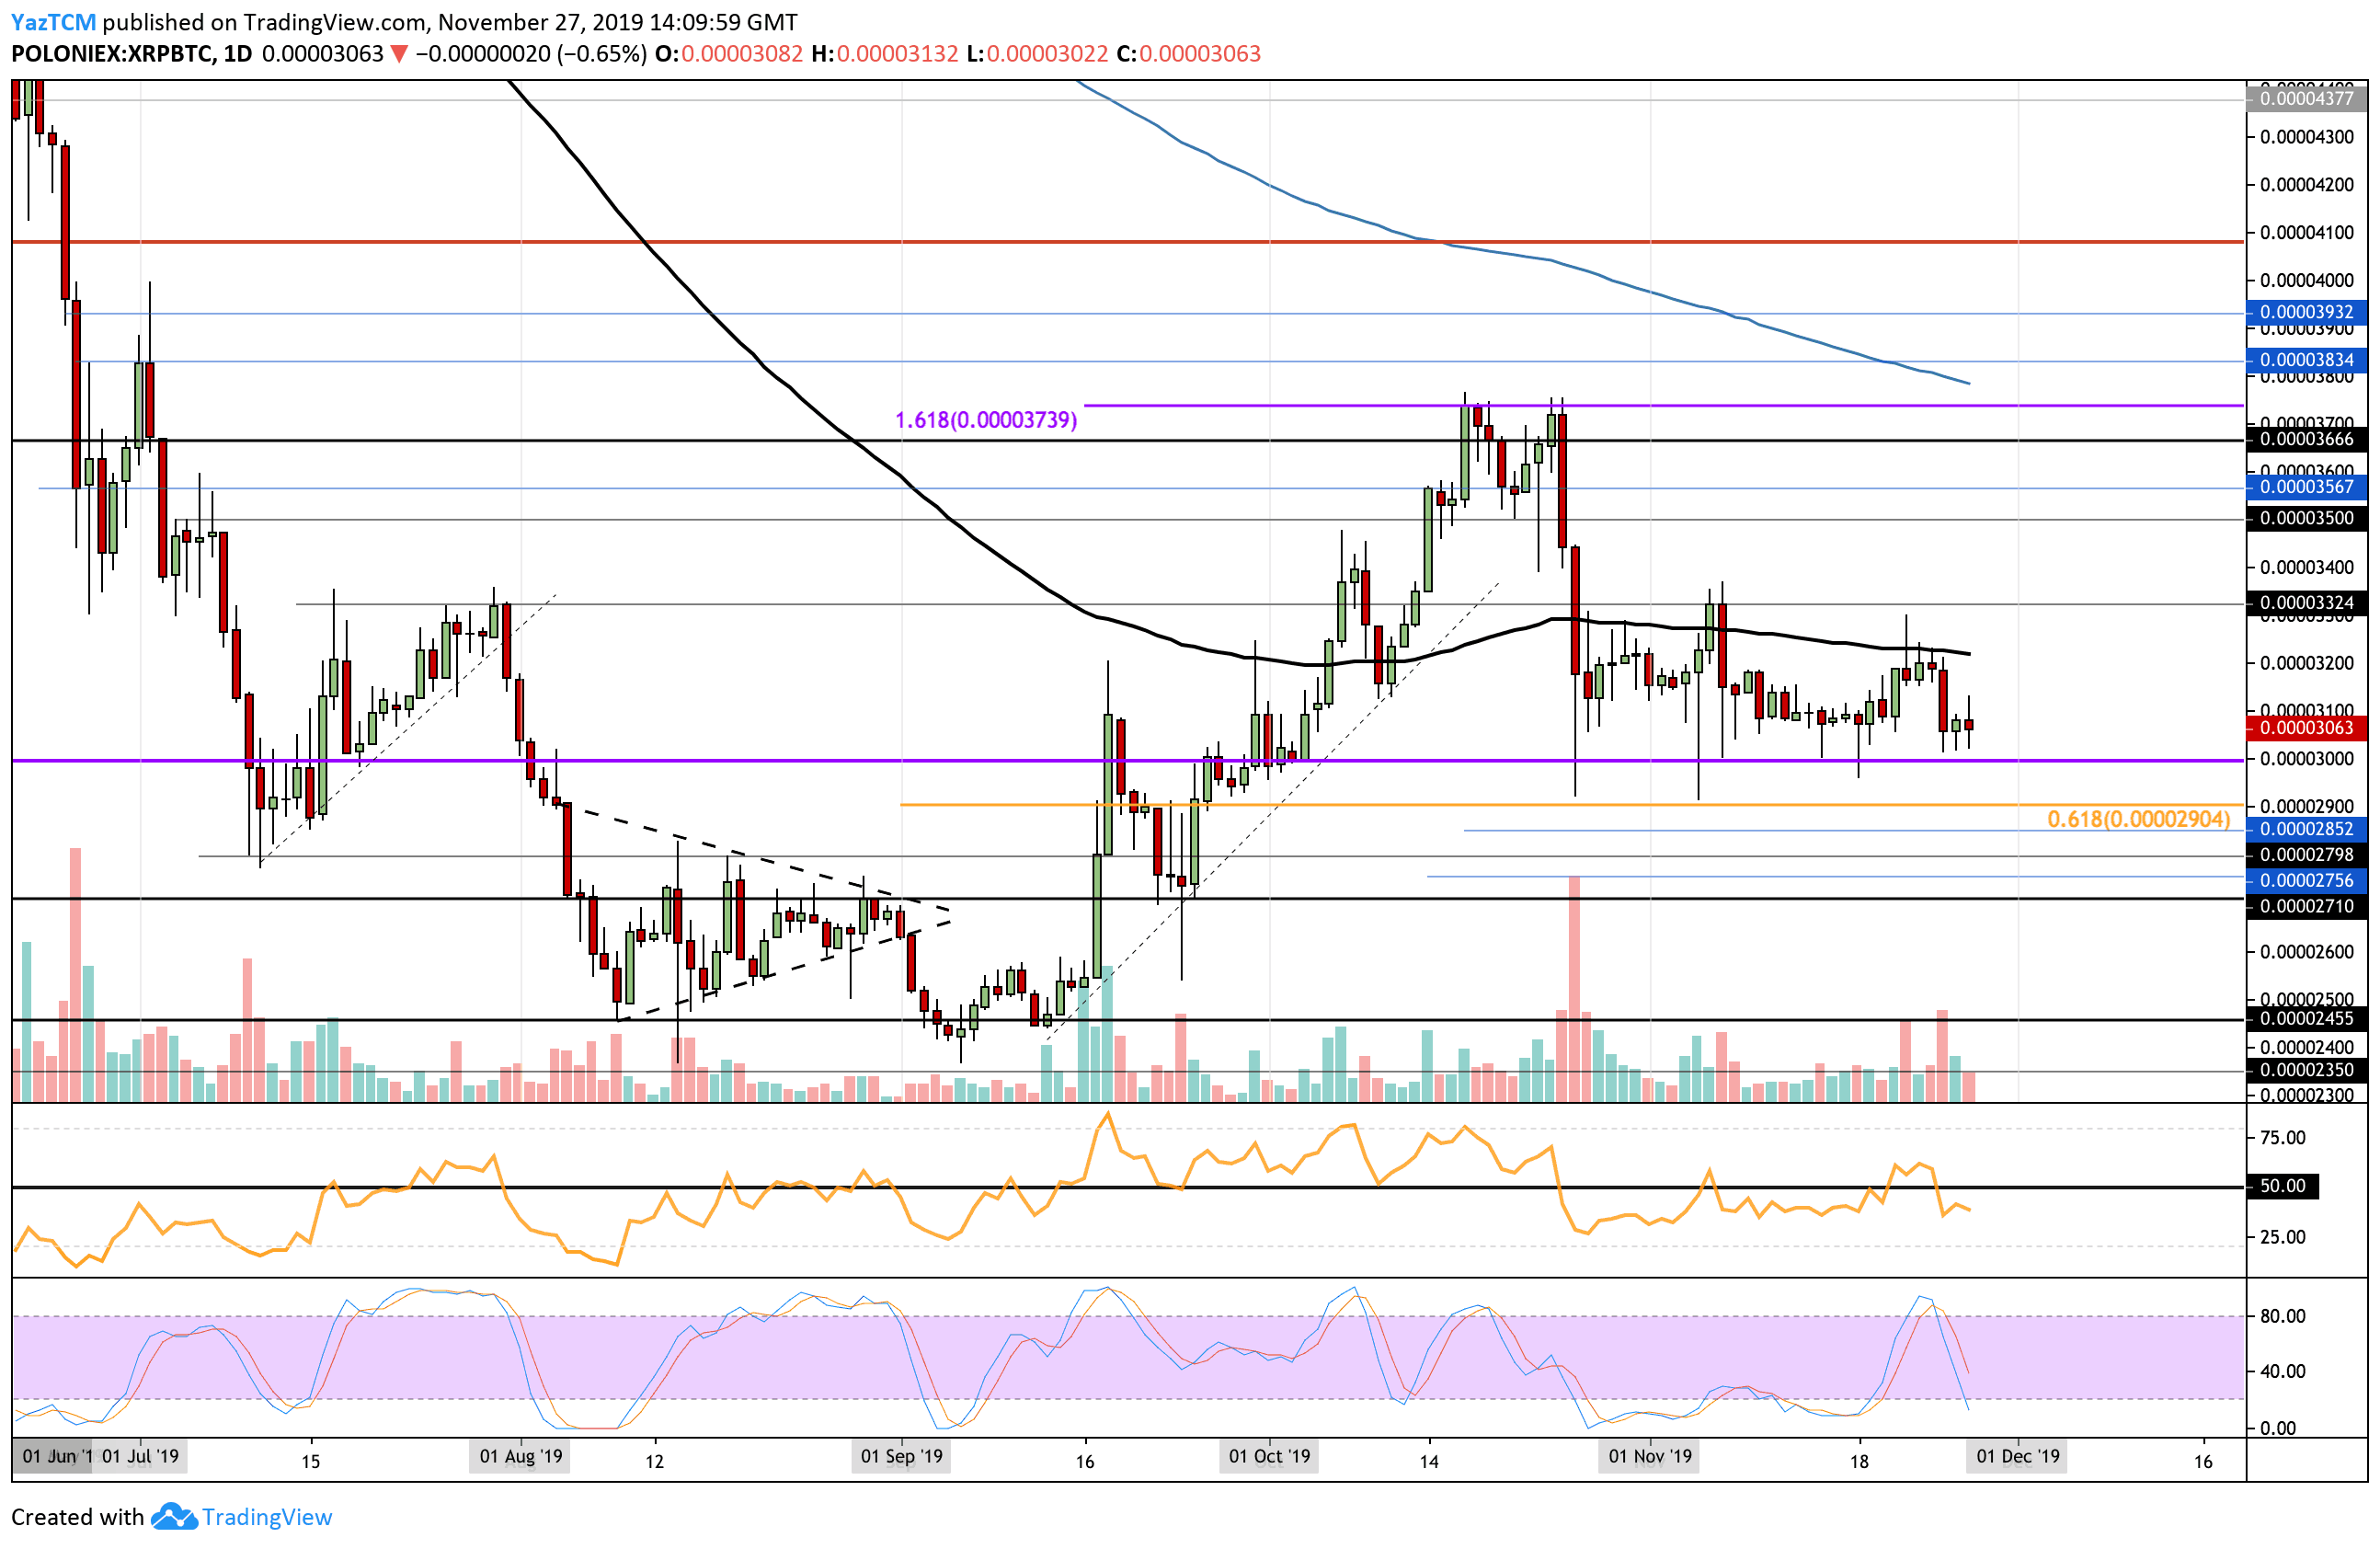 Against BTC, XRP has been trapped within a wide range between 3325 SAT and 3000 SAT for the entire period of November 2019. This could be seen as a pretty promising sign for XRP as the cryptocurrency is not trending in a bearish direction.
A break of this range will dictate as to which direction the market would like to head toward next.
XRP Short Term Price Prediction
If the sellers start to add pressure to the market, support is located at the bottom of the range at the 3000 SAT level. Beneath this, support can be found at 2900 SAT, where lies the short term .618 Fibonacci Retracement level. If the sellers continue to pressure, added support is located at 2710 SAT.
Alternatively, if the buyers regroup and push higher, immediate resistance is expected at 3200 SAT, where lies the 100-days EMA. Above this, resistance lies at the upper boundary of the range at 3325 SAT. Beyond the range, higher resistance lies at 3500 SAT.
The RSI has recently dipped beneath the 50 level, which is a worrying sign for the bulls as it shows that the sellers are trying to take back control over the market momentum.