XRP saw an increase of around 2% over the past 24 hours and it currently trades at %excerpt%.2805. This allowed it to climb by a total of 10.65% over the past 30 days as the cryptocurrency makes its way toward the %excerpt%.30 level once again. However, XRP has strong resistance ahead at the %excerpt%.2811 and the 100-days EMA before being able to reach %excerpt%.30.XRP remains the third-largest cryptocurrency with a market cap of .11 billion.Looking at the XRP/USD 1-Day Chart:Since our previous XRP/USD analysis, the cryptocurrency continued to fall from the resistance at %excerpt%.2811 until finding support at the %excerpt%.2584 level. XRP has since rebounded and is now re-testing the %excerpt%.2811 level.From above: If the bulls can break %excerpt%.2811, higher resistance is expected at %excerpt%.2890. This area of resistance is further bolstered
Topics:
Yaz Sheikh considers the following as important: XRP Analysis
This could be interesting, too:
CryptoVizArt writes XRP Breakout Imminent? Ripple Price Analysis Suggests a Decisive Move
CryptoVizArt writes Ripple Price Analysis: Where Is XRP Headed Following Massive Crash and Swift Rebound?
CryptoVizArt writes Ripple Price Analysis: Can XRP Reach in the Following Months?
CryptoVizArt writes Ripple Price Analysis: Can XRP Soar to Soon?
XRP saw an increase of around 2% over the past 24 hours and it currently trades at $0.2805. This allowed it to climb by a total of 10.65% over the past 30 days as the cryptocurrency makes its way toward the $0.30 level once again. However, XRP has strong resistance ahead at the $0.2811 and the 100-days EMA before being able to reach $0.30.
XRP remains the third-largest cryptocurrency with a market cap of $12.11 billion.
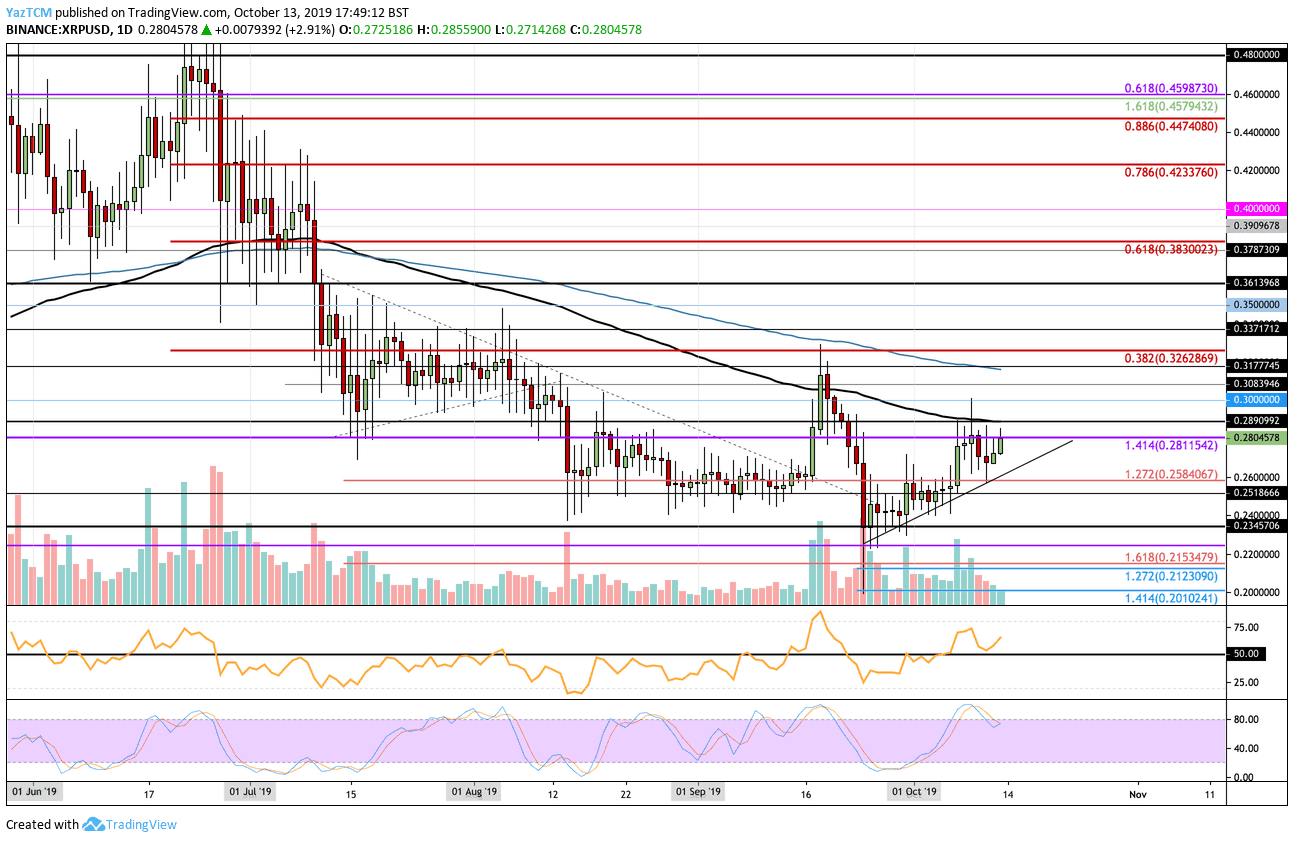
Looking at the XRP/USD 1-Day Chart:
- Since our previous XRP/USD analysis, the cryptocurrency continued to fall from the resistance at $0.2811 until finding support at the $0.2584 level. XRP has since rebounded and is now re-testing the $0.2811 level.
- From above: If the bulls can break $0.2811, higher resistance is expected at $0.2890. This area of resistance is further bolstered by the 100-days EMA. Above $0.2890, resistance lies at $0.30, $0.398, and $0.3177 (200-days EMA).
- From below: The nearest level of support lies at the short term rising support trend line. Beneath this, support lies at $0.26, $0.2584, $0.2518, $0.24, and $0.2345.
- The trading volume has seen a rather nice increase during October.
- The RSI has rebounded at the 50 level which shows that the bulls remain in control over the market momentum.
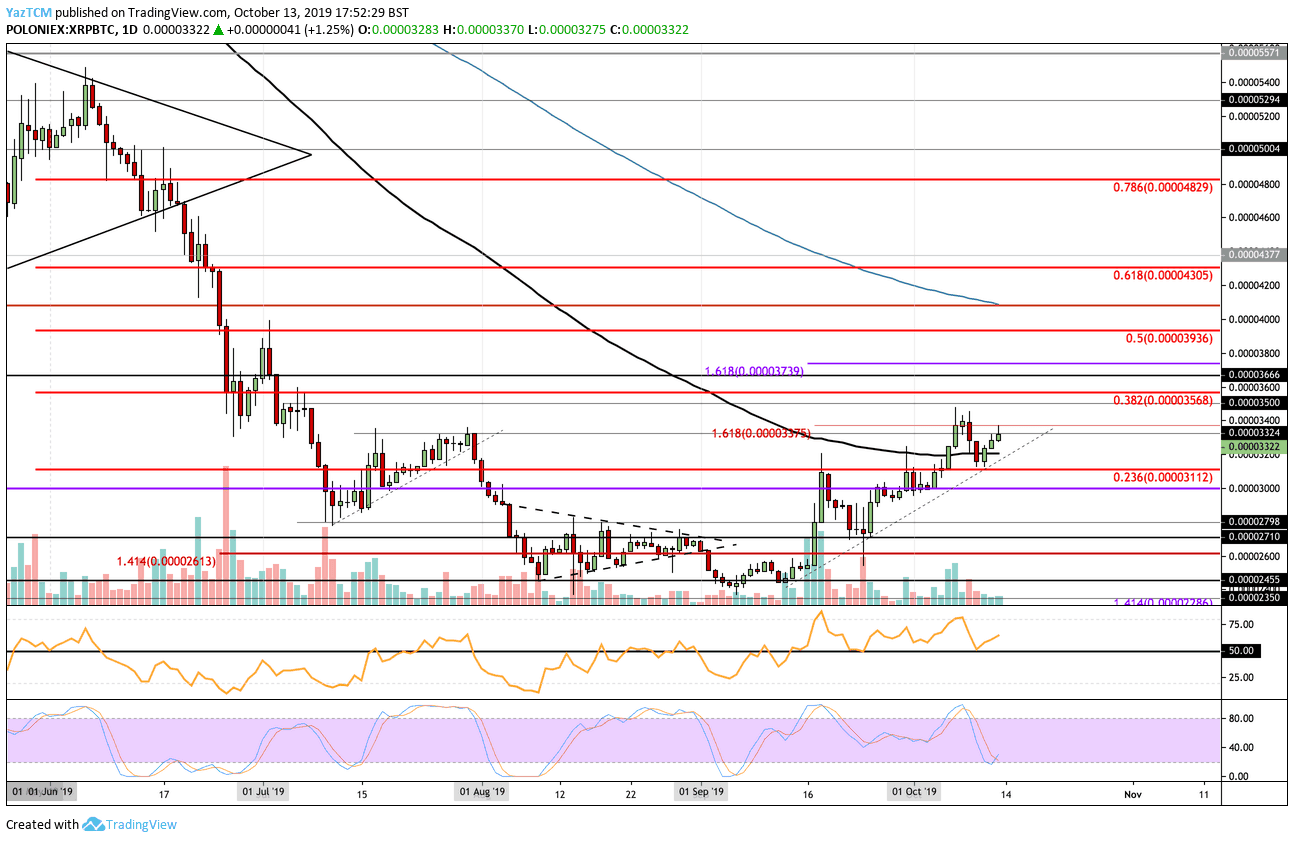
Looking at the XRP/BTC 1-Day Chart:
- Against Bitcoin, XRP managed to hold the support at 3112 SAT and rebounded higher to where it currently trades at 3324 SATS.
- From above: Initial resistance can be found at 3375 SAT and 3500 SAT. Above this, resistance lies at 3568 SAT (bearish .382 Fib Retracement), 3666 SAT, 3800 SAT, and 3936 SAT (bearish .5 Fib Retracement).
- From below: The nearest level of support lies at the 100 days EMA around 3200 SAT. Beneath this, support lies at 3112 SAT, 3000 SAT, 2800 SAT, 2710 SAT, and 2600 SAT.
- The trading volume remains low but is showing signs it would like to increase.
- The RSI has rebounded at 50 which is a strong sign for the bulls. Furthermore, the Stocahstic RSI has recently produced a bullish crossover signal in oversold territory which is a sign of a potential incoming bullish surge.


