SummaryXRP suffered a rough week as the price dropped by 12%. During the past 24 hours, however, it marked a slight increase of almost 2% and reached its current level at %excerpt%.222.The cryptocurrency has been trapped within a wide range between 3324 SAT and 3000 SAT against BTC in November 2019.It may be able to climb higher as the technical indicators start to flatten out in oversold conditions.Key Support & Resistance LevelsXRP/USDSupport: %excerpt%.215, %excerpt%.200, %excerpt%.185Resistance: %excerpt%.2345, %excerpt%.252, %excerpt%.270XRP/BTC:Support: 3000 SAT, 2900 SAT, 2853 SATResistance: 3200 SAT, 3325 SAT, 3500 SATXRP/USD: XRP Attempts To Rebound From %excerpt%.215 SupportThe daily chart above shows XRP bouncing from the strong support at %excerpt%.215 over the past three days. Like the majority of the altcoin market, XRP had suffered
Topics:
Yaz Sheikh considers the following as important: XRP, XRP Analysis, xrp price
This could be interesting, too:
Bitcoin Schweiz News writes BlackRock bringt Bitcoin-ETP nach Europa – Was bedeutet das für den Kryptomarkt?
Chayanika Deka writes XRP, SOL, and ADA Inclusion in US Crypto Reserve Pushes Traders on Edge
Bilal Hassan writes Massive 25M XRP Transfer Sparks Market Rally Speculation
Bitcoin Schweiz News writes Trump bestätigt Bitcoin als Reservewährung – Kurs explodiert!
Summary
- XRP suffered a rough week as the price dropped by 12%. During the past 24 hours, however, it marked a slight increase of almost 2% and reached its current level at $0.222.
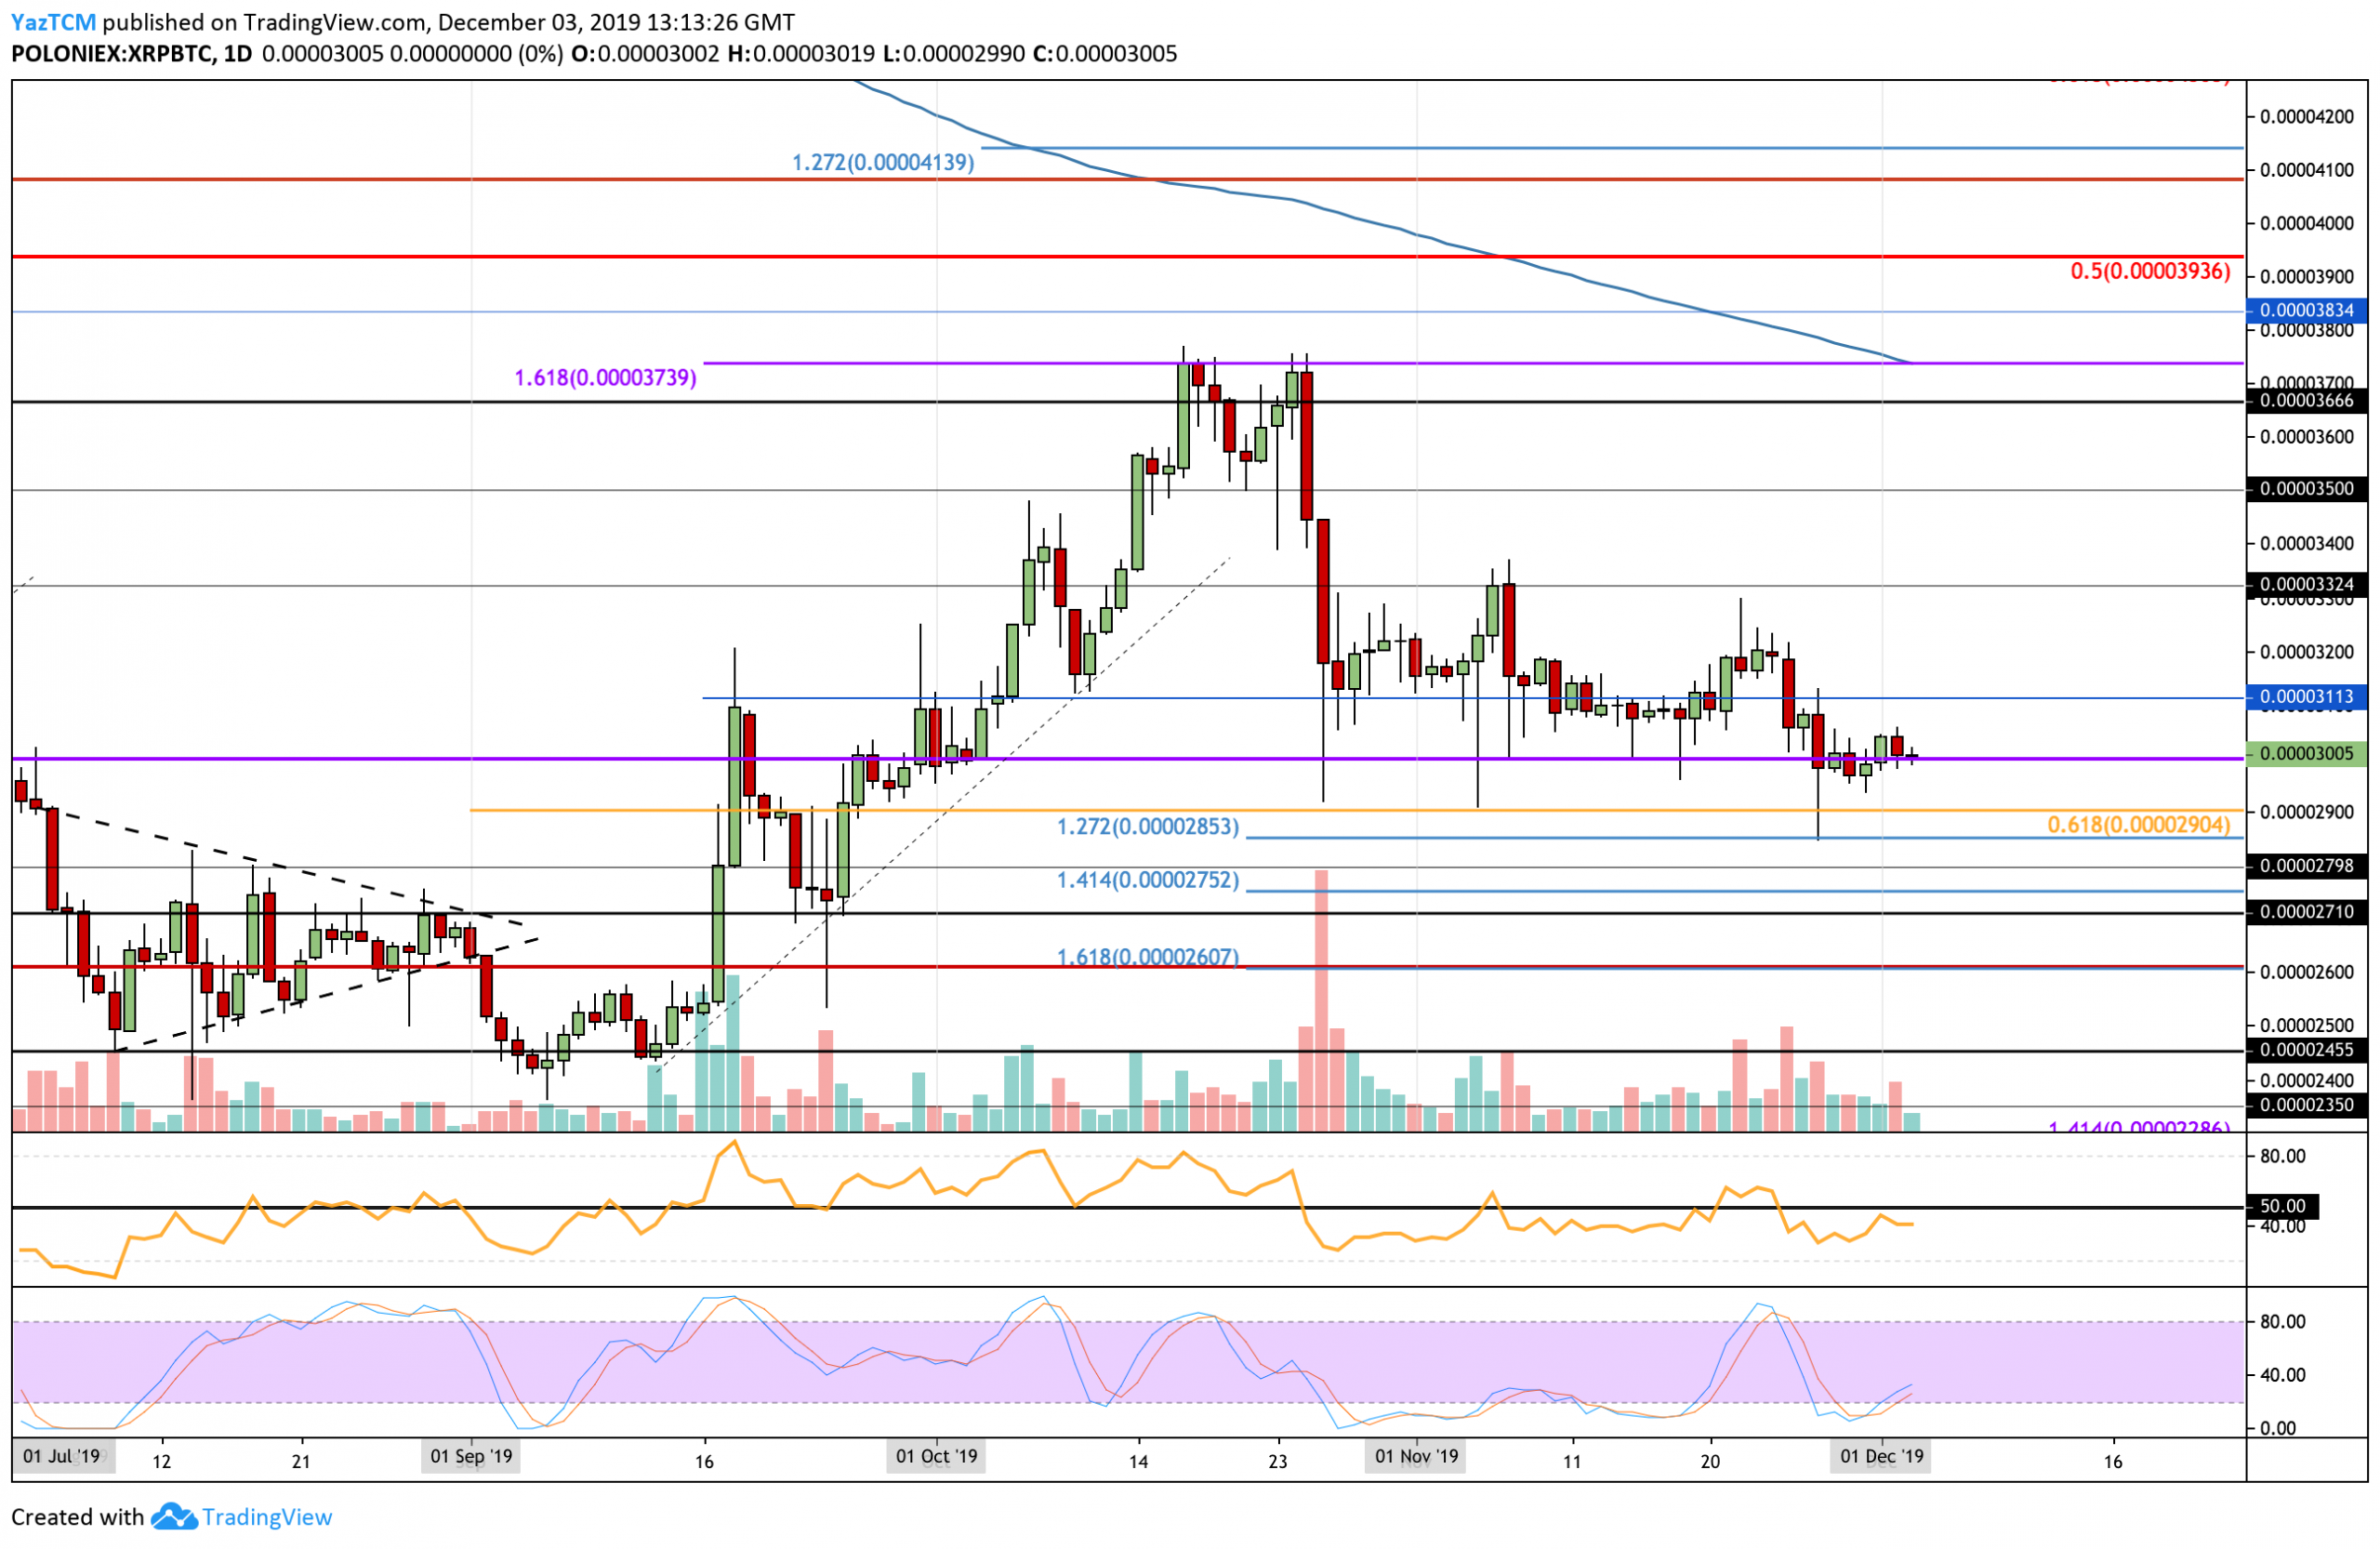
- The cryptocurrency has been trapped within a wide range between 3324 SAT and 3000 SAT against BTC in November 2019.
- It may be able to climb higher as the technical indicators start to flatten out in oversold conditions.
Key Support & Resistance Levels
XRP/USD
Support: $0.215, $0.200, $0.185
Resistance: $0.2345, $0.252, $0.270
XRP/BTC:
Support: 3000 SAT, 2900 SAT, 2853 SAT
Resistance: 3200 SAT, 3325 SAT, 3500 SAT
XRP/USD: XRP Attempts To Rebound From $0.215 Support
The daily chart above shows XRP bouncing from the strong support at $0.215 over the past three days. Like the majority of the altcoin market, XRP had suffered heavily in November after dropping by a total of 25% to create a multi-year low, not seen since December 2017.
Nevertheless, the support at $0.215 looks to be strong, and we wait to see if XRP will start to rebound higher from here.
XRP Short Term Price Prediction
If the bulls do start to push higher, an initial resistance is expected at the $0.2345 level, which had provided strong support for the market during September 2019. Above this, resistance lies at $0.252, which is the September 2018 price low. Beyond $0.252, resistance can be found at $0.281, where lies the 100-days EMA.
Alternatively, if the sellers regroup and push lower, we can expect immediate strong support at $0.215. Beneath this, support lies at $0.200 and $0.185.
The RSI has recently turned upward, which is a sign that the selling momentum may be starting to fade. Furthermore, the Stochastic RSI has been in extremely oversold conditions for the entire period of November. It is beginning to shape up for a bullish crossover signal, which should certainly help this coin rebound higher.
XRP/BTC: XRP Holding Strong At 3000 SAT
Against BTC, XRP did fall lower after our last analysis. However, strong support was found at the expected level of 2852 SAT. This allowed XRP to rebound sharply and rise back above the 3000 SAT support level.
XRP Short Term Price Prediction
If the sellers start to pressure the market beneath the 3000 SAT support level, we can expect immediate support toward the downside to be located at 2900 SAT (.618 Fib Retracement). Beneath this, support is expected at 2853 SAT and 2752 SAT.
Alternatively, if the buyers can start pushing higher above the support at 3000 SAT, we can expect immediate resistance to be located at 3200 SAT and 3325 SAT. Beyond 3325 SAT, resistance is located at 3500 SAT.
The Stochastic RSI has recently produced a bullish crossover signal, which could result in XRP rising higher against BTC if the moving averages for the indicator can start to expand away from each other.


