XRP dropped back into the %excerpt%.215 support after failing to break above %excerpt%.2345 this week.The cryptocurrency remains above the 3000 SAT level but the bears are attempting to take control.XRP has been trapped within a range between %excerpt%.215 and %excerpt%.234 throughout the entire period of December.Key Support & Resistance LevelsXRP/USDSupport: %excerpt%.2150, %excerpt%.20, %excerpt%.1850 Resistance: %excerpt%.2345, %excerpt%.2520, %excerpt%.27XRP/BTC:Support: 3000 SAT, 2900 SAT, 2855 SATResistance: 3113 SAT, 3200 SAT, 3325 SAT, 3500 SATXRP/USD: Trapped Within A Tight RangeThe daily chart shows that XRP was unable to make any ground above the resistance at %excerpt%.2345 which caused the market to roll over and head lower back into the support at %excerpt%.215. The resistance at %excerpt%.2345 is considered very strong as it had provided very strong support for
Topics:
Yaz Sheikh considers the following as important: Ripple Price, XRP, XRP Analysis
This could be interesting, too:
Bitcoin Schweiz News writes BlackRock bringt Bitcoin-ETP nach Europa – Was bedeutet das für den Kryptomarkt?
Chayanika Deka writes XRP, SOL, and ADA Inclusion in US Crypto Reserve Pushes Traders on Edge
Bilal Hassan writes Massive 25M XRP Transfer Sparks Market Rally Speculation
Bitcoin Schweiz News writes Trump bestätigt Bitcoin als Reservewährung – Kurs explodiert!
- XRP dropped back into the $0.215 support after failing to break above $0.2345 this week.
- The cryptocurrency remains above the 3000 SAT level but the bears are attempting to take control.
- XRP has been trapped within a range between $0.215 and $0.234 throughout the entire period of December.
Key Support & Resistance Levels
XRP/USD
Support: $0.2150, $0.20, $0.1850
Resistance: $0.2345, $0.2520, $0.27
XRP/BTC:
Support: 3000 SAT, 2900 SAT, 2855 SAT
Resistance: 3113 SAT, 3200 SAT, 3325 SAT, 3500 SAT
XRP/USD: Trapped Within A Tight Range
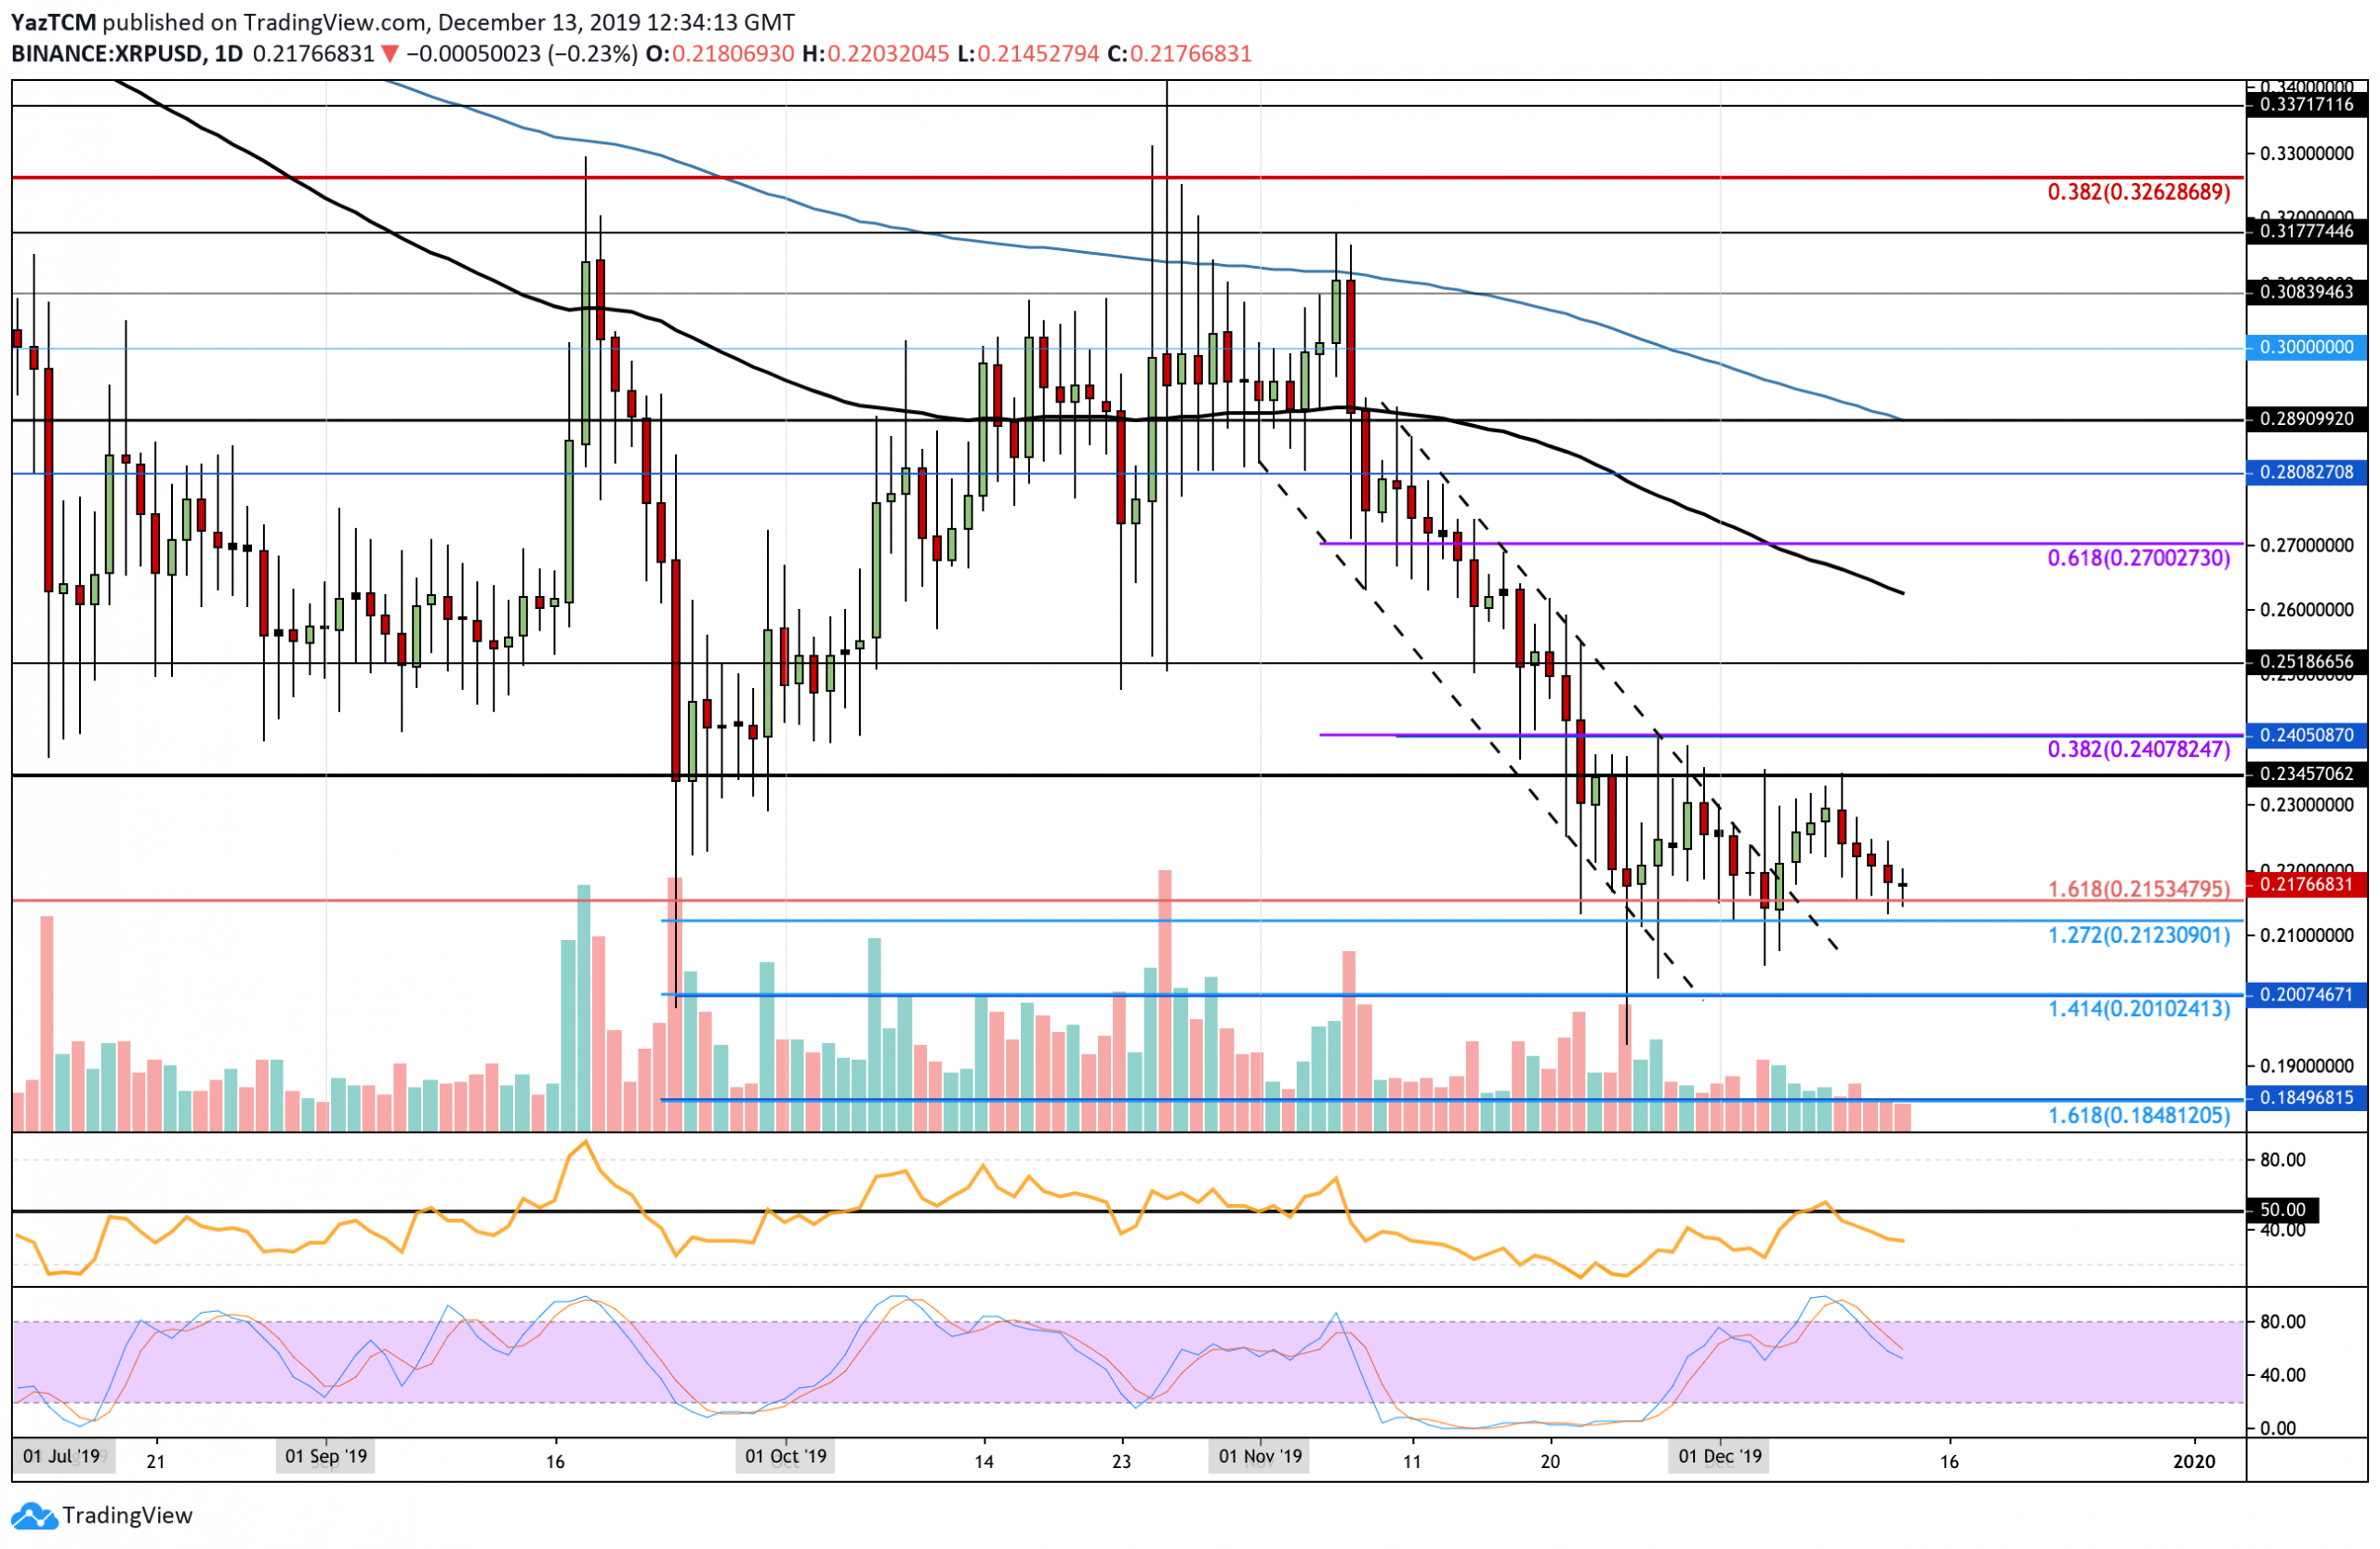
The daily chart shows that XRP was unable to make any ground above the resistance at $0.2345 which caused the market to roll over and head lower back into the support at $0.215. The resistance at $0.2345 is considered very strong as it had provided very strong support for the market during September 2019 and is expected to provide an equal level of resistance moving forward.
If XRP was to drop beneath the $0.2150 support, the cryptocurrency would turn strongly bearish. Alternatively, to turn bullish, it must break above the resistance at $0.2345 and continue above $0.24. XRP marked a monthly low on December 4th, dropping to around $0.209.
XRP Short Term Price Prediction
If the buyers can hold the current support and rebound higher from here, initial strong resistance lies at $0.2345 and $0.24 (short term bearish .382 Fibonacci Retracement level). Above this, resistance lies at $0.2520 and $0.26 (100-days EMA). Alternatively, if the sellers push beneath $0.2150, immediate support is located at $0.2110 and $0.21. Beneath $0.21, support lies at $0.20 and $0.1950.
The RSI is beneath the 50 level which shows the sellers in control over the market momentum. Furthermore, the Stochastic RSI recently produced a bearish crossover signal which sent the market lower.
XRP/BTC: XRP Holding Strong Above 3000 SAT
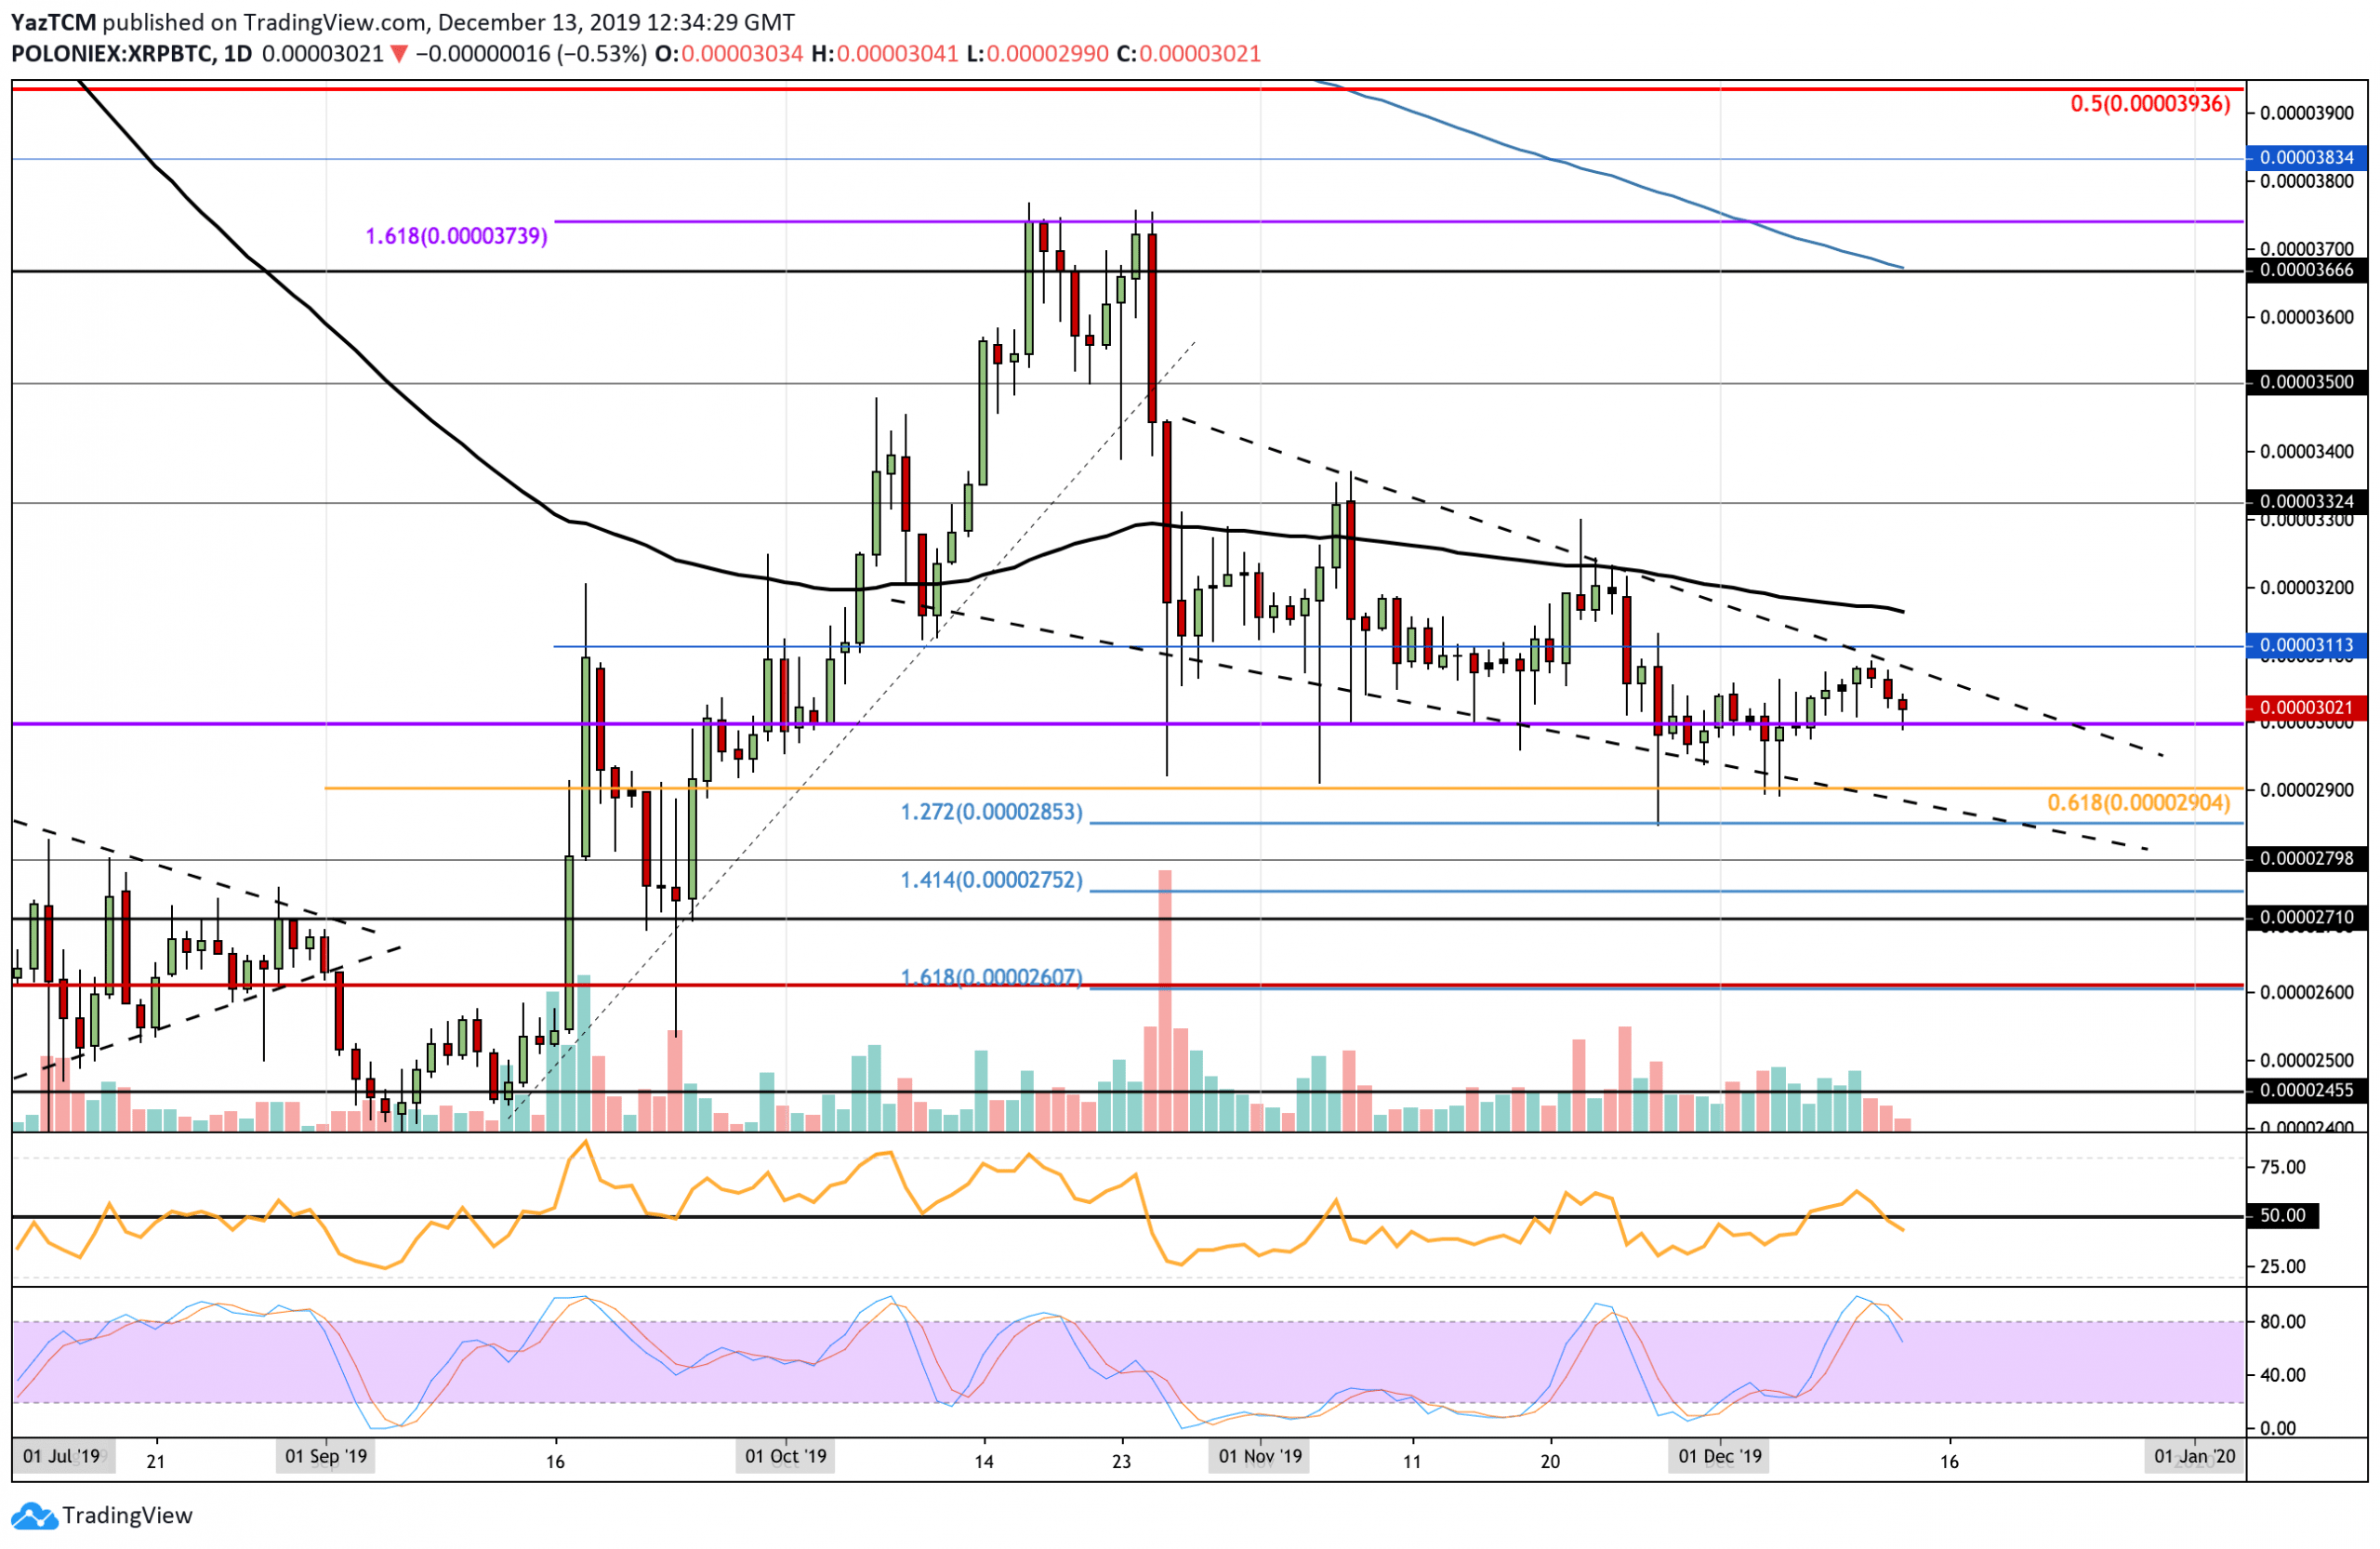
Against BTC, XRP holds strong above the 3000 SAT level and has been above for the entire period of December. It has been trapped within a steep descending channel and recently met resistance at the upper boundary.
XRP Short Term Price Prediction
Looking ahead, if the bulls can hold the current support and push higher, initial resistance lies at 3115 SAT. Above this, resistance can be expected at 3175 SAT (100-days EMA), 3324 SAT, and 3500 SAT. On the other hand, if the sellers push beneath the support at 3500 SAT, immediate support is expected at 2960 SAT. Beneath this, support lies at 2900 SAT (.618 Fib Retracement) and 2850 SAT. The RSI has recently dropped beneath the 50 level as the sellers attempt to gain control over the market momentum. The Stochastic RSI recently produced a bearish crossover signal which is a worrying sign for the buyers within the market.