Summary:
XRP continues to trade its sideways around the %excerpt%.25 price range. The cryptocurrency has seen a 2% price decline over the past 30 and is currently trading at %excerpt%.2578.XRP remains the third-largest cryptocurrency with a market cap of .32 billion.Looking at the XRP/USD 1-Day Chart:Since our previous XRP/USD analysis, the cryptocurrency has managed to find support at the %excerpt%.2518 level. XRP attempted to break above a long term descending trend line but failed to do so. Price is quickly approaching the apex, where a breakout is expected in either direction.From above: The nearest level of resistance lies at the falling trend line and at %excerpt%.2687. Above this, resistance is found at %excerpt%.2747, %excerpt%.2811, %excerpt%.2890, and %excerpt%.30. If the buyers push the market above %excerpt%.30, resistance can be found at %excerpt%.308
Topics:
Yaz Sheikh considers the following as important: XRP Analysis
This could be interesting, too:
CryptoVizArt writes XRP Breakout Imminent? Ripple Price Analysis Suggests a Decisive Move
CryptoVizArt writes Ripple Price Analysis: Where Is XRP Headed Following Massive Crash and Swift Rebound?
CryptoVizArt writes Ripple Price Analysis: Can XRP Reach in the Following Months?
CryptoVizArt writes Ripple Price Analysis: Can XRP Soar to Soon?
XRP continues to trade its sideways around the $0.25 price range. The cryptocurrency has seen a 2% price decline over the past 30 and is currently trading at $0.2578.
XRP remains the third-largest cryptocurrency with a market cap of $11.32 billion.
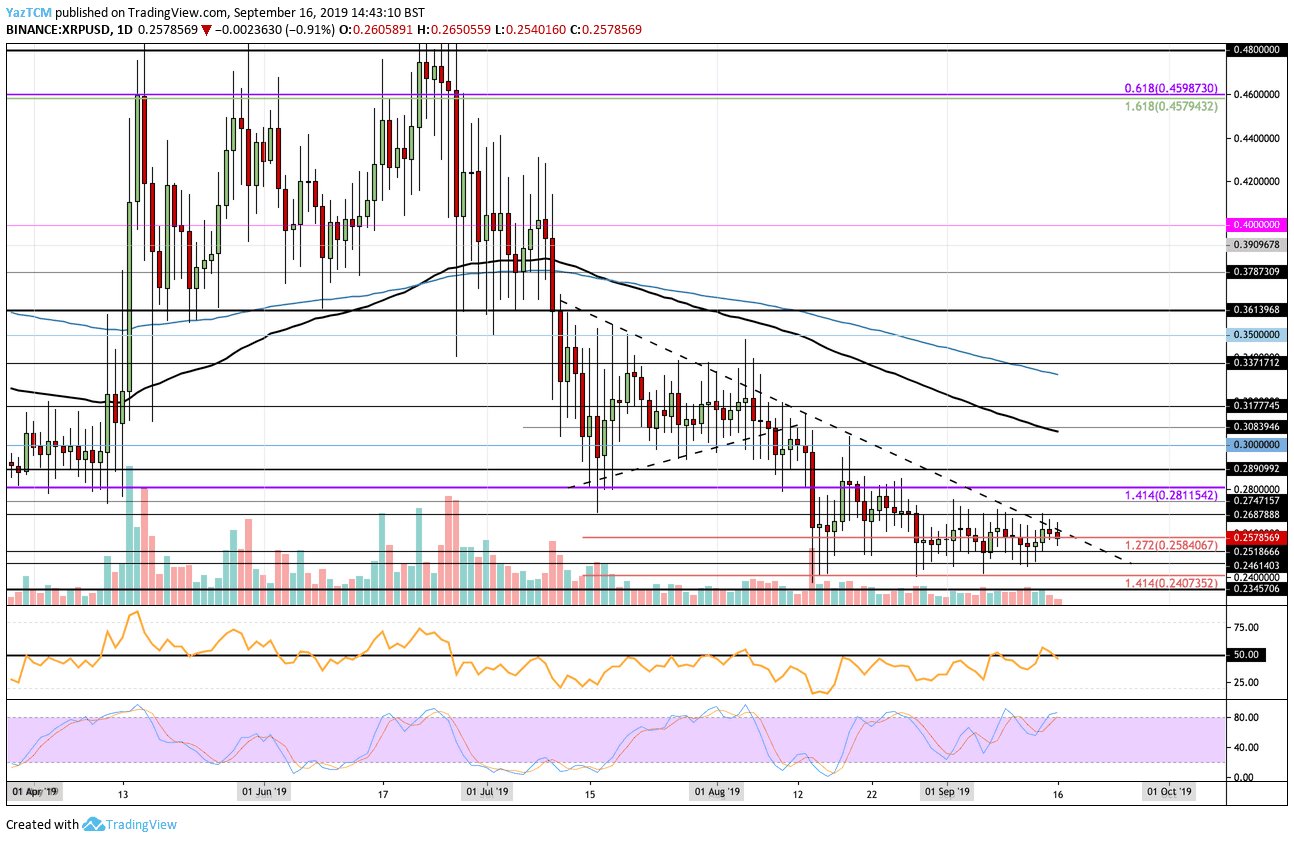
Looking at the XRP/USD 1-Day Chart:
- Since our previous XRP/USD analysis, the cryptocurrency has managed to find support at the $0.2518 level. XRP attempted to break above a long term descending trend line but failed to do so. Price is quickly approaching the apex, where a breakout is expected in either direction.
- From above: The nearest level of resistance lies at the falling trend line and at $0.2687. Above this, resistance is found at $0.2747, $0.2811, $0.2890, and $0.30. If the buyers push the market above $0.30, resistance can be found at $0.308 (100-days EMA), $0.3177, and $0.3350 (200-days EMA).
- From below: The nearest level of support lies at $0.2584. Beneath this, support can be found at $0.2518, $0.25, $0.2461, $0.24, and $0.2345.
- The trading volume still remains beneath the average level but is slowly increasing.
- The RSI has recently climbed above the 50 level but has failed to remain above. This shows major indecision within the market as the bulls and the bears battle to gain control. For a push higher, we would need to see the RSI climb further higher from the 50 level.
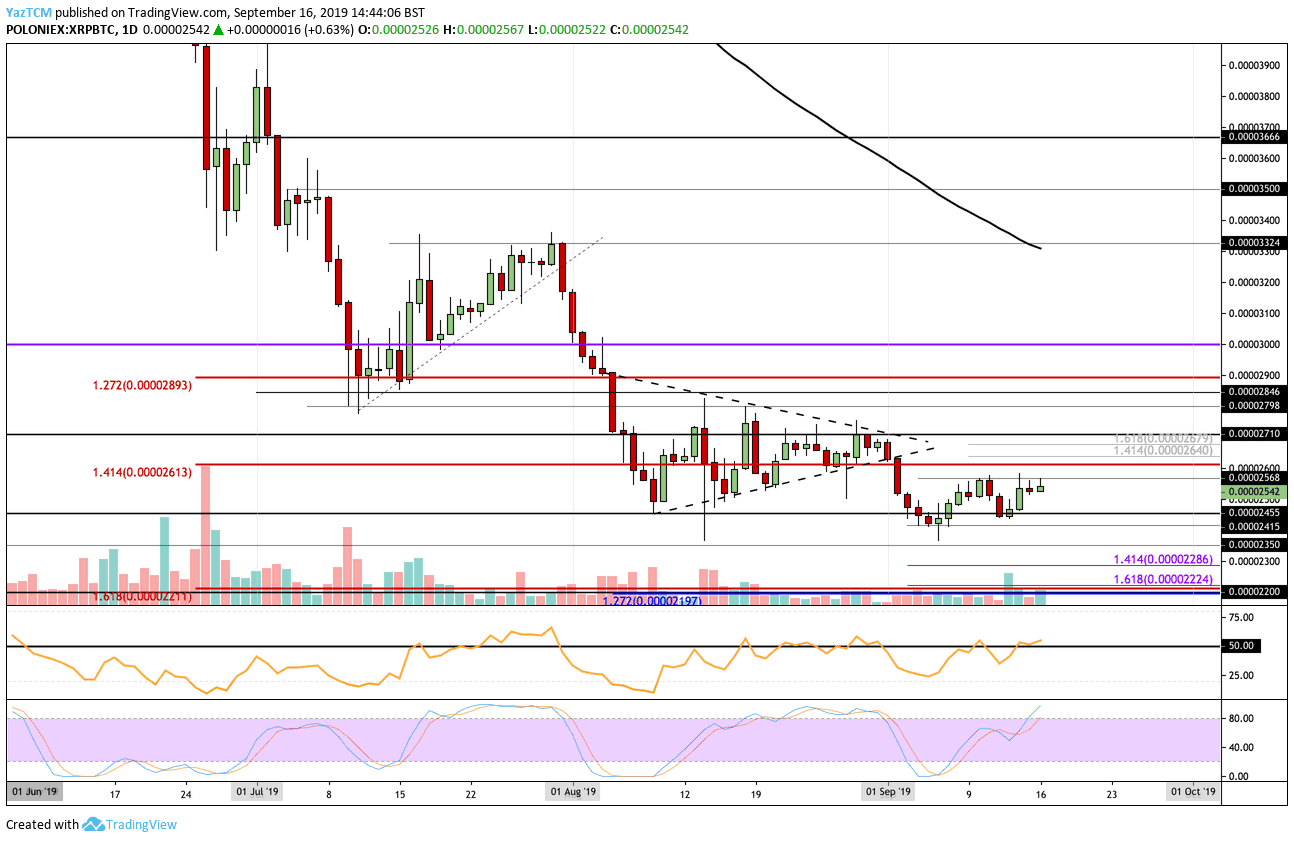
Looking at the XRP/BTC 1-Day Chart:
- Against Bitcoin, XRP continued to go lower until rebounding at support at the 2415 SAT level. The recent surge higher has caused XRP to meet the current resistance at 2570 SAT.
- From above: If the bulls can break above 2570 SAT, higher resistance lies at 2613 SAT, 2640 SAT, 2710 SAT, and 2800 SAT. Beyond that, resistance can be expected at 2846 SAT, 2900 SAT, 3000 SAT, and 3325 SAT (100-days EMA).
- From below: The nearest level of support lies at 2500 SAT. Beneath this, support is expected at 2455 SAT, 2415 SAT, and 2350 SAT. If the selling continues, support can be found at 2286 SAT, 2224 SAT, 2211 SAT, and 2200 SAT.
- The trading volume has seen a significant increase over the past couple of trading days.
- Likewise, the RSI has broken above the 50 level to show the bulls are in control over the market momentum.