Tezos surged by another 20% this week, allowing it to rise to the .56 level.The cryptocurrency now faces very strong resistance at the 0.0002 BTC level.Tezos is now the 11th largest cryptocurrency with a market cap upwards of billion.Key Support & Resistance LevelsXTZ/USDSupport: .23, .17, .12, .00.Resistance: .34, .40, .47.XTZ/BTC:Support: 0.0001685 BTC, 0.000158 BTC, 0.000138 BTC, and 0.000127 BTC.Resistance: 0.0001828 BTC, 0.000195 BTC level (November 2019 highs), 0.000206 BTC.XTZ/USD: Tezos Breaks 7-Month Old Falling Resistance LevelSince our last analysis, Tezos broke past the long-term descending trend line that had provided resistance for over 7-months! It continued to climb further higher to reach the expected resistance level at the .47, which was provided
Topics:
Yaz Sheikh considers the following as important: Price Analysis
This could be interesting, too:
CryptoVizArt writes ETH’s Path to K Involves Maintaining This Critical Support (Ethereum Price Analysis)
Duo Nine writes Crypto Price Analysis June-29: ETH, XRP, ADA, DOGE, and DOT
Duo Nine writes Crypto Price Analysis June-15: ETH, XRP, ADA, DOGE, and DOT
Duo Nine writes Why is the Shiba Inu (SHIB) Price Down Today?
- Tezos surged by another 20% this week, allowing it to rise to the $1.56 level.
- The cryptocurrency now faces very strong resistance at the 0.0002 BTC level.
- Tezos is now the 11th largest cryptocurrency with a market cap upwards of $1 billion.
Key Support & Resistance Levels
XTZ/USD
Support: $1.23, $1.17, $1.12, $1.00.
Resistance: $1.34, $1.40, $1.47.
XTZ/BTC:
Support: 0.0001685 BTC, 0.000158 BTC, 0.000138 BTC, and 0.000127 BTC.
Resistance: 0.0001828 BTC, 0.000195 BTC level (November 2019 highs), 0.000206 BTC.
XTZ/USD: Tezos Breaks 7-Month Old Falling Resistance Level
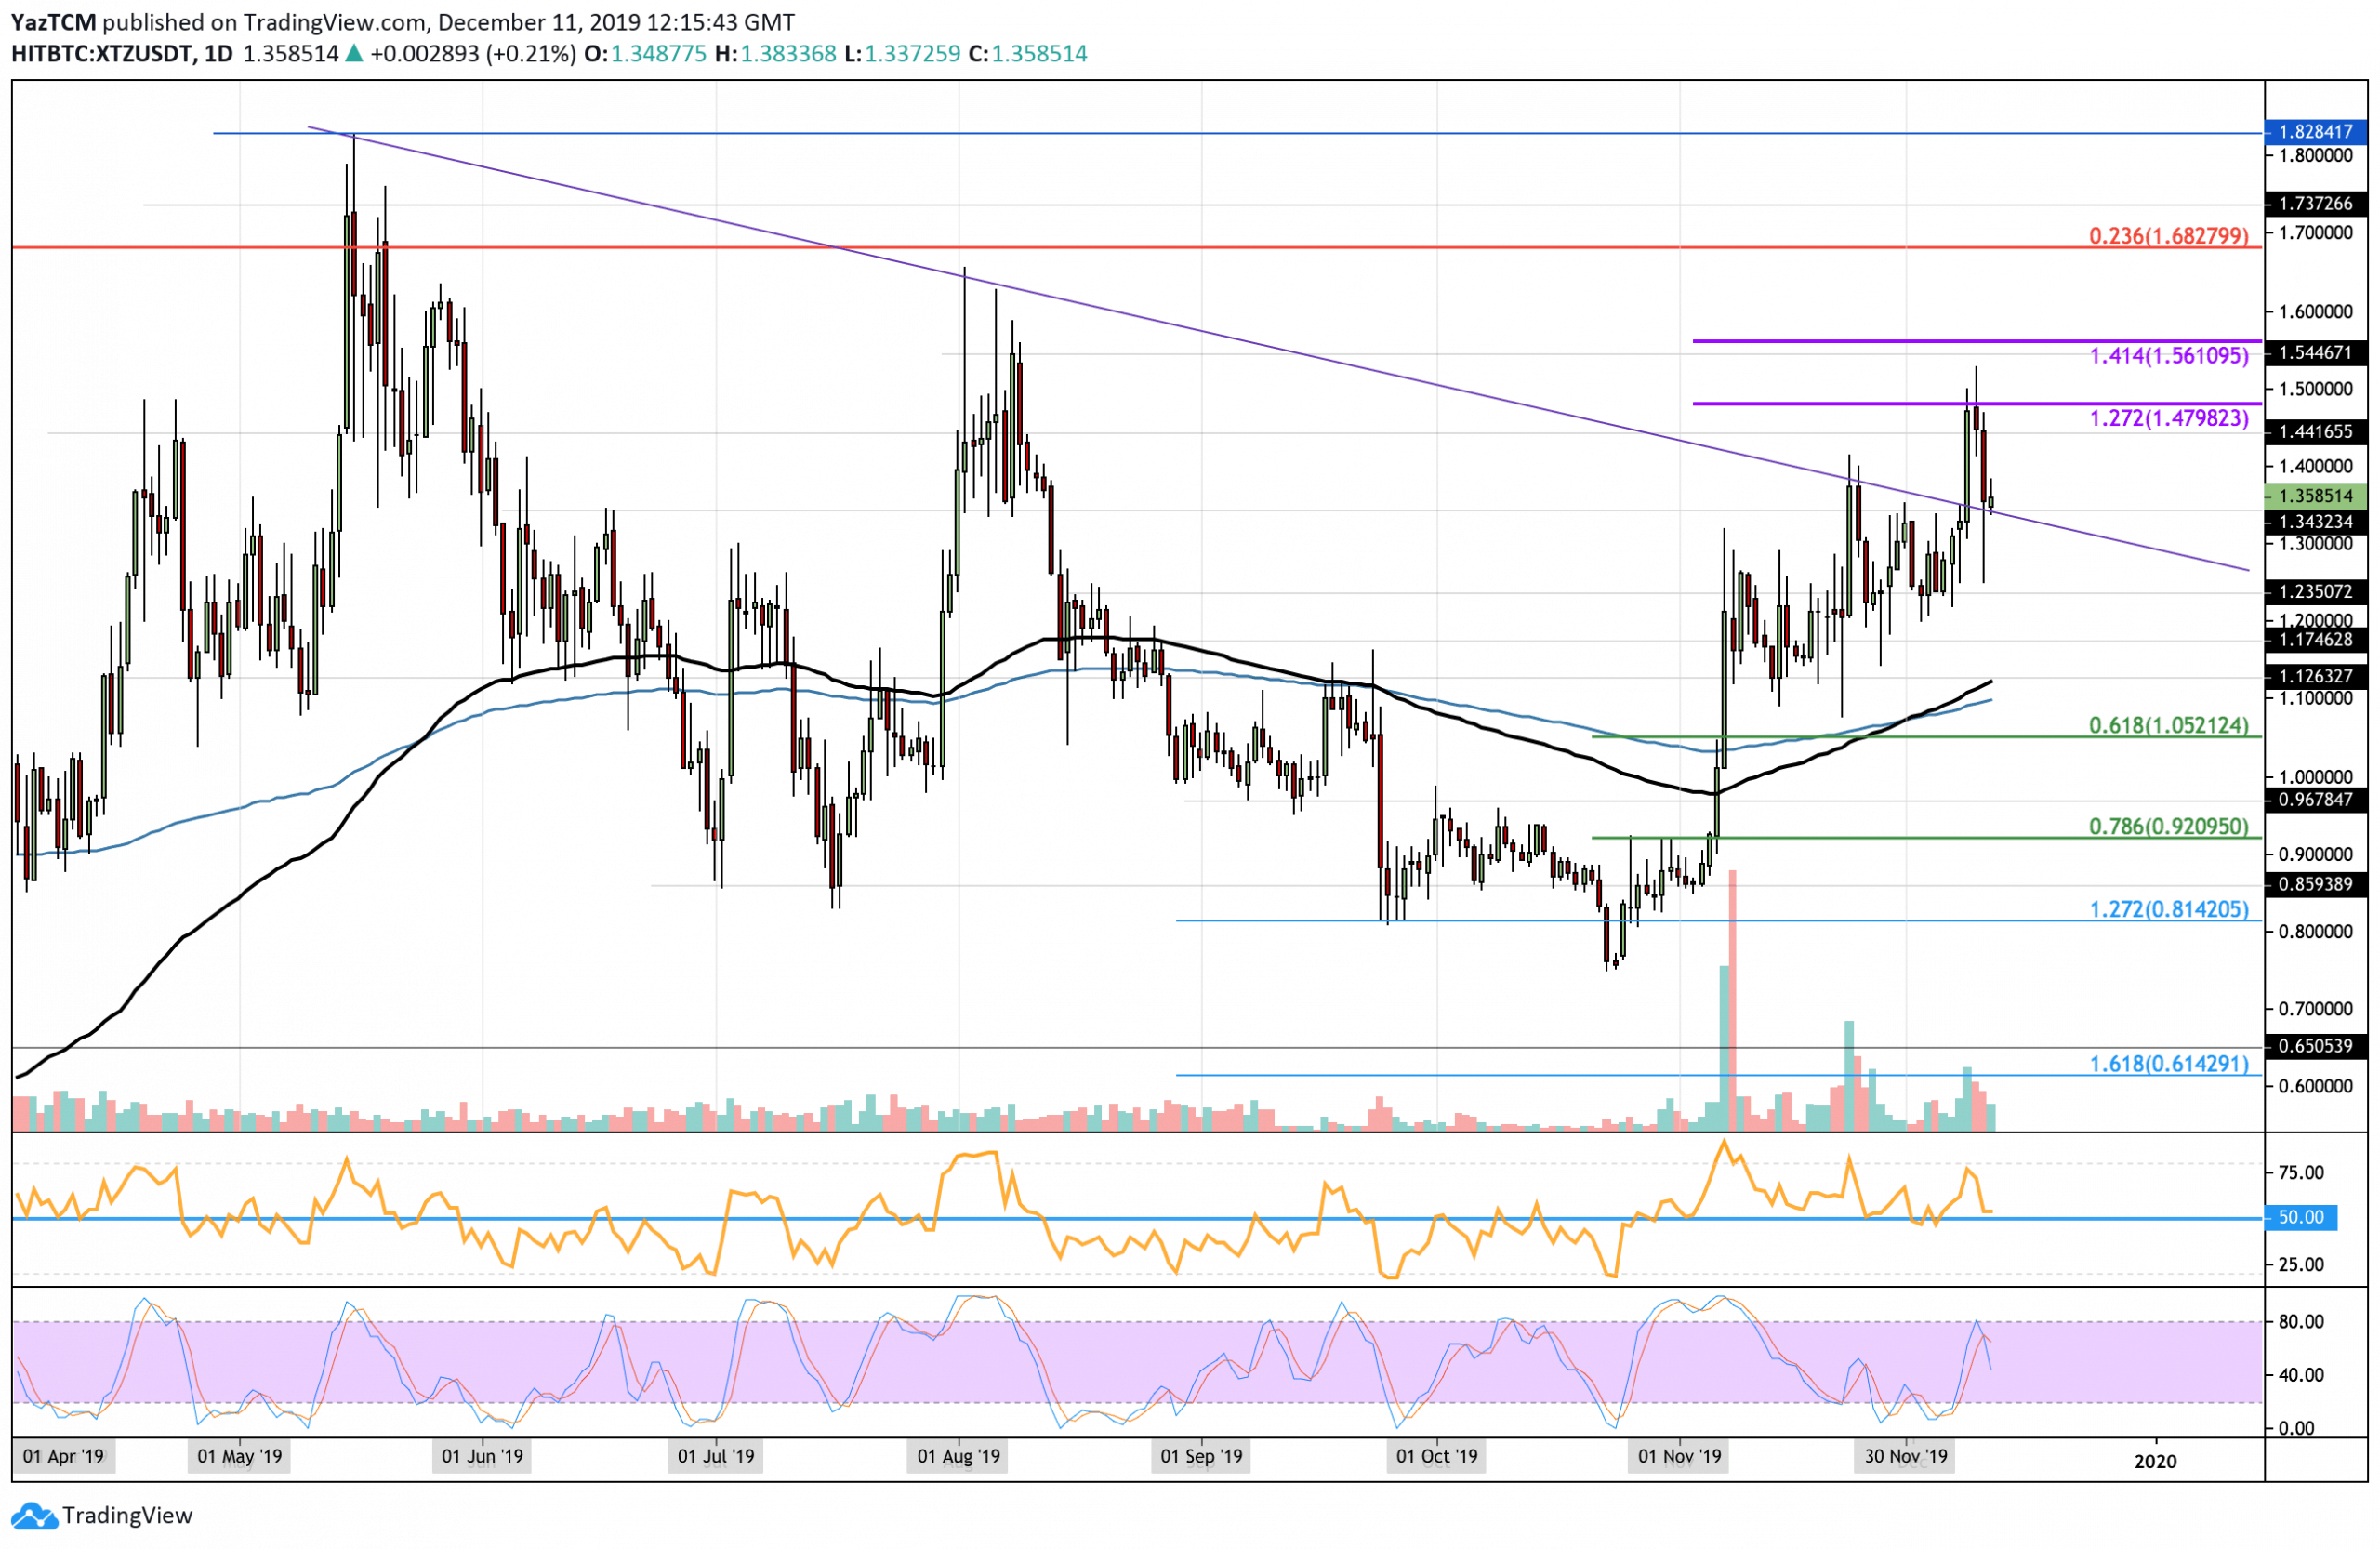
Since our last analysis, Tezos broke past the long-term descending trend line that had provided resistance for over 7-months! It continued to climb further higher to reach the expected resistance level at the $1.47, which was provided by a 1.272 Fibonacci Extension level.
After reaching this resistance, XTZ rolled over and returned into support at the $1.35 level. For this bullish extension to continue, the cryptocurrency must stay above the $1.50 resistance level.
Tezos Short Term Price Prediction
If the bulls regroup and start to push higher once again, immediate resistance is located at $1.47. Above this, added resistance is located at $1.56 (1.414 Fibonacci Extension), $1.68 (long term bearish .236 Fibonacci Retracement) and $1.80. Alternatively, toward the downside, support is expected at $1.23, $1.20, and $1.12 (100-days EMA).
The RSI has recently dropped but remains above the 50 level to show the bulls remain in charge of the momentum. However, the Stochastic RSI recently produced a bearish crossover signal which will add bearish pressure to the coin,
XTZ/BTC: Strong Resistance Ahead At 0.0002 BTC
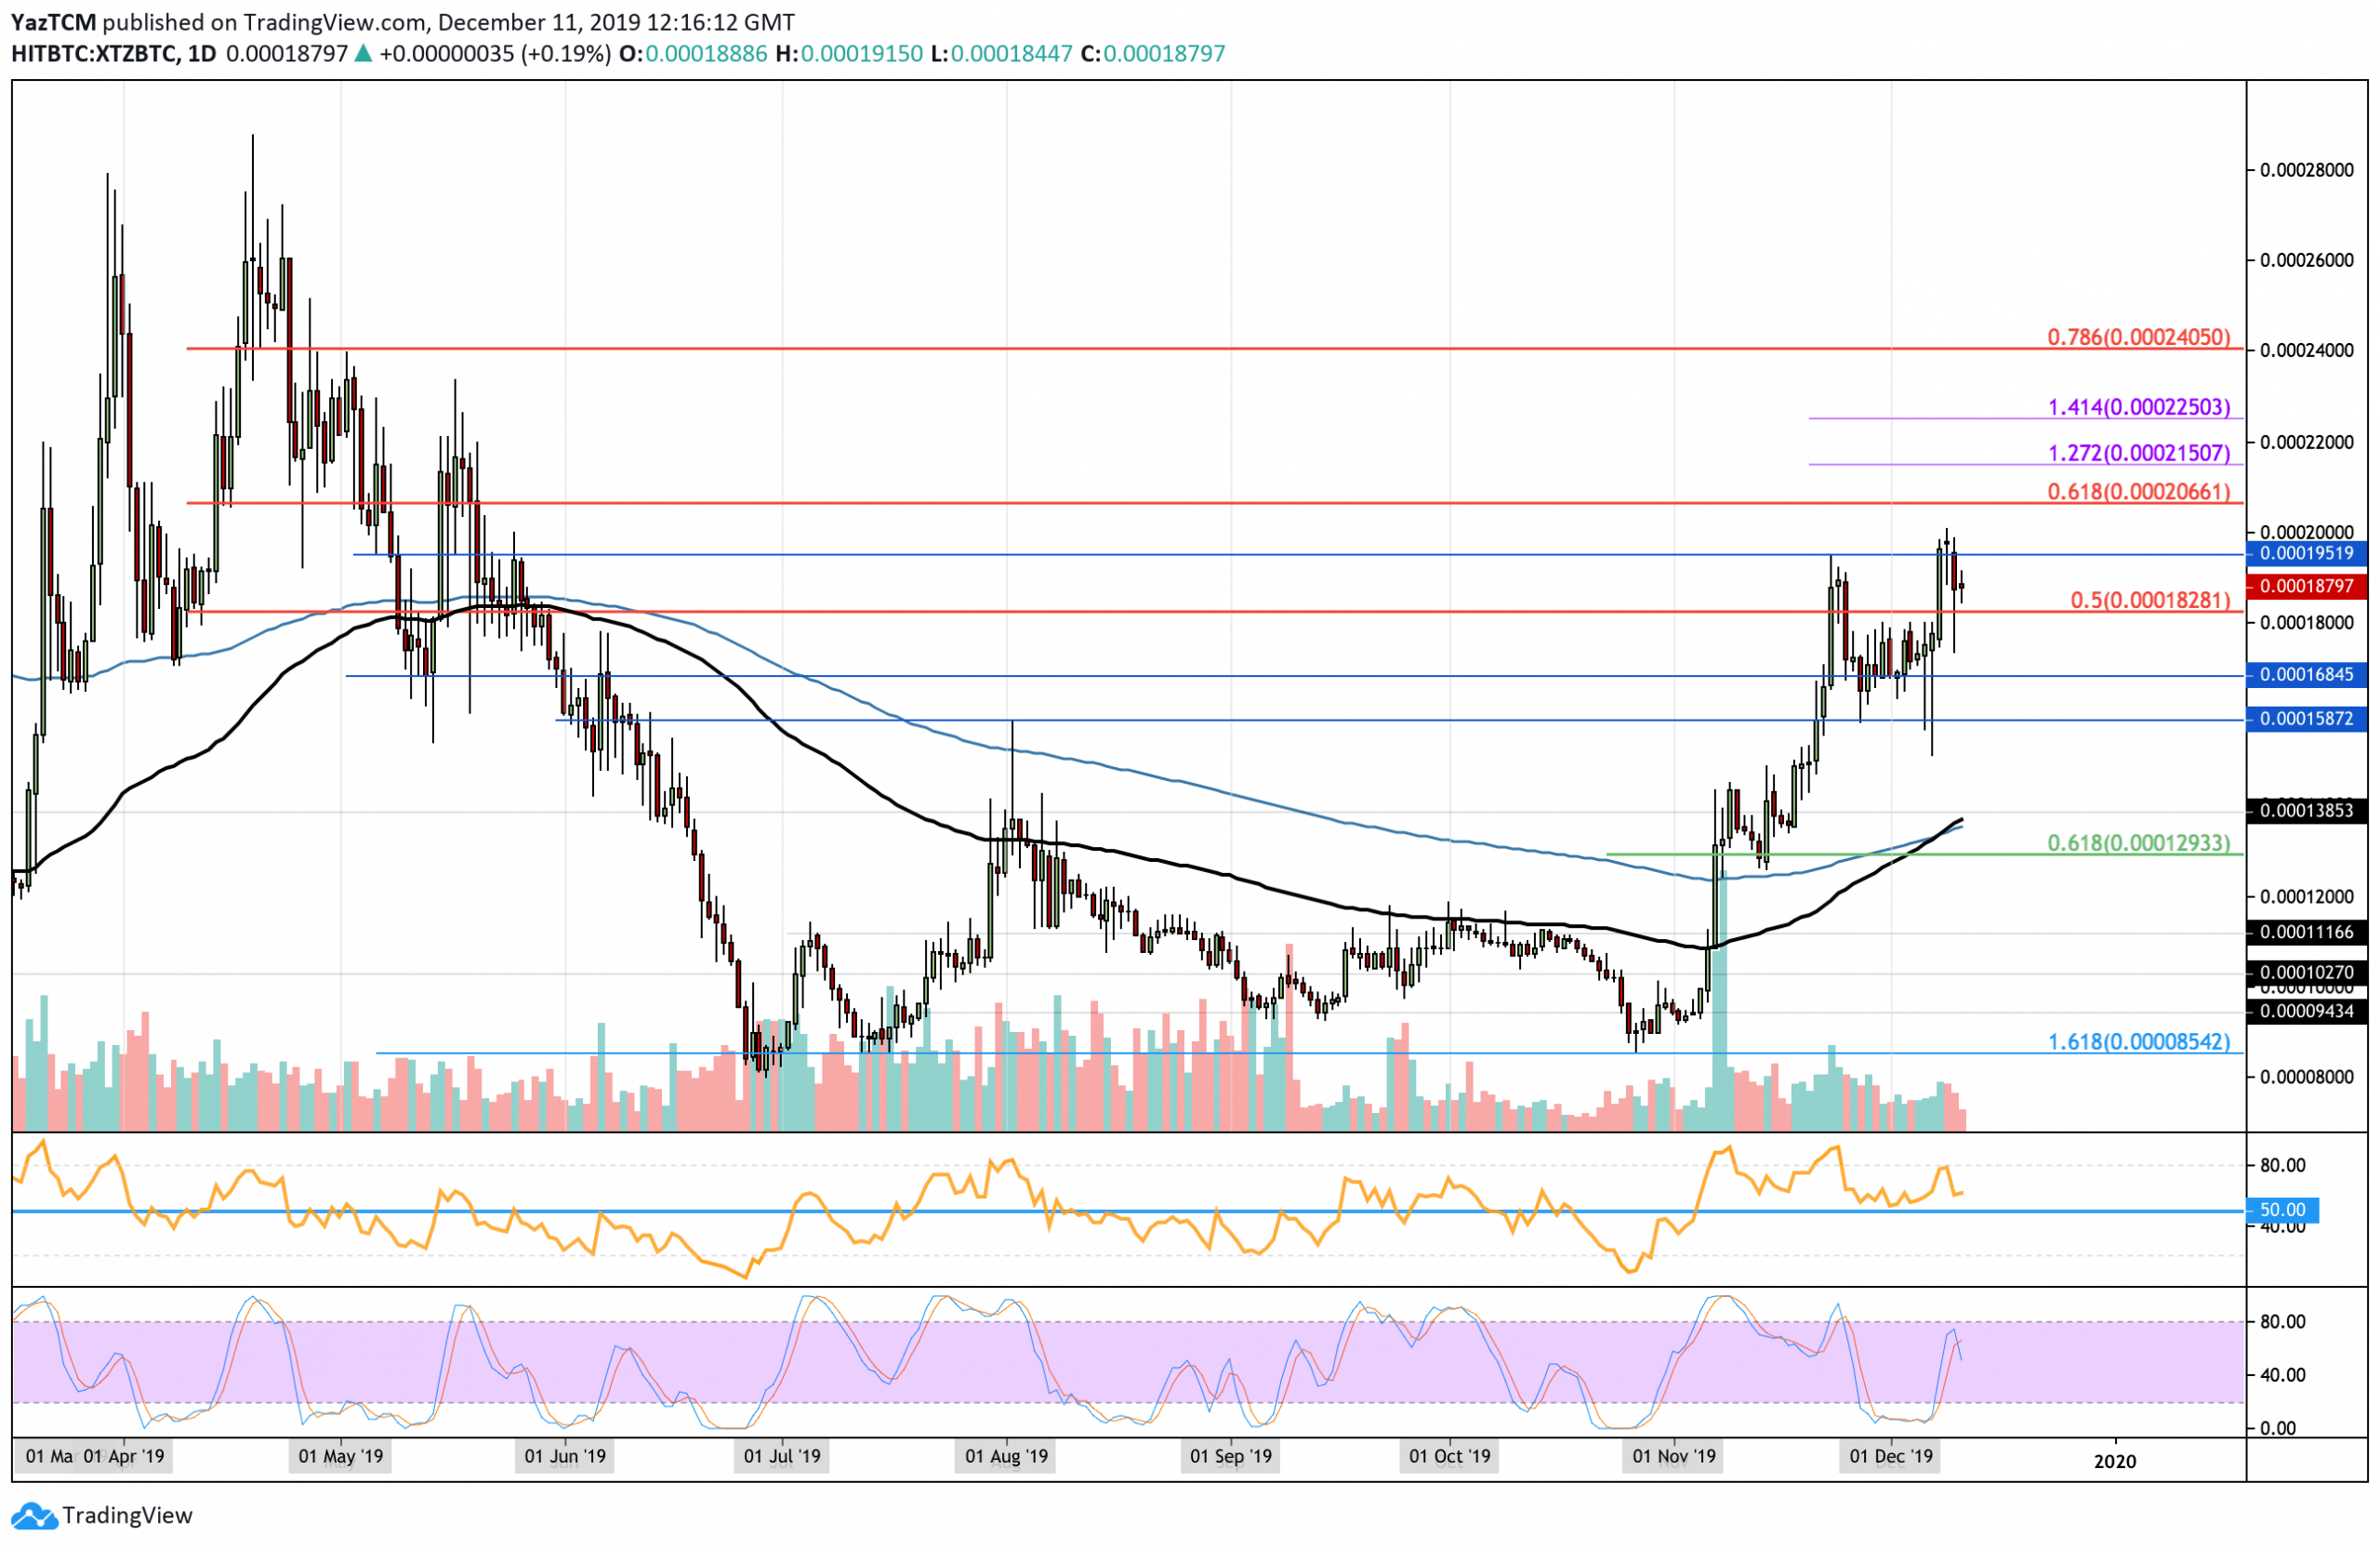
Against Bitcoin, Tezos made ground above the resistance at 0.00018 BTC and continued to break above the November high at 0.0001951 BTC. However, the cryptocurrency recently met stiff resistance at the 0.0002 BTC level, causing the cryptocurrency to fall slightly.
For the bullish momentum to continue, Tezos must rise above the resistance at 0.0002 BTC. Alternatively, if XTZ were to fall beneath 0.00015 BTC, the condition would turn bearish.
Tezos Short Term Price Prediction
If the buyers regroup and start to push higher again, resistance lies at 0.0002 BTC. Above this, resistance is expected closely at 0.000206 BTC, 0.00021 BTC (1.272 Fib Extension), and 0.0002250 BTC (1.414 Fib Extension). On the other hand, if the sellers push the market lower, support lies at 0.00018 BTC, 0.000168 BTC and, 0.000159 BTC.
The RSI has recently dipped lower from overbought conditions, which shows the buyers’ momentum fading. Furthermore, there is some divergence between the RSI and price action as the RSI creates a fresh low while prices create new highs. This could signal a potential strong reversal up ahead.