Chainlink continued to gain momentum in the channel. In the last seven days, LINK is up more than 15%. Against BTC, price and volume are in contrast, but LINK’s bullish trend remains valid on the 4-hours chart. LINK/USD: Chainlink Recovery Holds In a Five-Week Channel Key Resistance Levels: .8, , .5 Key Support Levels: .38, , .5 LINK/USD. Source: TradingViewChainlink saw a small 4% recovery overnight after witnessing a 3-day drop from .8 (on April 18) to .38 yesterday. This recovery has poised Link for a fresh increase to . While showing strength, the price is currently hovering around .61 against the US Dollar. Chainlink is looking bullish, but it may drop a bit to if the orange trend line fails to hold as support. As spotted on the 4-hours chart, Link started a
Topics:
Michael Fasogbon considers the following as important: Chainlink (LINK) Price, LINKBTC, LINKUSD, Price Analysis
This could be interesting, too:
Chayanika Deka writes Chainlink’s MVRV Ratio Signals Selling Exhaustion: What’s Next for LINK?
Chayanika Deka writes Whale and Shark Activity Pushes Chainlink (LINK) Past For the First Time in 37 Months
Martin Young writes Chainlink Partners With Major Finance Firms on AI, Oracles, and Blockchain Data Solution Project
Dimitar Dzhondzhorov writes Top 10 Cryptocurrencies by ‘Notable Development Activity’ (Santiment)
- Chainlink continued to gain momentum in the channel.
- In the last seven days, LINK is up more than 15%.
- Against BTC, price and volume are in contrast, but LINK’s bullish trend remains valid on the 4-hours chart.
LINK/USD: Chainlink Recovery Holds In a Five-Week Channel
Key Resistance Levels: $3.8, $4, $4.5
Key Support Levels: $3.38, $3, $2.5
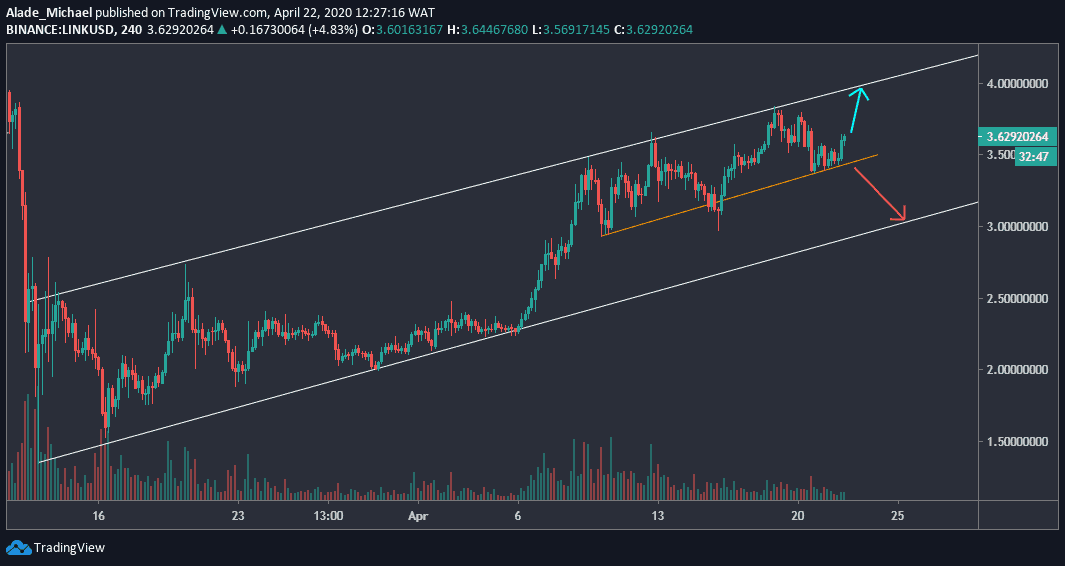
Chainlink saw a small 4% recovery overnight after witnessing a 3-day drop from $3.8 (on April 18) to $3.38 yesterday. This recovery has poised Link for a fresh increase to $4.
While showing strength, the price is currently hovering around $3.61 against the US Dollar.
Chainlink is looking bullish, but it may drop a bit to $3 if the orange trend line fails to hold as support. As spotted on the 4-hours chart, Link started a bullish trend after crashing to $1.3 in March.
The price has continued to respect an ascending channel for the past weeks. Chainlink’s price would continue to increase as long as this channel remains valid. A breakout would determine whether the bullish action will continue or not.
Chainlink Price Analysis
Link is currently supported by the orange trend line. If this trend line continues to hold, the price may retest current monthly resistance of $3.8, followed by $4 and perhaps in the long-run $4.5, which is currently above the channel.
Meanwhile, Chainlink is holding weekly support level at $3.38, around the orange line.
A sell below this level should pull the price back to the channel’s support at $3. A bearish play is likely if Link dips below this channel. The closest support to watch here is $2.5.
LINK/BTC: Chainlink Struggling At Supply Area
Key Resistance Levels: 52600 SAT, 54000 SAT, 56000 SAT
Key Support Levels: 50000 SAT, 46800 SAT, 43400 SAT
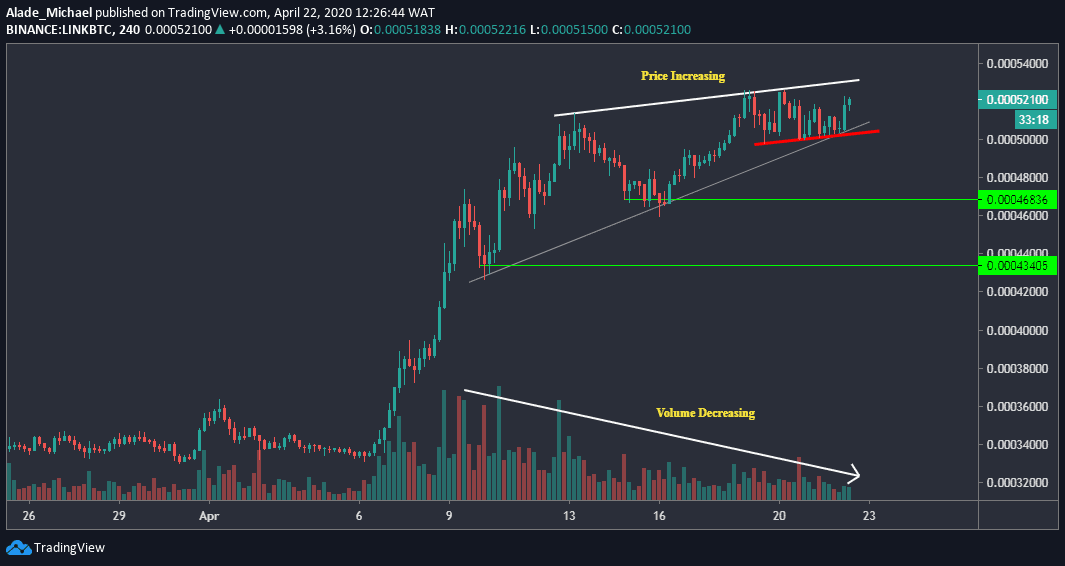
Following Bitcoin’s latest recovery to $7000 mark, Chainlink also saw a nice 4% increase over the last 24-hours. The price has increased slightly to around 52000 SAT at the time of this writing.
It’s important to pay attention to the price and volume, which are currently in disagreement on the 4-hours time frame. While Chainlink’s price increased above 50000 SAT level, the volume continues to fading to indicate weakness in demand.
Meanwhile, the price is stuck around the supply area of 52400 SAT for a while now, putting Link in a consolidation mode. A big move is around the corner.
Another thing to pay attention to is the double-top formation, which is most likely to position Chainlink in a bearish condition any moment from now. But if the grey ascending line can hold for long, the ongoing consolidation might just be the starting point of a new bullish cycle.
Chainlink Price Analysis
If Chainlink drops below the red support line of 50000 SAT– along with the grey trend line – it could induce a sell to 46800 SAT support at the first green line.
A double-top pattern is likely to play if this support breaks. The following level to watch is 43400 SAT support.
On the other hand, Chainlink could as well climb back to 52600 SAT resistance. A successful break above this resistance could initiate a buy to 54000 SAT and 56000 SAT resistance in a mid-term