CRO found support around %excerpt%.1, but it is still shaky to provide a strong rebound.It is now ranked 11th by market cap, following 260% growth in three months.Against Bitcoin, CRO buyers appear exhausted after five weeks of parabolic movements.CRO/USD: CRO Exhausting Bullish MomentumKey Resistance Levels: %excerpt%.1165, %excerpt%.1176, %excerpt%.1193Key Support Levels: %excerpt%.11, %excerpt%.105, %excerpt%.1CRO/USD. Source: TradingViewThe steady increase in CRO’s price has been quite impressive and significant, with about 260% gains over the last three months. After touching %excerpt%.1193 last week, the price dropped to near %excerpt%.1 and managed to bounce back to where it’s currently trading around %excerpt%.114.However, the daily move is likely to end soon, considering the last 12 days of decreasing volume. This signals a potential bearish
Topics:
Michael Fasogbon considers the following as important: CROBTC, CROUSD, crypto.com, Price Analysis
This could be interesting, too:
Bitcoin Schweiz News writes SEC gibt auf: Ermittlungen gegen Crypto.com offiziell eingestellt
Bitcoin Schweiz News writes Trump Media kooperiert mit Crypto.com für ETFs auf Truth.Fi
Emily John writes Crypto.com Joins Accor ALL for Crypto Loyalty Boost
Mandy Williams writes Crypto.com Joins Forces With Germany’s Deutsche Bank to Offer Banking Services
- CRO found support around $0.1, but it is still shaky to provide a strong rebound.
- It is now ranked 11th by market cap, following 260% growth in three months.
- Against Bitcoin, CRO buyers appear exhausted after five weeks of parabolic movements.
CRO/USD: CRO Exhausting Bullish Momentum
Key Resistance Levels: $0.1165, $0.1176, $0.1193
Key Support Levels: $0.11, $0.105, $0.1
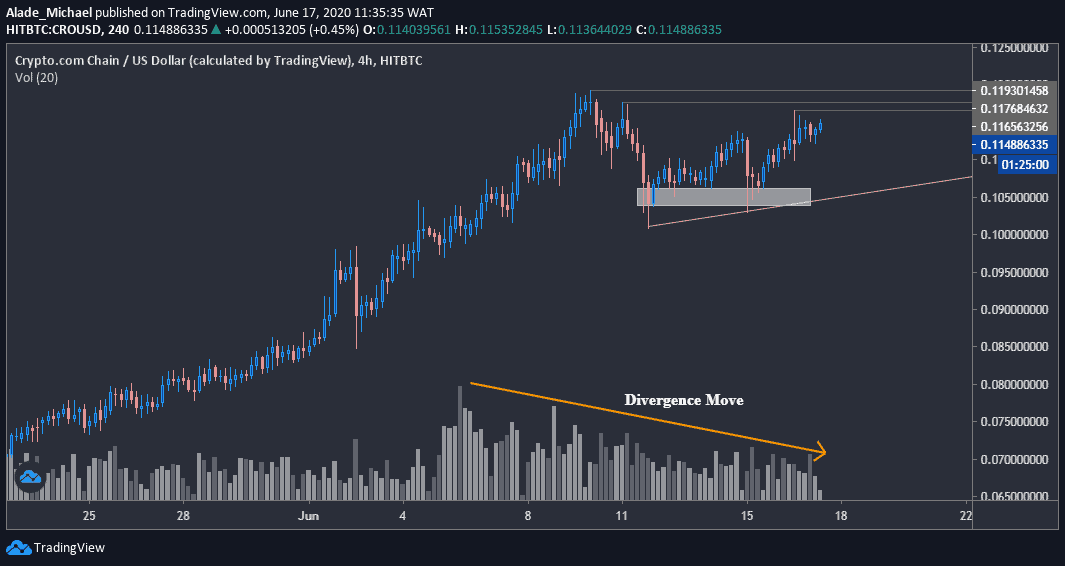
The steady increase in CRO’s price has been quite impressive and significant, with about 260% gains over the last three months. After touching $0.1193 last week, the price dropped to near $0.1 and managed to bounce back to where it’s currently trading around $0.114.
However, the daily move is likely to end soon, considering the last 12 days of decreasing volume. This signals a potential bearish divergence on the 4-hours time frame.
It is currently facing many resistance lines, marked grey on the chart. Meanwhile, the June 11th and 15th rebounds indicate that bulls are trying to resume pressure. But if they fail this time, the bears could take over the market. Still, the price is up by 2.30% at the time of writing.
CRO Price Analysis
Yesterday, CRO got rejected at $0.1165 after increasing by 3%. If the bulls retake this level, they would need to overcome the $0.1176 and $0.1193 resistances before confirming another leg up possibly to around $0.125 and $0.15 in the future.
In case of a drop, the key level of support to keep in mind is $0.11near, the rising red line. Below this, lies a white demand zone of $0.105, followed by $0.1, where it recently found a rebound.
An intense sell action should be expected if the price dips beneath this psychological level.
CRO/BTC: CRO Looks Challenged At Supply Zone
Key Resistance Levels: 12311 SAT, 12500 SAT, 15000 SAT
Key Support Levels: 11600 SAT, 11250 SAT, 10000 SAT
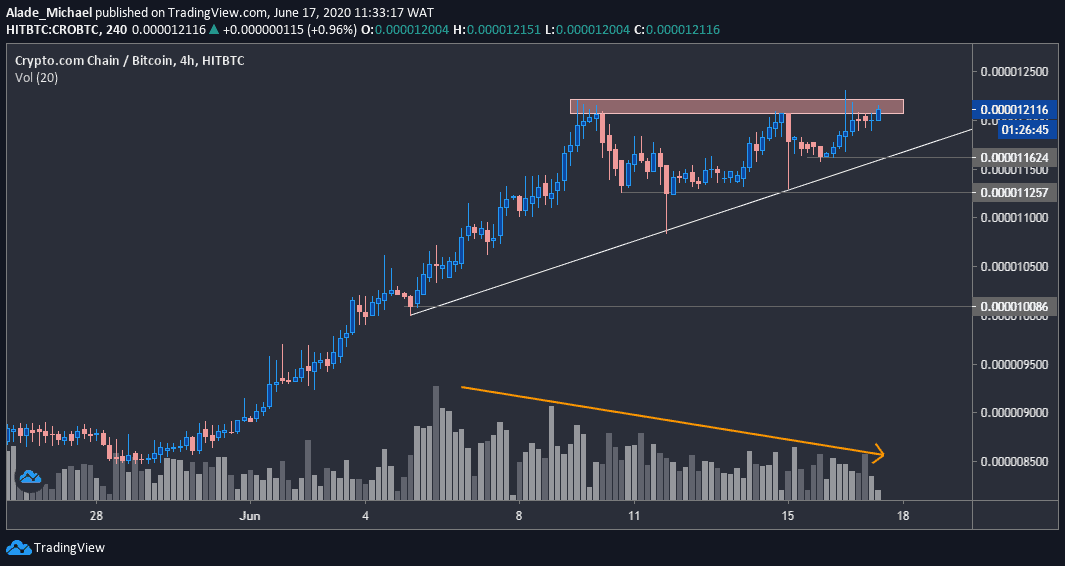
Against Bitcoin, the bullish run was initiated before December 2019 after finding a bottom at around 3500 SAT. The momentum becomes more significant when it started to go parabolic in mid-May, surpassing the 8220 SAT that was first created as yearly high in February.
After reaching 12311 SAT on HitBTC yesterday, it appeared the momentum is getting weak on the daily chart. The current 4-hour chart also suggests buying exhaustion with a series of rejection candles over the past 24-hours. However, it could be a starting point of a new rally.
But if the red supply zone formed as double-top, a reversal may come into play with a huge selloff. As of now, the price is hovering around 12000 SAT level with 2.88% gains under 24-hours.
CRO Price Analysis
The price is currently trading in a supply zone. If CRO reaccumulates, it would need to clear the 12311 SAT level before heading further to 12500 SAT.
The white rising line is currently providing support for the market. If a double-top pattern comes into play, the price could decrease straight to the 10000 SAT level, where it started to form. On the way, close supports to watch is yesterday’s low of 11600 SAT and 11250 SAT (last week low).
Also, it is important to keep an eye on the decreasing volume on the chart to gauge a potential divergence.