MATIC is looking bullish following a 10% surge over the last 24-hours.Against Bitcoin, it is providing a discount after surging to the 3304 SAT level yesterday.MATIC/USD: Matic Looks Indecisive After A RejectionKey Resistance Levels: %excerpt%.0276, %excerpt%.0296, %excerpt%.043Key Support Levels: %excerpt%.022, %excerpt%.019, %excerpt%.017MATIC/USD. Source: TradingViewMatic Network saw over 300% gains to recover from the heavy price crash to %excerpt%.006 in mid-March. In fact, the recent surge above the rising channel is suggesting a mid-term bullish play. However, MATIC is currently facing supply at %excerpt%.028 -%excerpt%.030 area.Meanwhile, the May 15 break above the grey regression line was a green light for a continuation, followed by a 12-day consolidation before the surge.As shown in the above daily chart, the price was rejected twice around
Topics:
Michael Fasogbon considers the following as important: matic network, MATICBTC, MATICUSD, Price Analysis
This could be interesting, too:
CryptoVizArt writes ETH’s Path to K Involves Maintaining This Critical Support (Ethereum Price Analysis)
Duo Nine writes Crypto Price Analysis June-29: ETH, XRP, ADA, DOGE, and DOT
Duo Nine writes Crypto Price Analysis June-15: ETH, XRP, ADA, DOGE, and DOT
Duo Nine writes Why is the Shiba Inu (SHIB) Price Down Today?
- MATIC is looking bullish following a 10% surge over the last 24-hours.
- Against Bitcoin, it is providing a discount after surging to the 3304 SAT level yesterday.
MATIC/USD: Matic Looks Indecisive After A Rejection
Key Resistance Levels: $0.0276, $0.0296, $0.043
Key Support Levels: $0.022, $0.019, $0.017
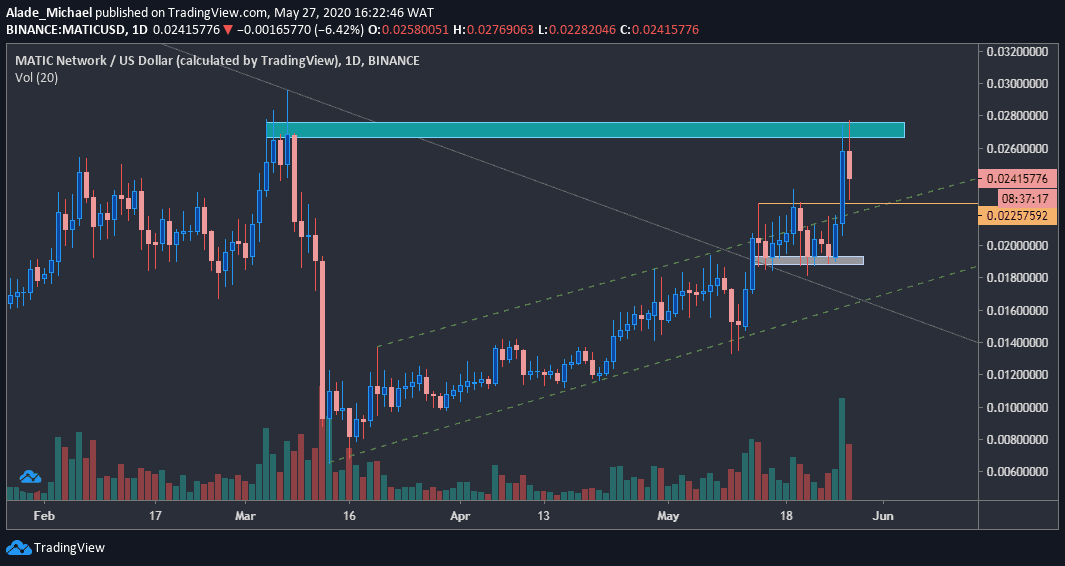
Matic Network saw over 300% gains to recover from the heavy price crash to $0.006 in mid-March. In fact, the recent surge above the rising channel is suggesting a mid-term bullish play. However, MATIC is currently facing supply at $0.028 -$0.030 area.
Meanwhile, the May 15 break above the grey regression line was a green light for a continuation, followed by a 12-day consolidation before the surge.
As shown in the above daily chart, the price was rejected twice around $0.028 to show exhaustion in the buyers, but volume is still increasing. A small pullback is expected to strengthen the next bullish actions as more gains would surface if the price is pushed above this supply area.
As of now, the price is trading around the $0.025 level against the US Dollar.
Matic Price Analysis
The current daily candle shows indecisiveness in the market after price wicked at $0.027 high and $0.023 low today. If the price increases, Matic would need to surpass today’s high before it can touch $0.0296 – the current yearly high.
Once this price breaks, the next bullish target would be $0.043, where Matic dumped 80% in December 2019.
There’s a pullback level around the channel’s resistance-turned-support at $0.022, marked orange on the daily chart. Below this level lies the white demand area of $0.019. The next support is located at $.017 – right around the channel’s lower boundary.
MATIC/BTC: Matic Provide Discount After Surge
Key Resistance Levels: 300 SAT, 320 SAT, 340 SAT
Key Support Levels: 260 SAT, 237 SAT, 210 SAT

Against Bitcoin, Matic started to increase after finding support around 165 SAT on May 11. After a three day bounce, the price struggled under 240 SAT level before witnessing a breakup this week.
However, the trend is currently looking bullish following a 7% surge in less than 24 hours. Though the price touched 304 SAT today, but failed to hold above the key psychological level of 300 SAT due to a sharp drop.
Matic is providing a discount at around the 280 SAT level at the time of writing, as more can be expected if the price drops below the current support at 260 SAT. If such a scenario occurs, there’s hope for a rebound at the green trend line. The bears could take over again if the trend line fails to act as support.
Matic Price Analysis
If Matic drops below the immediate level of 260 SAT, the key level to watch for a rebound is 237 SAT, which corresponds with the green ascending line. There’s a demand area around the 210 SAT level if a breakdown occurs.
For a bullish continuation, Matic would need to reclaim 300 SAT level before advancing higher to around 320 SAT and 340 SAT levels in the coming days.