After losing on Tuesday, Bitcoin Cash slowly bounced back to about 6.Against Bitcoin, it is trading nicely above 0.026 BTC following a recovery from a four-week low.The mid-term target for BCH lies at 495 if it successfully breaks above the crucial 0 level.BCH/USD: BCH Charging Towards Key Resistance AgainKey Support Levels: 6, 1, 2Key Resistance Levels: 5, 2, 0BCH/USD. Source: TradingViewFew minutes after our previous analysis on Tuesday, Bitcoin Cash lost almost following a quick rejection from the crucial supply area of 6 – 1, which is suppressing bullish actions for the past three months now.As volatility remains low, it is currently consolidating under the grey-marked supply area. A break above would send a strong buy signal. Considering the
Topics:
Michael Fasogbon considers the following as important: BCHBTC, bchusd, Bitcoin Cash (BCH) Price, Price Analysis
This could be interesting, too:
CryptoVizArt writes ETH’s Path to K Involves Maintaining This Critical Support (Ethereum Price Analysis)
Duo Nine writes Crypto Price Analysis June-29: ETH, XRP, ADA, DOGE, and DOT
Duo Nine writes Crypto Price Analysis June-15: ETH, XRP, ADA, DOGE, and DOT
Duo Nine writes Why is the Shiba Inu (SHIB) Price Down Today?
- After losing $35 on Tuesday, Bitcoin Cash slowly bounced back to about $256.
- Against Bitcoin, it is trading nicely above 0.026 BTC following a recovery from a four-week low.
- The mid-term target for BCH lies at 495 if it successfully breaks above the crucial $280 level.
BCH/USD: BCH Charging Towards Key Resistance Again
Key Support Levels: $266, $281, $352
Key Resistance Levels: $235, $222, $200
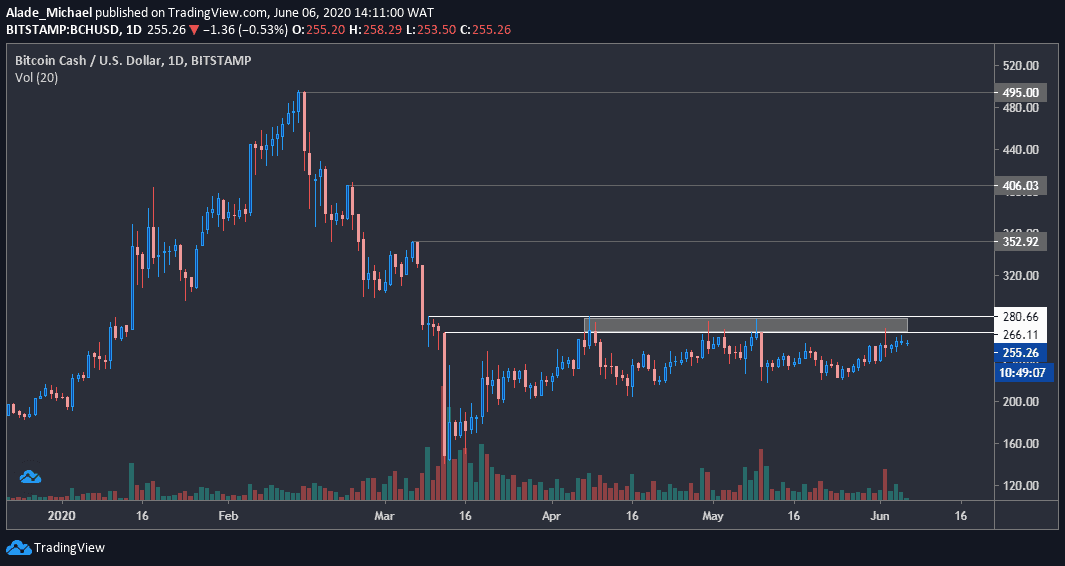
Few minutes after our previous analysis on Tuesday, Bitcoin Cash lost almost $35 following a quick rejection from the crucial supply area of $266 – $281, which is suppressing bullish actions for the past three months now.
As volatility remains low, it is currently consolidating under the grey-marked supply area. A break above would send a strong buy signal. Considering the slight decrease in the BCH market cap, the bears may take the wheel.
Bitcoin Cash Price Analysis
Bitcoin Cash is currently looking for a break as it slowly builds up around a strong supply area, mentioned above. Once BCH conquers this area, the price targets for the mid-term bulls would be $495 yearly high that was printed in February. But the closest resistance to watch is $352.
The price may roll back to the weekly low of $235 if the supply area continues to halt buying pressure. The levels to watch below this low are $222 and $200 in case of a further drop.
Looking at the current indecisiveness, which suggests a big move around the corner, the price could go either way once volatility expands.
BCH/BTC: BCH Recovers Above 0.026 BTC Level
Key Support Levels: 0.0275 BTC, 0.0280 BTC
Key Resistance Levels: 0.026 BTC, 0.0246 BTC
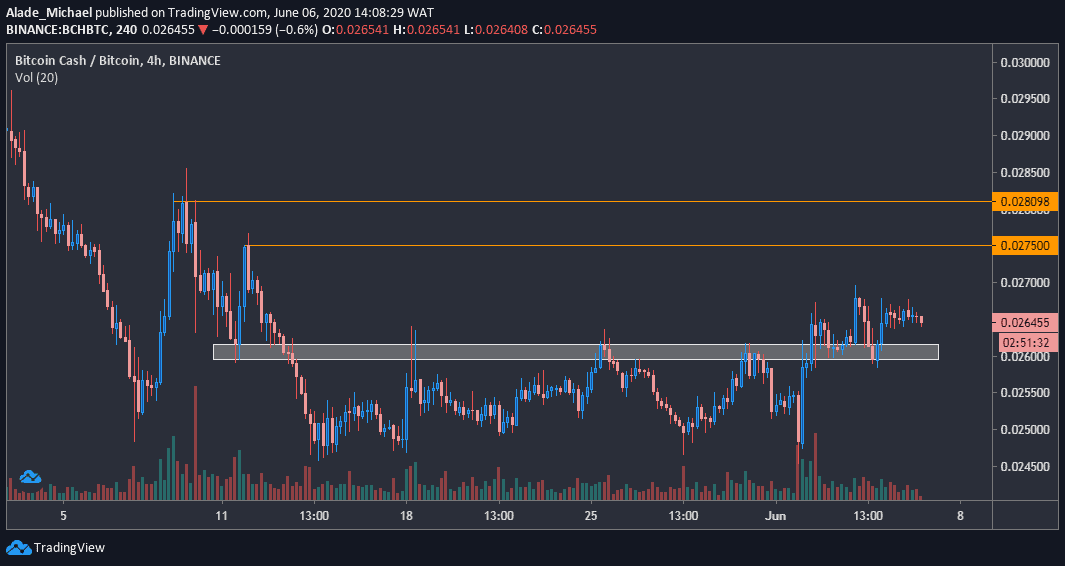
Bitcoin Cash finally retained its price above the grey-marked area of 0.026 BTC following a slight breakup four days ago. After a pullback, the price bounced near 0.027 BTC level before dropping slightly to where it’s currently changing hands at 0.0265 BTC.
The 0.026 BTC level is now acting as a support area on the 4-hours chart, although it would still need to push further to validate a strong bullish trend on a short-term perspective. Meanwhile, the 0.0246 BTC is still holding as base support.
However, the price may remain indecisive if the bulls fail to reiterate actions. While buyers anticipate the next move, the price has increased by 1% over the last trading hour.
Bitcoin Cash Price Analysis
If BCH manages to establish support above the 0.026 BTC, the next price target would be towards the orange horizontal line of 0.0275 BTC, followed by 0.0280 BTC, where the major bullish move is expected to take place on the daily chart.
But if the 0.026 BTC fails to keep acting as support, the price may floor back to the 0.0246 BTC, where this week’s recovery started from. A drop below the level may cause a serious sell action.
As of now, it appeared a reverse pattern is in play. This would be confirmed as soon as the price continues to increase well in the coming days.