After losing over 5% in less than 24 hours, Tezos started to show signs of weakness as sellers resume pressure.XTZ made a quick reversal after finding base support at 26000 SAT.XTZ/USD: Tezos Trying To Recover DropKey Resistance Levels: .89, .07Key Support Levels: .375, .06XTZ/USD. Source: TradingViewTezos lost over 5% to reach .6 over the past hours after getting rejected at the .89 resistance yesterday. Sellers are starting to show interest again, and it may lead to more losses if the pressure continues in the coming days.Looking at the current price action, however, it appears that a double-top pattern is slowly becoming valid on the daily chart. A bearish reversal would confirm this if the price drops below the .3 level.Nevertheless, short-term bullishness can be expected
Topics:
Michael Fasogbon considers the following as important: Price Analysis, Tezos (XTZ) Price, XTZUSD
This could be interesting, too:
CryptoVizArt writes ETH’s Path to K Involves Maintaining This Critical Support (Ethereum Price Analysis)
Duo Nine writes Crypto Price Analysis June-29: ETH, XRP, ADA, DOGE, and DOT
Duo Nine writes Crypto Price Analysis June-15: ETH, XRP, ADA, DOGE, and DOT
Duo Nine writes Why is the Shiba Inu (SHIB) Price Down Today?
- After losing over 5% in less than 24 hours, Tezos started to show signs of weakness as sellers resume pressure.
- XTZ made a quick reversal after finding base support at 26000 SAT.
XTZ/USD: Tezos Trying To Recover Drop
Key Resistance Levels: $2.89, $3.07
Key Support Levels: $2.375, $2.06
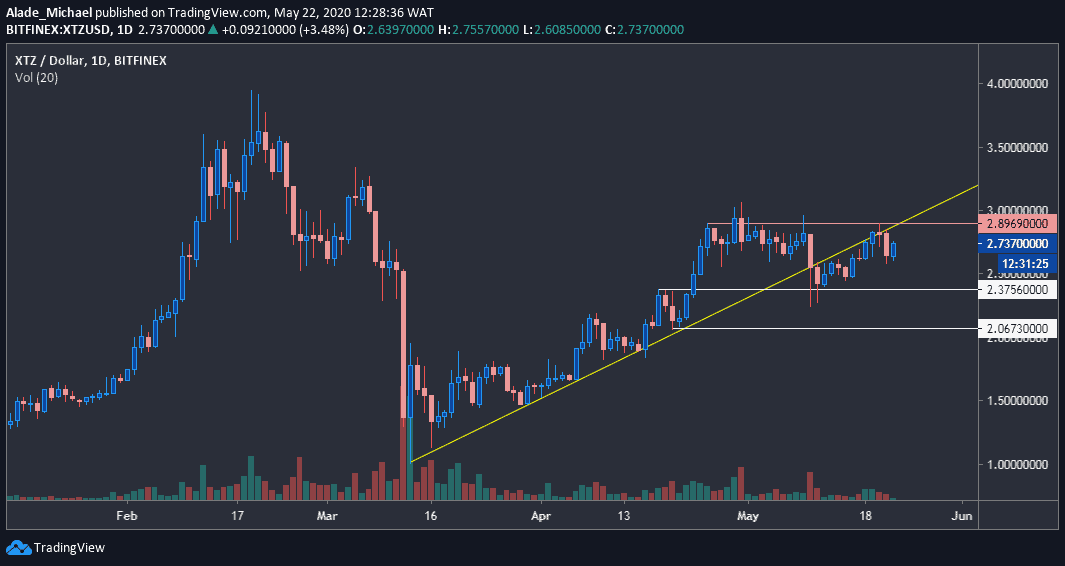
Tezos lost over 5% to reach $2.6 over the past hours after getting rejected at the $2.89 resistance yesterday. Sellers are starting to show interest again, and it may lead to more losses if the pressure continues in the coming days.
Looking at the current price action, however, it appears that a double-top pattern is slowly becoming valid on the daily chart. A bearish reversal would confirm this if the price drops below the $2.3 level.
Nevertheless, short-term bullishness can be expected if Tezos can bounce back. Considering the series of rejections at $3.07, $2.97, and $2.89 (Wednesday’s high), the 10th largest cryptocurrency is more likely to lose momentum soon.
The recent rejection around the yellow ascending trend line is another angle to keep in mind for a potential drop.
Tezos Price Analysis
Tezos is already looking bearish on the lower time frame. The key support to watch out for is the initial white level at $2.375, followed by the second level at $2.06, which is likely to suppress future bearish pressure.
From above, the immediate resistance to keep in mind is the red trend line of $2.89, where the price started to drop from yesterday. A breach above this level would suggest a further increase to the resistance at $3.07, printed on April 30. Tezos could initiate a strong bullish if this level breaks.
XTZ/BTC: Tezos Plotting Next Increase
Key Resistance Levels: 30460 SAT, 32080 SAT
Key Support Levels: 29100 SAT, 27777 SAT
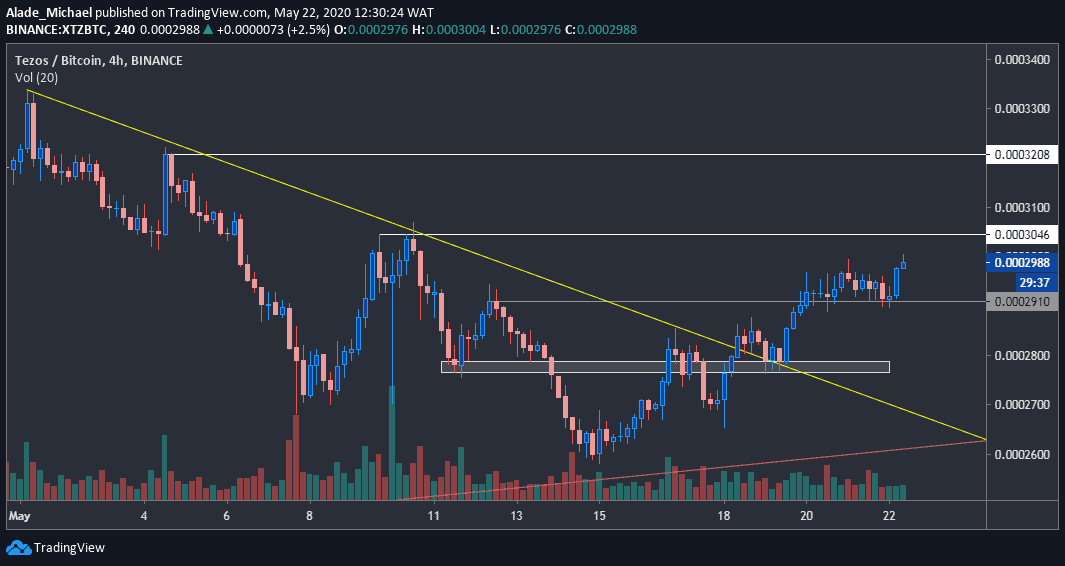
Tezos is currently looking indecisive following a steady recovery from 26000 SAT over the past seven days. This level is now holding as a base support for short-term bulls. With the latest 1.08% increase, XTZ is currently trading around 29880 SAT.
From a technical perspective, the trend is gradually reversing on the 4-hours time frame as buyers regain control of the market. Aside from the rebound at the long-term rising trend line, marked red on the price chart, the break above the yellow trend line is a key confirmation for a short-term increase.
Tezos is now above 29100 SAT, mentioned as a potential resistance in our previous analysis. A continuation of this trend would allow for more bullish actions.
Tezos Price Analysis
In case of a drop beneath the 29100 SAT support, marked grey in the above chart, the next sell action would be targeted at the grey support area at 27777 SAT. Below this, the next levels of demand are 27000 SAT and 26000.
The buying volume is rather low at the time of this writing. As soon as Tezos reclaims the 30000 SAT level (yesterday’s high), it can target 30460 SAT and 32080 SAT, indicated white above.