After a six-day recovery, Cardano resumes selling pressure following a daily 8% price dropAgainst USD, Cardano sharply broke below a weekly triangle pattern, after two days of consolidationAgainst BTC, A breakdown below 530 SAT level could likely send ADA to discover new lowsADA/USD: Triangle Breakdown Followed by Huge SelloffKey Resistance Levels: %excerpt%.0523, %excerpt%.056Key Support Levels: %excerpt%.045, %excerpt%.042A few days ago, Cardano saw a mild recovery of about 9% after a two-week-long correction that led the price to the low of %excerpt%.045 on the first day of March.As a result, Cardano recorded a weekly high of %excerpt%.053, although the price was rejected and consolidated for two days before dropping further yesterday, following Bitcoin’s recent price action.As we can see on the 4-hour chart above, the triangle
Topics:
Michael Fasogbon considers the following as important: Cardano (ADA) Price, Price Analysis
This could be interesting, too:
Jordan Lyanchev writes Cardano (ADA) Surpasses Dogecoin After 55% Surge
Jordan Lyanchev writes Trump Confirms Work on Strategic Crypto Reserve: XRP, ADA, SOL Included
Dimitar Dzhondzhorov writes Millions of ADA Sold by Cardano Whales During Market Crash – Will the Decline Continue?
Jordan Lyanchev writes Here’s How Cardano’s 17% Weekly Correction Can Help ADA Hit This Cycle: Analyst
- After a six-day recovery, Cardano resumes selling pressure following a daily 8% price drop
- Against USD, Cardano sharply broke below a weekly triangle pattern, after two days of consolidation
- Against BTC, A breakdown below 530 SAT level could likely send ADA to discover new lows
ADA/USD: Triangle Breakdown Followed by Huge Selloff
Key Resistance Levels: $0.0523, $0.056
Key Support Levels: $0.045, $0.042
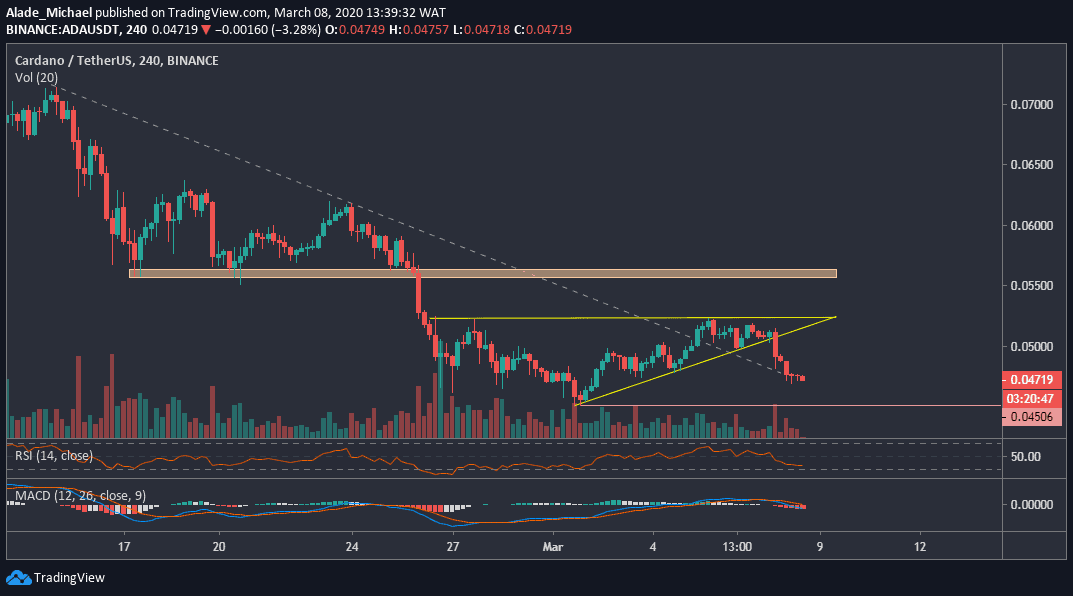
A few days ago, Cardano saw a mild recovery of about 9% after a two-week-long correction that led the price to the low of $0.045 on the first day of March.
As a result, Cardano recorded a weekly high of $0.053, although the price was rejected and consolidated for two days before dropping further yesterday, following Bitcoin’s recent price action.
As we can see on the 4-hour chart above, the triangle breakdown is now setting a new bearish mode for the ADA/USD pair. If the price plunges below the red horizontal supporting line of $0.045, a mid-term bearishness would be confirmed.
Cardano-USD Short Term Price Prediction
Cardano is still looking bearish in the short-term. As of now, the price is approaching significant support at $0.045. If this support level breaks, we can expect Cardano to retest a fresh March low around $0.042.
In case ADA/USD regains momentum back above the mentioned support, the first critical level for buyers is the $0.0523 resistance, where the price started yesterday’s drop. A significant breakup would propel buying to the orange resistance area of $0.056.
The RSI has dropped back below 50 levels to suggest a downtrend. A further dip in the oversold territory could cause severe pain in the market. Conversely, the MACD is showing bearish signs at the moment, nearing a crossover to the negative zone.
ADA/BTC: Price Remains Trapped in A Descending Channel
Key Resistance Levels: 583 SAT, 620 SAT
Key Support Levels: 530 SAT, 500 SAT
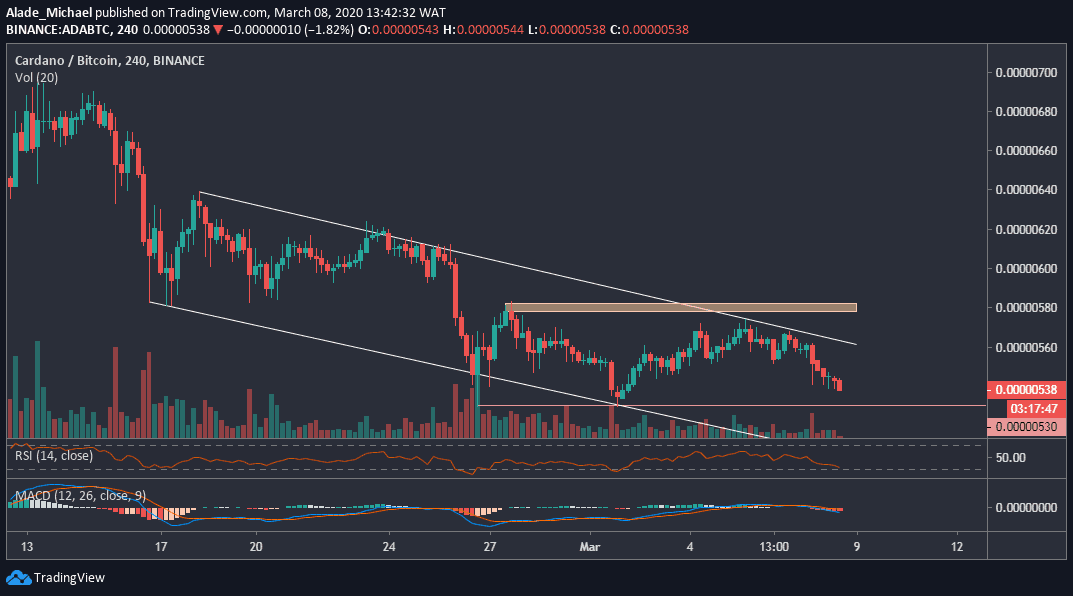
Despite a minor price increase over the past six days, Cardano continued to decline inside a channel boundary that was forming for the past weeks.
At the moment, Cardano appeared to be resuming the downtrend after meeting another rejection around the 580 SAT level, at the channel’s upper boundary on Thursday.
However, the price would need to drop below the critical level of 530 SAT before we can confirm a short-term bearish continuation. As it stands now, the setup looks more of a bearish than bullish.
Cardano-BTC Short Term Price Prediction
As mentioned before, if the bulls lose their last defense line of 530 SAT support, Cardano may establish a new lower low around the 500 SAT level.
From above, Cardano would need to reclaim the 583 SAT resistance – the first orange box on the 4-hour chart. A successful break above this resistance would allow more gains to 620 SAT resistance and above.
As we can see on the price chart, Cardano is maintaining a downward range on both the RSI and MACD. We can expect the market to remain bearish if these technical indicators continue to drop.