Despite losing 4% today, Cardano is showing a lot of strength against the Bitcoin.The price is still in favor of the bulls on a short-term perspective.Bears may take over the market if the price drops below the diagonal support on the 4-hours chart.ADA/USD: Cardano Holds Above %excerpt%.05 SupportKey Resistance Levels: %excerpt%.0577, %excerpt%.06, %excerpt%.065Key Support Levels: %excerpt%.047, %excerpt%.041, %excerpt%.0372ADA/USD. Source: TradingViewCardano lost 4% over the past hours following a 7-days capitulation to reach %excerpt%.05 yesterday. A sharp rejection at this price level brought a slight pull at %excerpt%.0526 at the time of writing. While the bears’ commitment is still weak, there’s a high probability of a bullish continuation.ADA is likely to remain bullish if the white rising trend line continues to provide support for the market.
Topics:
Michael Fasogbon considers the following as important: ADABTC, ADAUSD, Cardano (ADA) Price, Price Analysis
This could be interesting, too:
Jordan Lyanchev writes Cardano (ADA) Surpasses Dogecoin After 55% Surge
Jordan Lyanchev writes Trump Confirms Work on Strategic Crypto Reserve: XRP, ADA, SOL Included
Dimitar Dzhondzhorov writes Millions of ADA Sold by Cardano Whales During Market Crash – Will the Decline Continue?
Jordan Lyanchev writes Here’s How Cardano’s 17% Weekly Correction Can Help ADA Hit This Cycle: Analyst
- Despite losing 4% today, Cardano is showing a lot of strength against the Bitcoin.
- The price is still in favor of the bulls on a short-term perspective.
- Bears may take over the market if the price drops below the diagonal support on the 4-hours chart.
ADA/USD: Cardano Holds Above $0.05 Support
Key Resistance Levels: $0.0577, $0.06, $0.065
Key Support Levels: $0.047, $0.041, $0.0372

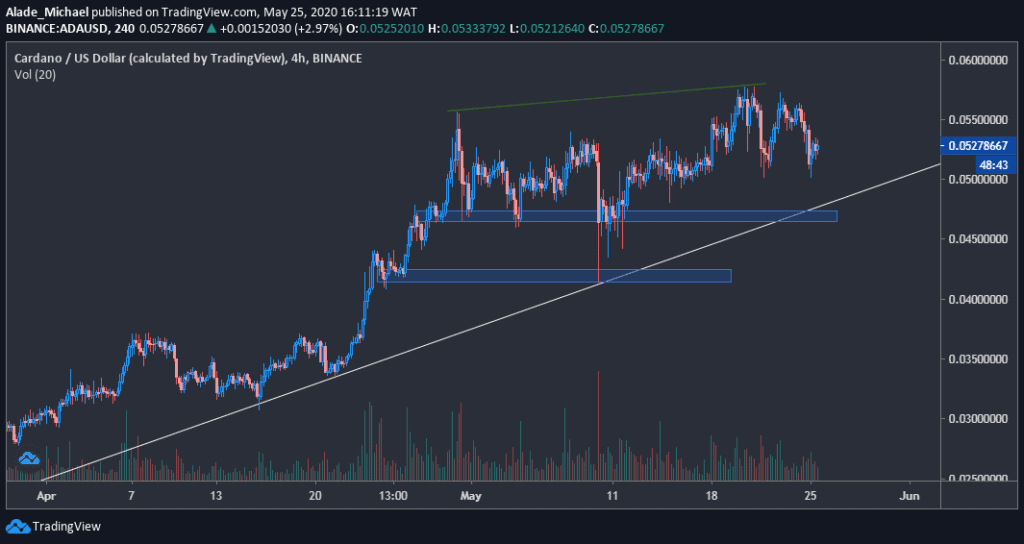
Cardano lost 4% over the past hours following a 7-days capitulation to reach $0.05 yesterday. A sharp rejection at this price level brought a slight pull at $0.0526 at the time of writing. While the bears’ commitment is still weak, there’s a high probability of a bullish continuation.
ADA is likely to remain bullish if the white rising trend line continues to provide support for the market. Inversely, a healthy correction can be expected if the price collapse beneath this trend line.
A breakdown would validate a reversal to the $0.04 – $0.035 price area. The trading volume on the 4-hours chart is slowly fading as well, suggesting a possible drop in price. Considering the price actions for the past week now, ADA is technically weak against the US Dollar.
Cardano Price Analysis
If Cardano is able to regain strength, it would need to clear the previous resistance of $0.0577 before confirming a strong buying pressure to the $0.06 and $0.065 resistance areas in the future.
The key spot to watch as support is the immediate blue area of $0.047 in case of a bearish extension. The next support is located in the second blue area of $0.041, below the two-month trend line.
However, it’s important to pay attention to a potential double-top play, which is marked from previous highs of $0.050 (in late April) and the recent $0.0577 level.
ADA/BTC: Cardano Continues To Gain Momentum
Key Resistance Levels: 620 SAT, 639 SAT, 650 SAT
Key Support Levels: 581 SAT, 554 SAT, 520 SAT

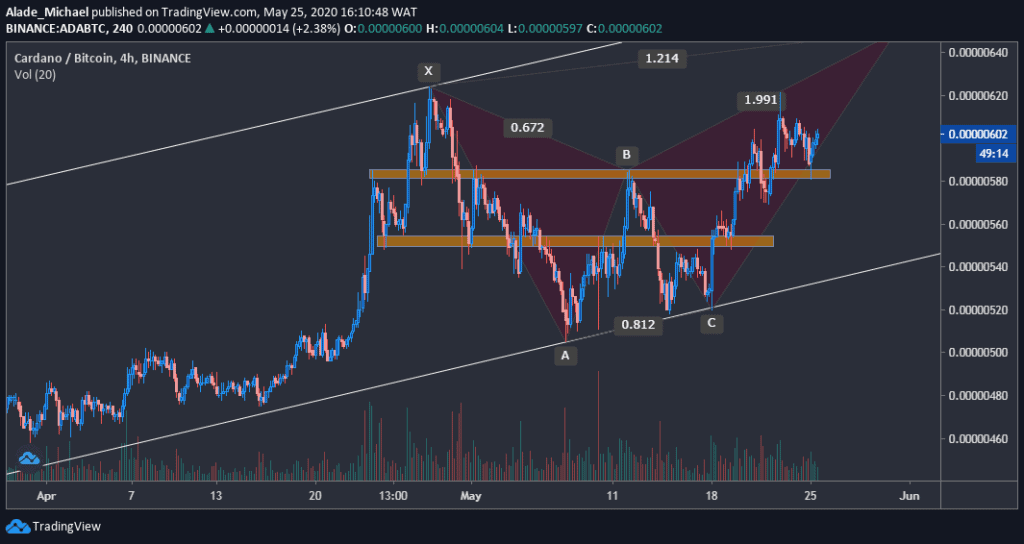
Against Bitcoin, Cardano found support above 500 SAT level and started to gain momentum after a two-week drop from around 620 SAT late last month. This price dropped to 581 SAT earlier today, but the bulls have managed to push it back slightly above the 600 SAT level at the moment.
Meanwhile, Cardano is almost completing the D point of the bullish butterfly pattern forming on the 4-hours time frame. However, this bullish action was initiated by a double-bottom pattern from the 520 SAT level.
Before one can consider a strong bearish trend for this cryptocurrency, the price would need to fall below the rising channel, which has been forming since mid-March. But as it appeared now, there’s no decisive bearish action to override the ongoing uptrend.
Cardano Price Analysis
Once the bulls can push the price above the current monthly high – 620 SAT, the 639 SAT, and 650 SAT levels would be the next bullish target, around the upper boundary of the two-month rising channel.
The 581 SAT area is currently acting as daily support for Cardano. A drop beneath it could trigger a sell action to 554 SAT area, marked orange. The next support is 520 SAT (right below the channel), which is where ADA regained momentum on May 18.
