Chainlink surged 13.48% to reach .26 as buyers remain trapped in a channel.If buying volume continues to increase, the bullish scenario might last for a while.Against Bitcoin, Link signals long-term bullish move after witnessing a bull flag breakout.LINK/USD: Chainlink Awaiting Next Move Following 13.48% SurgeKey Resistance Levels: .75, .55Key Support Levels: .73, .13LINK/USDT. Source: TradingViewToday, we have seen another surge in the price of Chainlink against the US Dollar, rising by 13.48% over the last 24-hours. This sudden price increase has made Link to trade around .26 at the time of this writing. The instant growth is now causing a lot of bullish sentiment in the market.With .14 billion market cap, Chainlink is now ranked the 16th largest cryptocurrency, although
Topics:
Michael Fasogbon considers the following as important: Chainlink, Price Analysis
This could be interesting, too:
Bitcoin Schweiz News writes Chainlink: Das unsichtbare Rückgrat von DeFi, GameFi, AI und NFTs
Dimitar Dzhondzhorov writes These Are the Top 10 Cryptocurrencies by ‘Notable Development Activity’ (Santiment)
Bitcoin Schweiz News writes Chainlink gibt Kooperation mit UBS AG und Vontobel Bank bekannt
Martin Young writes Chainlink Partners With Major Finance Firms on AI, Oracles, and Blockchain Data Solution Project
- Chainlink surged 13.48% to reach $3.26 as buyers remain trapped in a channel.
- If buying volume continues to increase, the bullish scenario might last for a while.
- Against Bitcoin, Link signals long-term bullish move after witnessing a bull flag breakout.
LINK/USD: Chainlink Awaiting Next Move Following 13.48% Surge
Key Resistance Levels: $3.75, $4.55
Key Support Levels: $2.73, $2.13
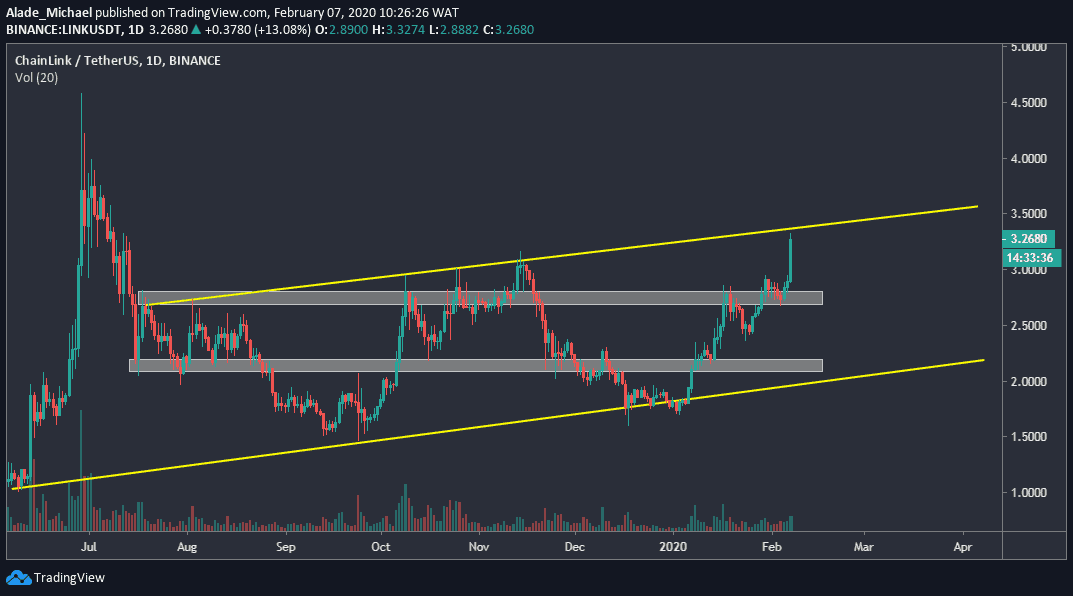
Today, we have seen another surge in the price of Chainlink against the US Dollar, rising by 13.48% over the last 24-hours. This sudden price increase has made Link to trade around $3.26 at the time of this writing. The instant growth is now causing a lot of bullish sentiment in the market.
With $1.14 billion market cap, Chainlink is now ranked the 16th largest cryptocurrency, although trading volume is still under $300 million. Considering the ongoing sentiment in this market, the LINK/USD pair is technically bullish on the daily chart.
Following the mid-2019 drops from $4.55, Link’s bull has managed to regroup the price back in a rising channel, as spotted on the price chart. Now that the buying pressure has reached the channel’s resistance, we may need to consider a possible bearish swing. On the other hand, a breakout is most likely to set a new bullish mode for Link.
Chainlink Price Analysis
After losing 65% in mid-2019, Link found support at $1.5 in September and started a steady swing in a rising channel. This bullish pattern has led Chainlink to an important area on the channel, which suggests that we may see a price discount sooner than later.
However, Link is currently bullish but it appeared that the five weeks upward move may come to an end soon. In this case, we may see price falling at $2.73 and $2.13, into the grey support area. Meanwhile, there’s close support at $3.
If Link fails to correct at the channel’s lower boundary and finds support at $3, the next thing to watch out for is a breakout as $3.75 and $4.55 resistance could be the next bullish target. As it stands now, Chainlink is still trapped in a six-month channel.
LINK/BTC: Bull Flag Breakout Sets Continuation For Link Against Bitcoin
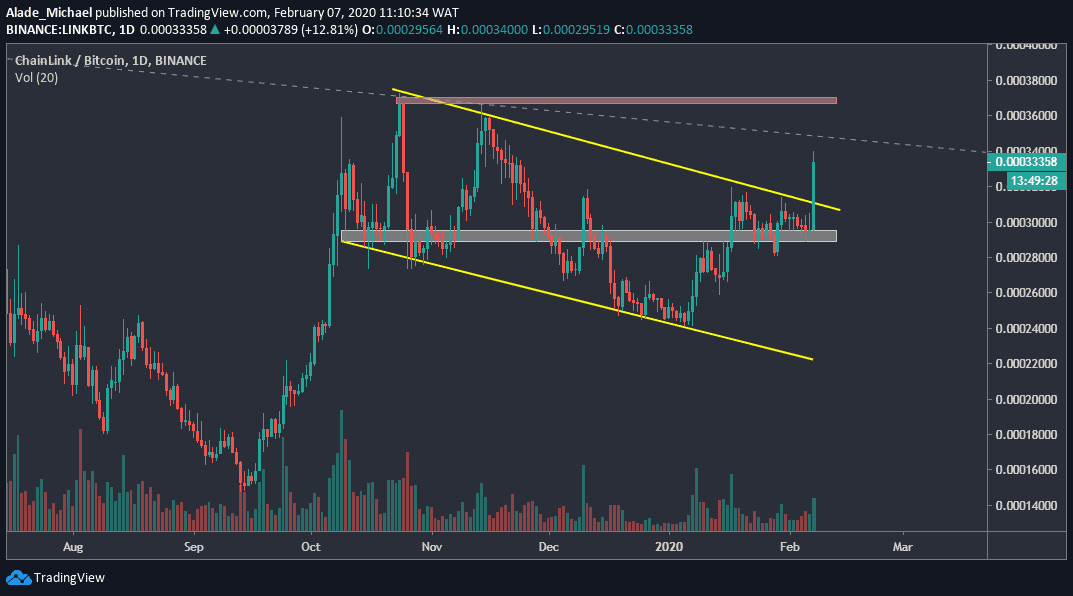
Just few hours ago, Link saw a sharp surge of about 11.78% against Bitcoin. The sudden price movement has made Chainlink to trade currently at 33200SAT level at the time of writing. After witnessing days of correction, we should expect this surge to trigger a massive buying pressure in the market
Looking at the latest positive move on the daily chart, Chainlink is expected to follow a lot of bullish sentiment in the next few days, especially if we consider the current breakout on the three-month descending channel. This suggests a continuation of upward trend, characterized with a bull flag pattern.
Link is now facing a long-term resistance line that was drawn from the 2019 high of 39500SAT level. Once the price breaches this white-dotted line, Link would reclaim the 3-month resistance of 37277SAT level. As of now, bulls are showing commitment to trading.
Chainlink Price Analysis
The latest price surge has confirmed a continuation of the bull flag pattern that was formed over the past months. At the moment, Link is targeting the red resistance area of 37200SAT level on the daily price chart, but the white-dotted descending line may pose a small threat to buyers.
If the buyers can overcome this line and further reclaim the October 2019 high, the next level of resistance to look out for is 39500SAT – the 2019 peak. A climb above this level could set a fresh all-time-high for Chainlink. Meanwhile, the market has now found support at the grey horizontal area of 29000SAT.
In case of a pullback, we can expect Link to locate near support at around 31000SAT level before bouncing off the channel. If the price drops below the 30000SAT level, Link is likely to trade back in the channel. But as it appeared now, bullish momentum is just about to start.