EthereumETH/USD. Source: TradingViewLast weekend, Ethereum recovered a bit to 0 following a sudden 55% price drop to a weekly low of . After a short daily increase, Ethereum’s price dropped to 0 (March 12 low), which reveals that sellers are showing interest again. More so, we can see that ETH is still struggling inside the 7-month descending channel.If the price drops below the psychological level of 0, Ethereum could slip back to (last week’s low). Beneath this level lies a long-term support line of (the 2018 low), marked white on the daily chart. On the other hand, if the buyers turn up, Ethereum could bounce again to 0 and perhaps to the resistance at 0 before considering a break-up.ETH/BTC. Source: TradingVIewAfter pulling back to the wedge’s support (0.024
Topics:
Michael Fasogbon considers the following as important: Price Analysis
This could be interesting, too:
CryptoVizArt writes ETH’s Path to K Involves Maintaining This Critical Support (Ethereum Price Analysis)
Duo Nine writes Crypto Price Analysis June-29: ETH, XRP, ADA, DOGE, and DOT
Duo Nine writes Crypto Price Analysis June-15: ETH, XRP, ADA, DOGE, and DOT
Duo Nine writes Why is the Shiba Inu (SHIB) Price Down Today?
Ethereum
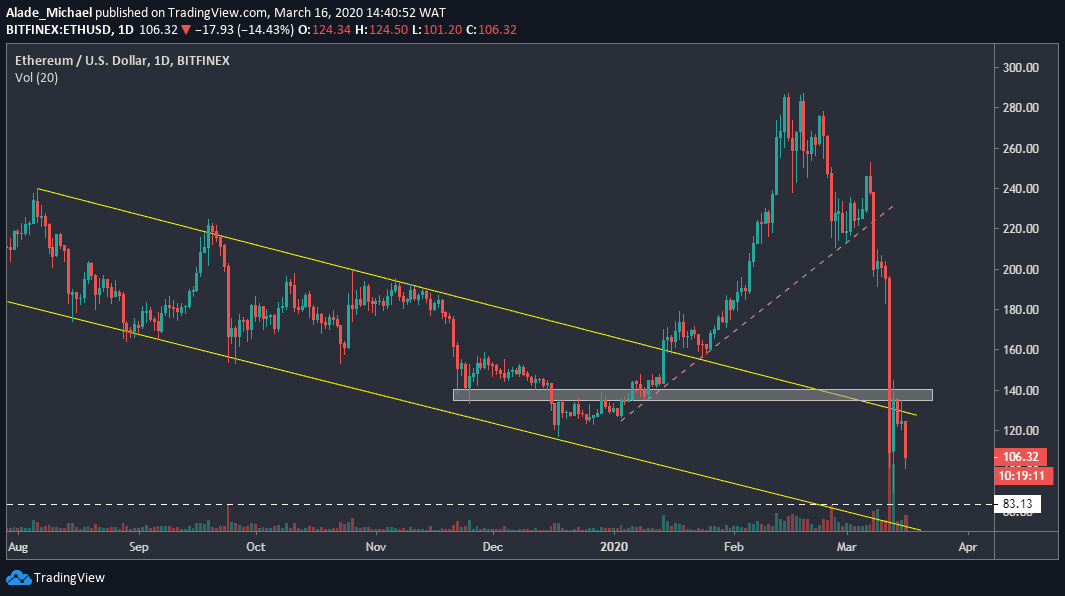
Last weekend, Ethereum recovered a bit to $140 following a sudden 55% price drop to a weekly low of $86. After a short daily increase, Ethereum’s price dropped to $100 (March 12 low), which reveals that sellers are showing interest again. More so, we can see that ETH is still struggling inside the 7-month descending channel.
If the price drops below the psychological level of $100, Ethereum could slip back to $86 (last week’s low). Beneath this level lies a long-term support line of $83 (the 2018 low), marked white on the daily chart. On the other hand, if the buyers turn up, Ethereum could bounce again to $120 and perhaps to the resistance at $140 before considering a break-up.

After pulling back to the wedge’s support (0.024 BTC), ETH dropped, and it’s currently testing support at the 0.022 BTC level, which is marked blue on the 4-hours chart. Though, the price is facing multiple rejections at this support.
Meanwhile, the price action is supported by a mid-term trend line (white). If Ethereum can bounce off this controversial support area, we can expect a double-bottom pattern to kick bullish formation towards 0.024 BTC resistance and 0.026 BTC in the coming days. If Ethereum breaks below the 0.022 BTC support, the next level to watch is 0.021 BTC and 0.020 BTC.
Ripple
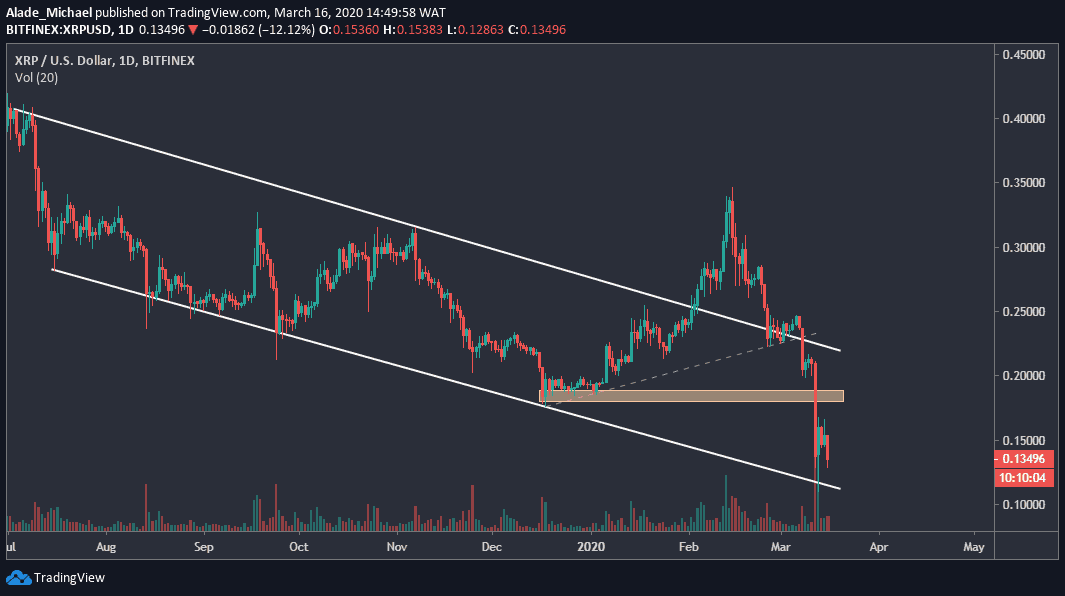
Along with Bitcoin and Ethereum, Ripple has continued to lose momentum over the past hours. As of the time of this writing, XRP is down by 10.24%, causing the third-largest cryptocurrency to trade around $0.135 against the US Dollar. Due to these drops, the bears are starting to gain control of the market after a three-day consolidation.
We can see that Ripple is targeting the lower boundary of the channel, around $0.11 level. A rebound is likely if this level holds. As such, resistance to watch above is $0.15 and $0.185 in the orange area on the chart. If the price drops beneath $0.11, however, support may come around $0.10 and $0.08.
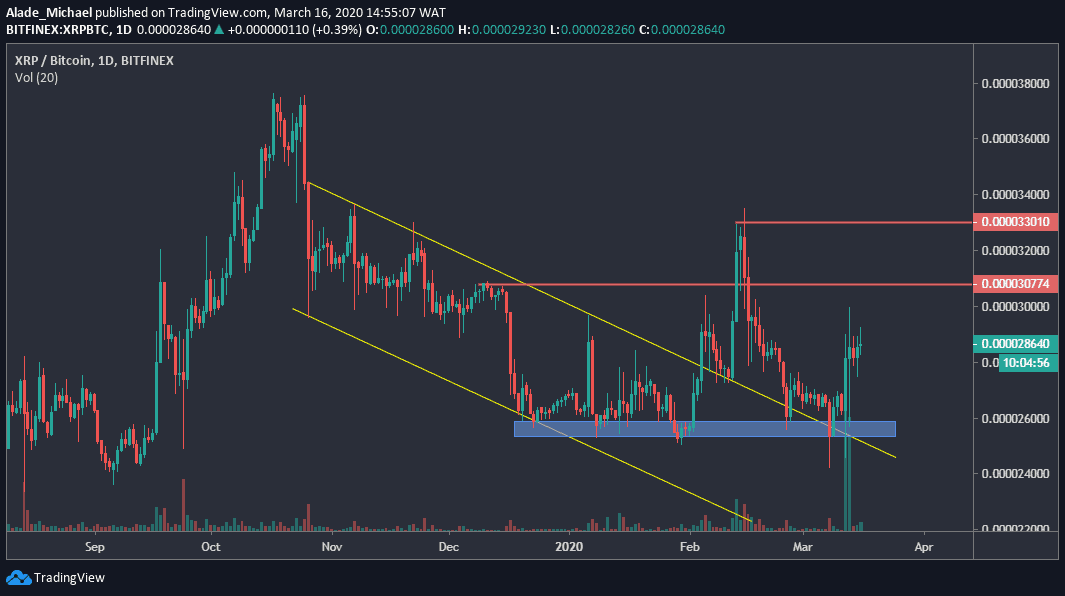
Against Bitcoin, Ripple continued to show strength after gaining support at the 2600 SAT level on March 9. At the moment, the bullish action is calm around 2864 SAT. Notwithstanding, the buyers need to clear the 3300 SAT (the first red resistance level) before we can confirm a strong bullish trend.
In case we see a nice push above the mentioned resistance, Ripple would target the second red level (3300 SAT resistance). On the other hand, if the price drops significantly below 2800 SAT, the primary level to watch is the two-month support of 2600 SAT, marked blue on the daily chart.
Tezos
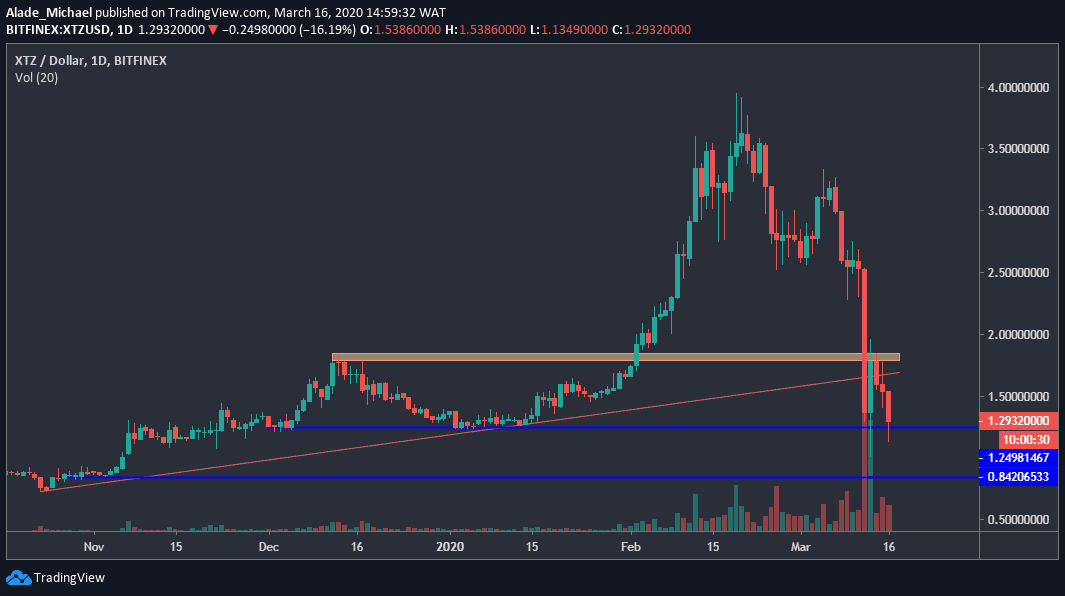
Last week, Tezos broke a lot of supports following a massive dump from $2.5. This negative move brought Tezos’s price to as low as $1 in the mid-week but managed to recover slightly to $1.8, where buyers fought resistance for days. After failing to break above the $1.8 resistance (the orange area), Tezos continued to fall and found daily support around $1.25 after touching $1.1
The price is currently hovering around $1.29 against the US Dollar. If the price drops below the first blue level ($1.25), we can expect the next selling target at the second blue level ($0.84). On the upside, the $1.8 resistance remains a crucial level for buyers. The next above this is $2.5.
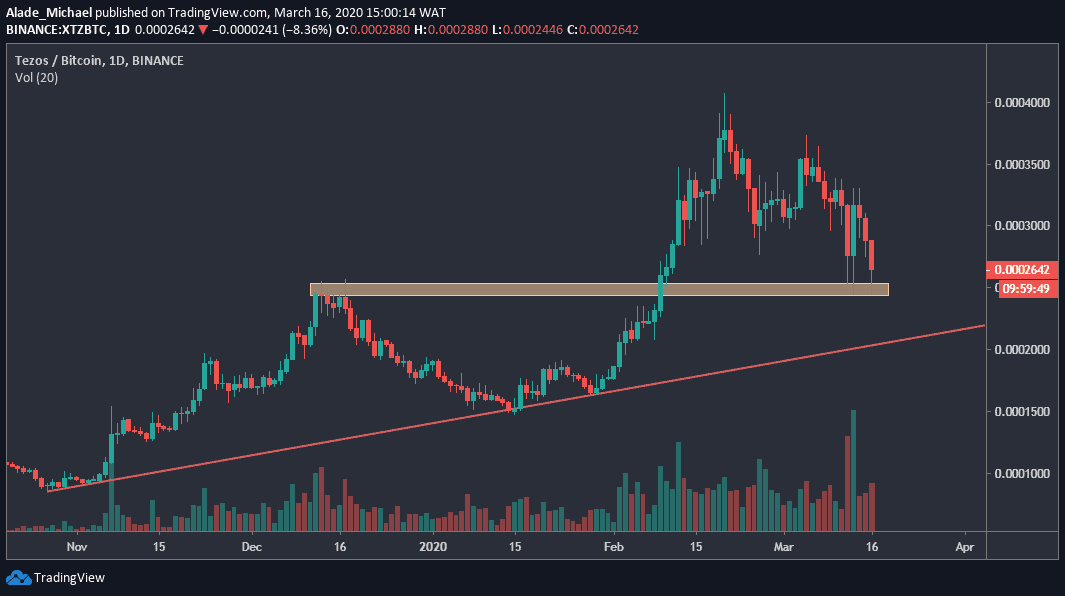
Against Bitcoin, Tezos is positioned in a downward spiral, but the price has continued to face support around 2500 SAT for a while now. Looking at the current formation, it appears that the bearish price action has not finished yet. However, Tezos is trading around 2642 SAT at the time of writing.
If Tezos dips below the orange support area, the immediate support to keep in mind is the 2000 SAT level, which is around the red rising trend line. Below this level is 1500 SAT support. Inversely, if Tezos can stay above this orange support area of 2500 SAT, we can expect positive actions to 3000 SAT, 3500 SAT, and 4000 SAT.