Ethereum continued to trade in a range between 0 and 0.Against Bitcoin, the price may dip lower if the 0.021 BTC support fails to provide a rebound.The trend remains in a downward range on the 4-hours chart.ETH/USD: Ethereum Pushes Toward 0Key Resistance Levels: 0, 5, 6Key Support Levels: 5, 6, 2.6, 1ETH/USD. Source: TradingViewThe recent crash in Bitcoin’s price from 000 to 50 pulled major altcoins in a downward spiral, including Ethereum, which is now trading below 0 key level since last weekend.Ethereum’s correction is still mild despite breaking down from an ascending trend line, forming since March 12. However, it might get severe if the price drops significantly beneath 5, which is now acting as temporary weekly support.Bulls are attempting
Topics:
Michael Fasogbon considers the following as important: ETH Analysis, ETHBTC, Ethereum (ETH) Price, ethusd
This could be interesting, too:
Mandy Williams writes Ethereum Derivatives Metrics Signal Modest Downside Tail Risk Ahead: Nansen
Jordan Lyanchev writes Weekly Bitcoin, Ethereum ETF Recap: Light at the End of the Tunnel for BTC
CryptoVizArt writes Will Weak Momentum Drive ETH to .5K? (Ethereum Price Analysis)
Jordan Lyanchev writes Bybit Hack Fallout: Arthur Hayes, Samson Mow Push for Ethereum Rollback
- Ethereum continued to trade in a range between $190 and $200.
- Against Bitcoin, the price may dip lower if the 0.021 BTC support fails to provide a rebound.
- The trend remains in a downward range on the 4-hours chart.
ETH/USD: Ethereum Pushes Toward $200
Key Resistance Levels: $200, $215, $226
Key Support Levels: $175, $166, $152.6, $141
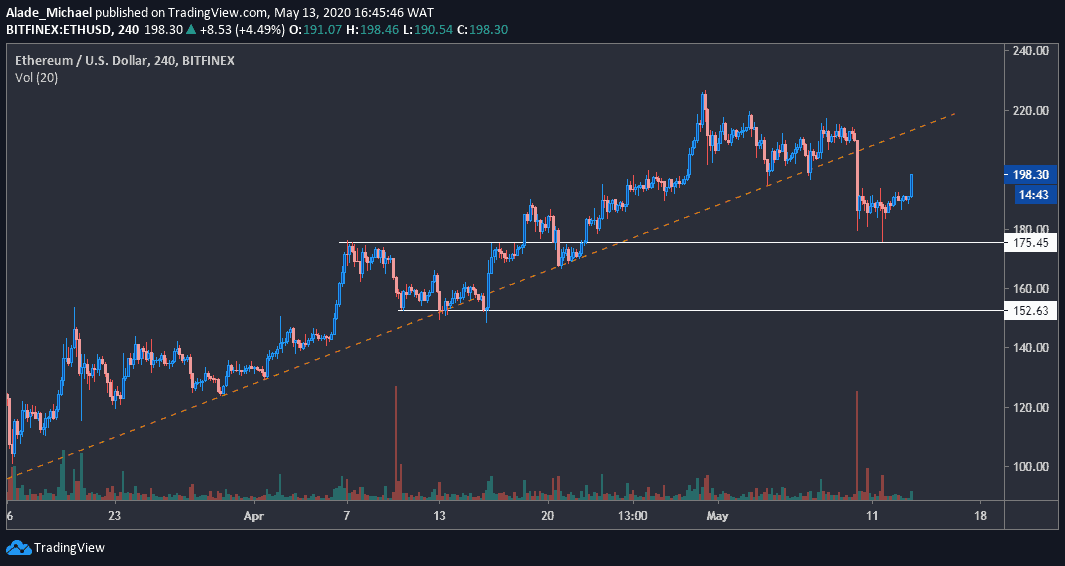
The recent crash in Bitcoin’s price from $10000 to $8150 pulled major altcoins in a downward spiral, including Ethereum, which is now trading below $200 key level since last weekend.
Ethereum’s correction is still mild despite breaking down from an ascending trend line, forming since March 12. However, it might get severe if the price drops significantly beneath $175, which is now acting as temporary weekly support.
Bulls are attempting to push the price back, and they are now against a serious resistance at $200.
Ethereum Price Analysis
The next levels of resistance to look for, assuming $200 is breached, lie at $215 and $226.
Should the price continue to move sideways for the next couple of days, Ethereum might roll back to the $175 support, where the price rebounded on Monday. Failure to hold above this support could trigger more losses to $166 and $152, indicated white on the 4-hours chart.
ETH/BTC: Ethereum May Resumes Selling If Rebound Fails
Key Resistance Levels: 0.022 BTC, 0.023 BTC, 0.024 BTC
Key Support Levels: 0.021 BTC, 0.0205 BTC, 0.020 BTC
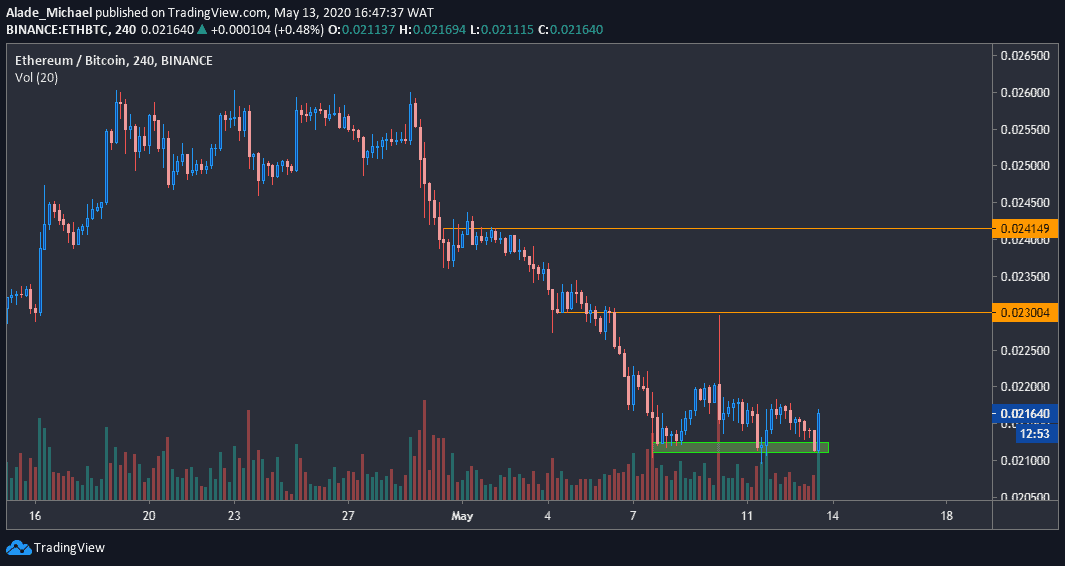
Ethereum failed to regain momentum after attempting to conquer the 0.022 BTC resistance level over the weekend. But, the price plunged back below this mentioned resistance following a long rejection from 0.023 BTC level
Over the past few days now, Ethereum has remained in a consolidation cycle after witnessing a two weeks plunge from the 0.026 BTC resistance level in April. It’s changing hands around 0.0216 BTC level against Bitcoin following a 1% increase over the last 24-hours.
Similarly, the price is facing a key demand area of 0.021 BTC level with a potential break or bounce though the trading volume is quite low at the moment.
Ethereum Price Analysis
The price is likely to increase if the current 0.021 BTC demand level holds. In this case, resistance to keep an eye on is the 0.022 BTC level, followed by 0.023 BTC. The next resistance target is 0.024 BTC, marked orange on the 4-hours chart.
A breakdown from this area could initiate a fresh sell action straight to 0.0205 BTC and 0.020 BTC levels in no time.
Regardless of the above, the price remains under a bearish control as sellers have upper hand to resume pressure in the market.