Tezos remains the 10th largest cryptocurrency by market cap following its rally during the last few weeks.Triangle breakout signals a recent price increase for Tezos across trading pairs.Technical MACD is bullish as XTZ reclaims important resistances on the way up.XTZ/USD: Tezos Set For New Rally After Breaking Monthly HighKey Resistance Levels: , .2, .5Key Support Levels: .4, , .7XTZ/USD. Source: TradingViewTezos is on the move again. After losing 10% during a three days correction, XTZ resumes buying pressure with a 15% increase overnight. Apart from the recent price drops, Tezos has continued to show strength to reiterate the positive move that started a few weeks back.Tezos just broke out of an ascending triangle after creating support at and .7- circled white on the
Topics:
Michael Fasogbon considers the following as important: Price Analysis, Tezos (XTZ) Price
This could be interesting, too:
CryptoVizArt writes ETH’s Path to K Involves Maintaining This Critical Support (Ethereum Price Analysis)
Duo Nine writes Crypto Price Analysis June-29: ETH, XRP, ADA, DOGE, and DOT
Duo Nine writes Crypto Price Analysis June-15: ETH, XRP, ADA, DOGE, and DOT
Duo Nine writes Why is the Shiba Inu (SHIB) Price Down Today?
- Tezos remains the 10th largest cryptocurrency by market cap following its rally during the last few weeks.
- Triangle breakout signals a recent price increase for Tezos across trading pairs.
- Technical MACD is bullish as XTZ reclaims important resistances on the way up.
XTZ/USD: Tezos Set For New Rally After Breaking Monthly High
Key Resistance Levels: $4, $4.2, $4.5
Key Support Levels: $3.4, $3, $2.7

Tezos is on the move again. After losing 10% during a three days correction, XTZ resumes buying pressure with a 15% increase overnight. Apart from the recent price drops, Tezos has continued to show strength to reiterate the positive move that started a few weeks back.
Tezos just broke out of an ascending triangle after creating support at $2 and $2.7- circled white on the 4-hours chart. Meanwhile, the last 24-hours bullish rally was majorly pinned on $3, which is slightly below the triangle’s resistance-turned-support.
In the meantime, the XTZ price is expected to hit $4 if volatility continues to increase. More so, a considerable buying volume is also essential to keep the price up. The exciting thing is that Tezos has remained the 10th largest cryptocurrency for days with a current market cap of $2.59 billion.
Tezos Short-Term Price Analysis
The current triangle breakout is an indication for a new increase, which could catapult Tezos price at $4.2 and $4.5 in the next couple of days. For now, the buyers are eyeing $4 resistance level. This surge has allowed the buyers to reclaim $3.4 – the monthly high.
In case of a price drop, the monthly high is likely to act as a minor support for this market. If the support fails, a fake move could send Tezos back to $3 and $2.7 support.
If we look at the technical indicators, Tezos is just fueling a bullish momentum on the MACD. Although, Tezos is now facing the RSI 70 level. If the RSI level breaks, we can expect a strong bullish rally. If RSI falls, the price is likely to follow the course.
XTZ/BTC: XTZ Bulls Target 50000SAT Level For Next Bullish Run
Key Resistance Levels: 40000SAT, 45000SAT
Key Support Levels: 30000SAT, 21000SAT
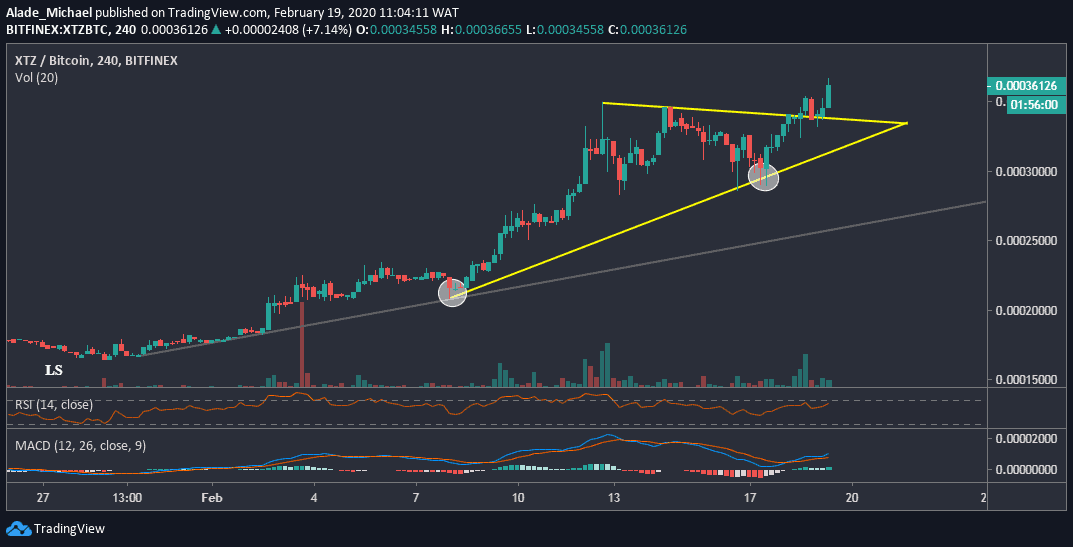
Tezos has seen a sizeable gain against Bitcoin after experiencing a lot of trading volume over the past few hours. In the same way, Tezos is now charging towards a critical resistance level of 40000SAT, following a mild triangle breakout.
This breakout has caused XTZ to now trade at around 36100SAT level with a 10% increase over the last 24-hours. The price range for this triangle breakout is 50000SAT resistance level, but the buyers are still deciding on a significant move.
However, the three weeks market sentiment was pinned on the white circle area of 30000SAT and 21000SAT support levels on the 4-hours chart. If XTZ continues to climb, the triangle’s resistance will become strong support.
Tezos Short-Term Price Analysis
Tezos is technically forming a new bullish pattern. This time, the price is gearing for a short-term resistance around 400000SAT level. If Tezos manages to close above this mentioned resistance today, the next level to watch out for is 45000SAT resistance level.
An opposite move could flush gains out of the market to trap XTZ back in the triangle boundary. There’s a support at 30000SAT level, slightly below the triangle. If Tezos drops, the grey rising line may provide support. The support below this line is the 21000SAT level.
As suggested on the technical indicators, Tezos is revealed in an upward range. This shows that more bullish momentum is expected to come into play soon.