Tezos is likely to correct downward to .6 if the price plunges below a five weeks wedge. Against Bitcoin, XTZ established resistance around 32840 SAT after gaining 27% in two weeks. Nonetheless, Tezos is still looking bullish across trading pairs despite the recent drops. XTZ/USD: Tezos Looking Bullish But Breakout Is Imminent Key Resistance Levels: .36, .5 Key Support Levels: .85, .6 XTZ/USD. Source: TradingViewTezos lost 7% overnight following the latest fall in Bitcoin’s price from 00 to 00. This drop might have something to do with the crisis in the crude oil market. Last month, Tezos recovered with a higher high and a higher low pattern to reach .37 on April 19, completing an Elliot impulsive wave (12345). It’s also important to consider the five weeks ascending
Topics:
Michael Fasogbon considers the following as important: Price Analysis, Tezos (XTZ) Price, XTZBTC, XTZUSD
This could be interesting, too:
CryptoVizArt writes ETH’s Path to K Involves Maintaining This Critical Support (Ethereum Price Analysis)
Duo Nine writes Crypto Price Analysis June-29: ETH, XRP, ADA, DOGE, and DOT
Duo Nine writes Crypto Price Analysis June-15: ETH, XRP, ADA, DOGE, and DOT
Duo Nine writes Why is the Shiba Inu (SHIB) Price Down Today?
- Tezos is likely to correct downward to $1.6 if the price plunges below a five weeks wedge.
- Against Bitcoin, XTZ established resistance around 32840 SAT after gaining 27% in two weeks.
- Nonetheless, Tezos is still looking bullish across trading pairs despite the recent drops.
XTZ/USD: Tezos Looking Bullish But Breakout Is Imminent
Key Resistance Levels: $2.36, $2.5
Key Support Levels: $1.85, $1.6
Tezos lost 7% overnight following the latest fall in Bitcoin’s price from $7200 to $6800. This drop might have something to do with the crisis in the crude oil market.
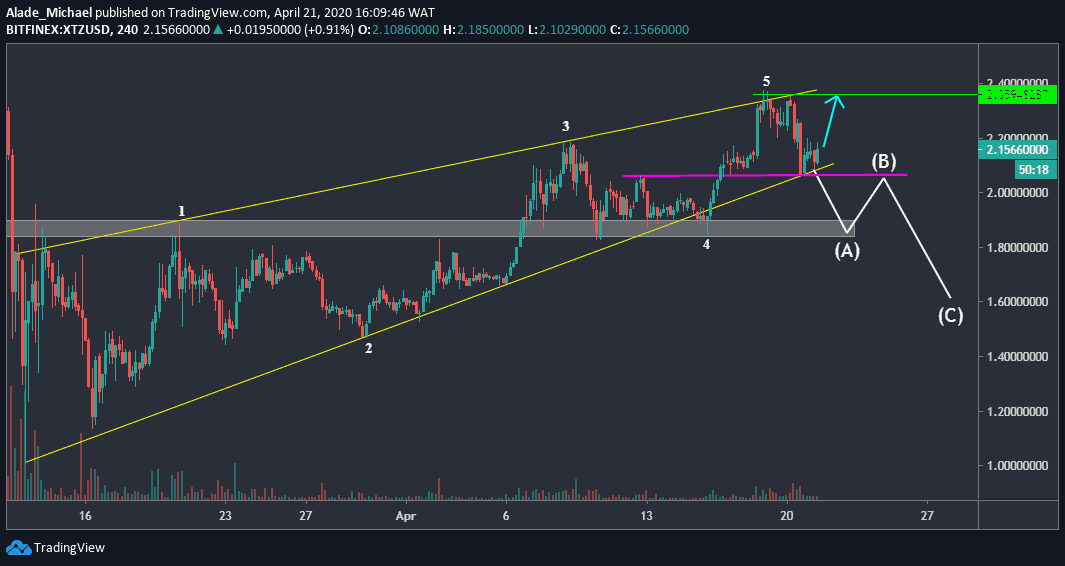
Last month, Tezos recovered with a higher high and a higher low pattern to reach $2.37 on April 19, completing an Elliot impulsive wave (12345).
It’s also important to consider the five weeks ascending wedge for a potential change in trend. As can be seen on the 4-hours chart, Tezos’s volatility has reached a tight area on the wedge to indicate that a huge move is likely in play.
Tezos could follow an Elliot correction wave (ABC) if the price drops beneath the wedge’s support, as presented in the above chart.
However, XTZ’s short-term bullish trajectory is still valid as it currently trades around $2.14 against the US Dollar. The bears are also leaving footprints in the market.
Tezos Price Analysis
Considering the current price setups, a continuation of this bullish trend is quite shaky and uncertain at the moment. However, a bounce at the wedge’s support could trigger a push to $2.36 resistance and perhaps to around $2.5 on the upside.
But if the price drops below this wedge, along with the pink line, Tezos would correct downward to $1.85 support in the grey zone. After a pullback, the next support to watch is $1.6.
XTZ/BTC: Tezos Consolidates Above 30000 SAT Level
Key Resistance Levels: 32840 SAT, 34720 SAT, 40000 SAT
Key Support Levels: 30000 SAT, 27000 SAT, 25000 SAT
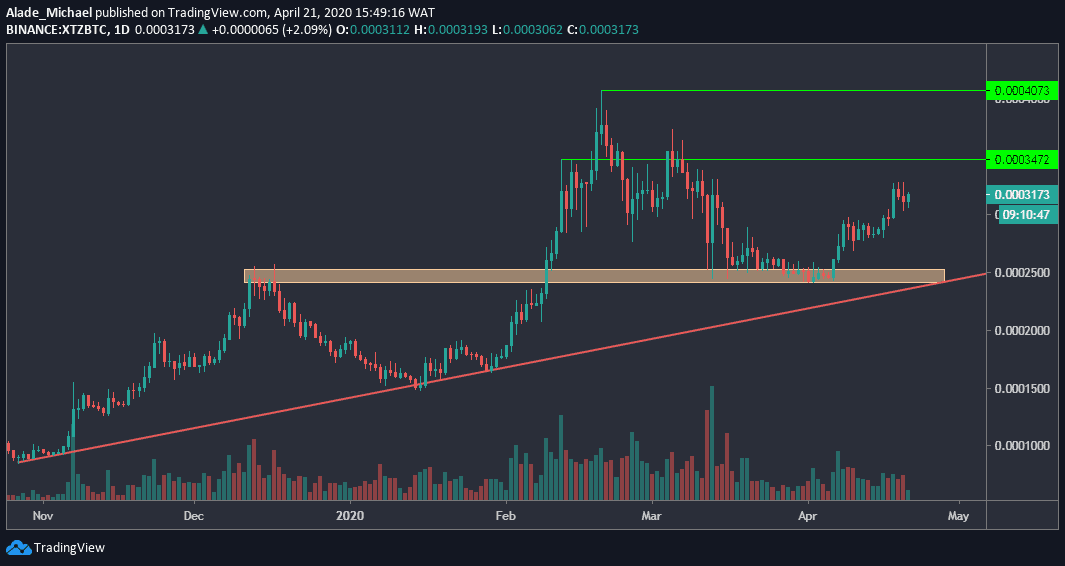
Earlier this month, Tezos started to show strength after establishing strong support around 25000 SAT. After gaining momentum, Tezos price increased by 27% to reach 32840 SAT in 15 days.
But as of now, it is down by 5% with the current price sitting around 31730 SAT.
XTZ bulls have failed to reiterate commitment since the price marked a weekly high around 32840 SAT – where the price is consolidating for the past three days now. It’s necessary to pay attention to this resistance area in case of an upsurge.
Looking at the latest price actions, Tezos could pull back a bit to around 30000 SAT and perhaps 27000 SAT before resuming the uptrend. As of now, the bulls are still in control of the market.
Tezos Price Analysis
Even if the XTZ price rolls below 27000 SAT, there’s still hope for the bulls around 25000 SAT (the orange area), which is supported by the red long-term trend line forming since late October 2019.
A drop below this line could lead to severe selling pressure, which may result in a trend reversal for XTZ/BTC pair.
However, Tezos is currently holding resistance at 32840 SAT. In case of a breach, the potential resistance to watch out for is 34720 SAT, followed by the February high of 40000 SAT – marked green on the chart.