Tezos is starting to show strength, but the current gain is not enough to catalyze any bullish momentum.While Tezos saw a small increase for some days, the price continued to drop against Bitcoin.Tezos found weekly support at .6 after witnessing a small recovery.XTZ/USD: Tezos Locates Temporary Support At .6Key Resistance Levels: , .3Key Support Levels: .57, .37XTZ/USD. Source: TradingViewIn anticipation of the upcoming Bitcoin halving, which is around the corner, Tezos is still undergoing correction beneath , printed in late April. But looking at the latest price actions, it appeared that bulls are stepping back into the market.Following the consistent rise in the entire crypto market cap – currently, 5 billion – Tezos’s market cap is also estimated at .98 billion, with
Topics:
Michael Fasogbon considers the following as important: Price Analysis, Tezos (XTZ) Price, XTZBTC, XTZUSD
This could be interesting, too:
CryptoVizArt writes ETH’s Path to K Involves Maintaining This Critical Support (Ethereum Price Analysis)
Duo Nine writes Crypto Price Analysis June-29: ETH, XRP, ADA, DOGE, and DOT
Duo Nine writes Crypto Price Analysis June-15: ETH, XRP, ADA, DOGE, and DOT
Duo Nine writes Why is the Shiba Inu (SHIB) Price Down Today?
- Tezos is starting to show strength, but the current gain is not enough to catalyze any bullish momentum.
- While Tezos saw a small increase for some days, the price continued to drop against Bitcoin.
- Tezos found weekly support at $2.6 after witnessing a small recovery.
XTZ/USD: Tezos Locates Temporary Support At $2.6
Key Resistance Levels: $3, $3.3
Key Support Levels: $2.57, $2.37
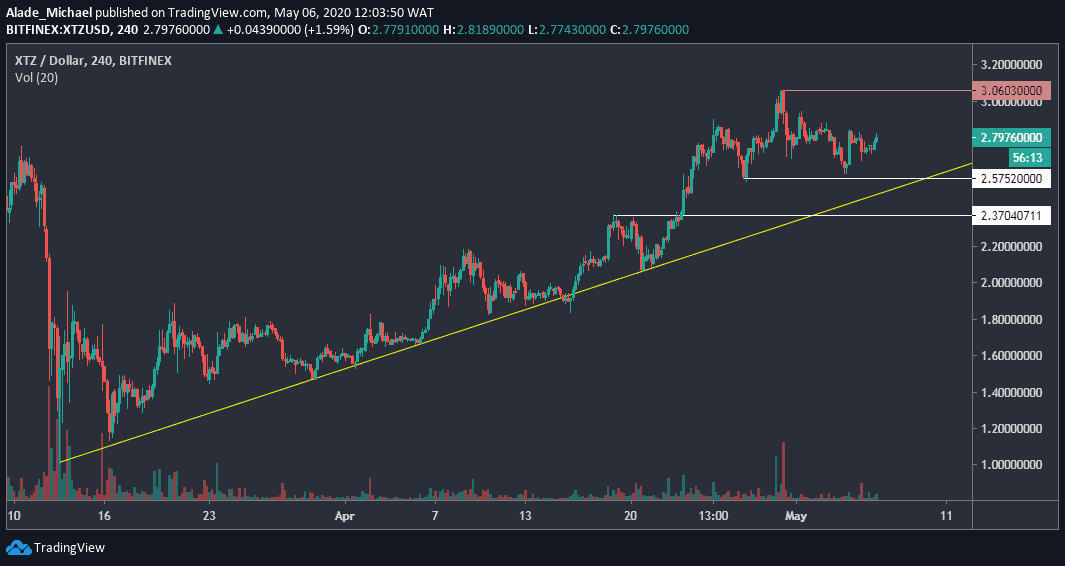
In anticipation of the upcoming Bitcoin halving, which is around the corner, Tezos is still undergoing correction beneath $3, printed in late April. But looking at the latest price actions, it appeared that bulls are stepping back into the market.
Following the consistent rise in the entire crypto market cap – currently, $255 billion – Tezos’s market cap is also estimated at $1.98 billion, with 1.7% gains over the past hours.
The recent recovery from $2.6 level could also indicate an incoming bullish bias if Tezos continues to show strength. The latest increase has brought the trading price to $2.8 against the US Dollar.
Surging above the previous high would indicate a strong bullish signal for XTZ. However, it may continue to correct downward if the buyers fail to show further commitment to price.
Tezos Price Analysis
As said above, Tezos is currently trading around $2.8. If the buyers continue to push higher, the next buying target would be the April resistance at $3, indicated red on the price chart.
A fresh high should be expected at around $3.3 if XTZ breaks up this 7-week resistance.
In case of a sudden rejection, the price is likely to roll back to $2.6 (recent recovery level). But the major support to watch here is $2.57, around the yellow short-term trend line. Support to watch under this is $2.37.
The trading volume is moderate at the moment, but Tezos is expected to surge as soon as buying volume increases significantly.
XTZ/BTC: Tezos Continues Bearishness After Losing 37940 SAT Resistance
Key Resistance Levels: 37940 SAT, 40000 SAT
Key Support Levels: 27860 SAT, 25000 SAT
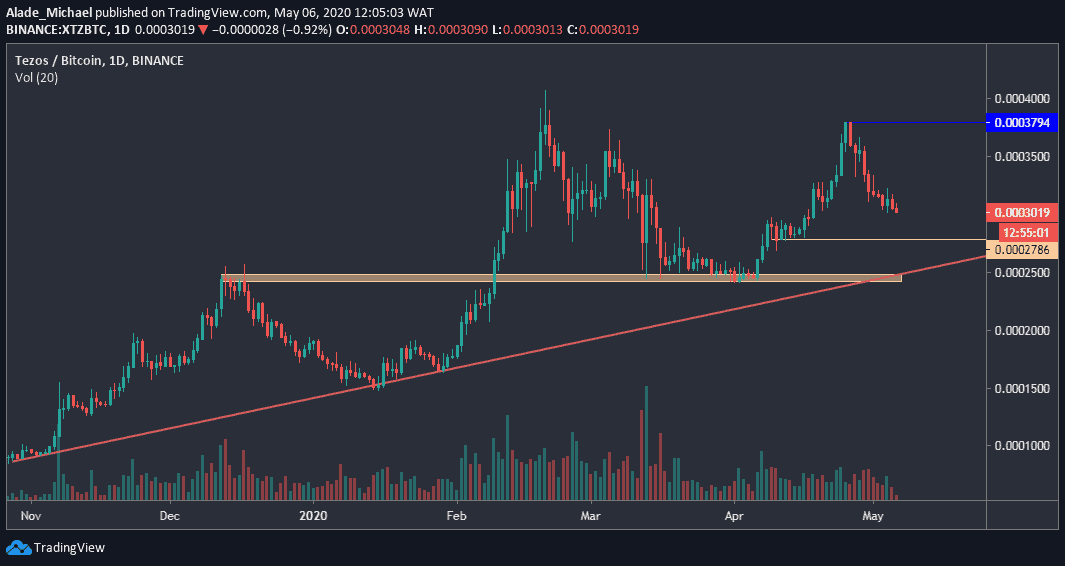
Against Bitcoin, XTZ is under bearish pressure. The price continued to show weakness after witnessing a 12 days decline from 37940 SAT on April 26. Over the past 24-hours, XTZ lost 1.8% to where it’s currently trading at 30190 SAT.
As mentioned in our previous analysis, the price is heading towards the 27860 SAT level, but Tezos is still facing a psychological resistance at 30000 SAT at the moment.
A possible rebound at these mention levels should keep the mid-term bulls back on track. On the other hand, Tezos would continue to remain bearish if the price keeps dropping. It may even get uglier if the red ascending trend line breaks down.
Tezos Price Analysis
If XTZ drops further to 27860 SAT support in the coming days, the next level to keep in mind is the orange demand area of 25000 SAT, around the mid-term trend line.
Tezos could regain momentum if the immediate support can provide a strong rebound. The resistance to watch out for is the 37940 SAT level, from where XTZ started to drop recently. Once the bulls reclaim this resistance, the following resistance here is 40000 SAT – the current 2020 high.
The volume on the price chart is currently decreasing, suggesting that sellers are still present. More bearish actions can be expected if the trading volume continues to drop on the daily.