Tezos found a bottom around .45 after a steady two weeks decline.The overall market is starting to recover the loss with about 0.8%.Against Bitcoin, the price dropped back after a sharp rejection at 28000 SAT level, although it may resume buying short.XTZ/USD: Tezos Is Primed For RecoveryKey Resistance Levels: .68, .71, .75Key Support Levels: .58, .45, XTZ/USD. Source: TradingViewTezos appeared to have found a bottom around .45 on Monday following a two-week drop from around .14 earlier this month. This correction led to a breakdown from a 3-month rising line forming on the daily chart.Due to this latest bearish exhaustion, the price is now changing hands around .64, although it would need to breach the orange descending line on the 4-hours chart to validate a fresh
Topics:
Michael Fasogbon considers the following as important: Price Analysis
This could be interesting, too:
CryptoVizArt writes ETH’s Path to K Involves Maintaining This Critical Support (Ethereum Price Analysis)
Duo Nine writes Crypto Price Analysis June-29: ETH, XRP, ADA, DOGE, and DOT
Duo Nine writes Crypto Price Analysis June-15: ETH, XRP, ADA, DOGE, and DOT
Duo Nine writes Why is the Shiba Inu (SHIB) Price Down Today?
- Tezos found a bottom around $2.45 after a steady two weeks decline.
- The overall market is starting to recover the loss with about 0.8%.
- Against Bitcoin, the price dropped back after a sharp rejection at 28000 SAT level, although it may resume buying short.
XTZ/USD: Tezos Is Primed For Recovery
Key Resistance Levels: $2.68, $2.71, $2.75
Key Support Levels: $2.58, $2.45, $2
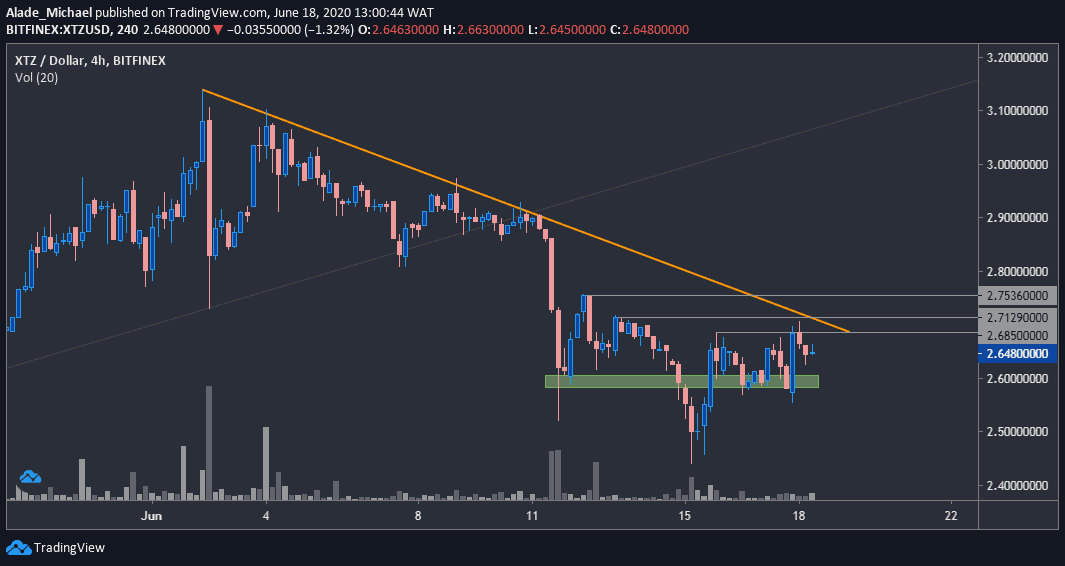
Tezos appeared to have found a bottom around $2.45 on Monday following a two-week drop from around $3.14 earlier this month. This correction led to a breakdown from a 3-month rising line forming on the daily chart.
Due to this latest bearish exhaustion, the price is now changing hands around $2.64, although it would need to breach the orange descending line on the 4-hours chart to validate a fresh uptrend.
On the other hand, the bearish trend is likely to continue if XTZ keeps respecting this orange line. But looking at the setup from a technical perspective, the 12th largest cryptocurrency by market cap is plotting a recovery with a 0.07% increase at the moment.
Tezos Price Analysis
Following the latest surge from the green support area at $2.58, Tezos is looking ahead for a more positive move but it may need to clear resistance levels at $2.685, followed $2.71 and $2.75. A huge price movement should be expected to $2.9 once it successfully breaks.
While Tezos relies on $2.58, a bearish action could send the price to the weekly low of $2.45. A further dip may result in a serious dump at $2 or even $1.8, where Tezos failed to breakthrough in March.
XTZ/BTC: Tezos Found Bottom Above 27000 SAT
Key Resistance Levels: 28350 SAT, 29190 SAT
Key Support Levels: 27100 SAT, 25000 SAT
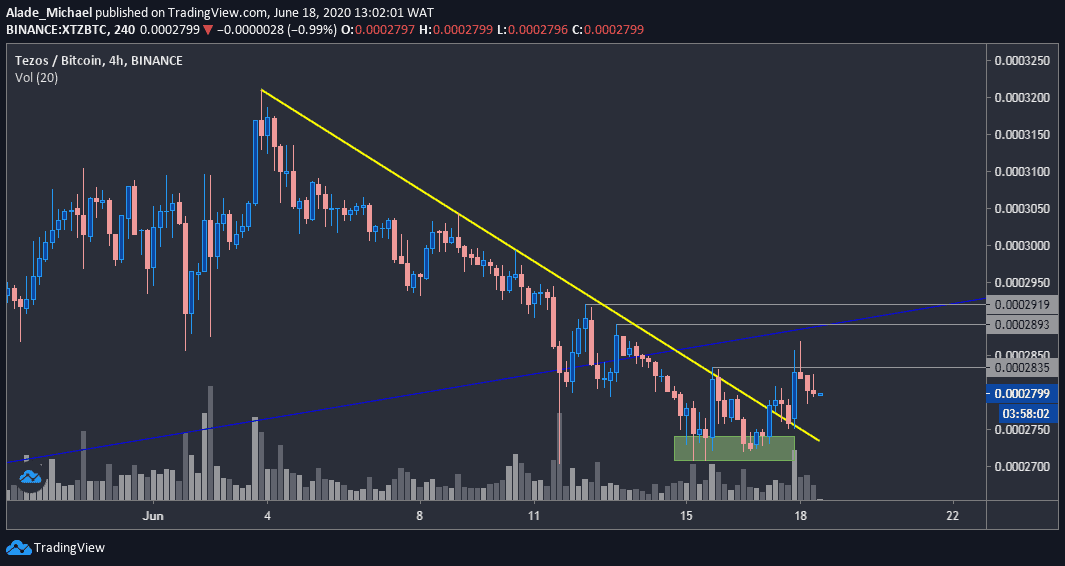
Tezos just formed a double-bottom slightly above 27000 SAT, followed by a quick bounce to 28700 SAT.
The interesting thing here is that the recent breakout from the two weeks regression line shows that the bulls are back in the market. The pullback from 28700 SAT during the last 12-hours is still suspending the next bullish actions. The price would need to surpass the previous high before it rises further.
More so, it would need to climb back above the long-term trend line (blue) that was breached on June 14. If it fails, the bears may step back and start to show interest in the market. As of now, Tezos is still looking for a strong buying volume to plot the next major action.
Tezos Price Analysis
Once Tezos manages to clear 28350 SAT, the target would be towards 28930 SAT – 29190 SAT resistance levels, which is around the blue trend line.
The XTZ/BTC pair is currently sitting on three-day support at 27100 SAT, indicated green in the above chart. If it breaks, the price is likely to drop to as low as 25000 SAT.
With the current bullish sign, the price is more likely to see a small recovery before it resumes selling.