June started very violently for Bitcoin. On the first day of the month of June, the primary cryptocurrency recorded a 3-month high after touching the ,500 resistance mark.However, the drop was even quicker, as Bitcoin price saw a free-fall to 35 on Bitstamp, and even lower on BitMEX exchange.Over the past days, the volatility had decreased, along with the declining amount of trading volume. Keeping in mind also the RSI indicator, which is also indecisive around the 50-neutral area.All that time, there is the month-old descending trend-line (since the K May-7 high) that Bitcoin cannot breach on the daily (with a full body candle above the line).The bottom line is that after two false breakouts over the past week and numerous failed attempts to break, the chances for a bearish move
Topics:
Yuval Gov considers the following as important: Bitcoin (BTC) Price, BTC Analysis, btcusd, btcusdt
This could be interesting, too:
Chayanika Deka writes XRP, SOL, and ADA Inclusion in US Crypto Reserve Pushes Traders on Edge
Chayanika Deka writes Why Arthur Hayes Is Bullish on Bitcoin Under Trump’s Economic Strategy
Mandy Williams writes Why the Bitcoin Market Is Stuck—and the Key Metric That Could Change It: CryptoQuant CEO
Wayne Jones writes Metaplanet Acquires 156 BTC, Bringing Total Holdings to 2,391
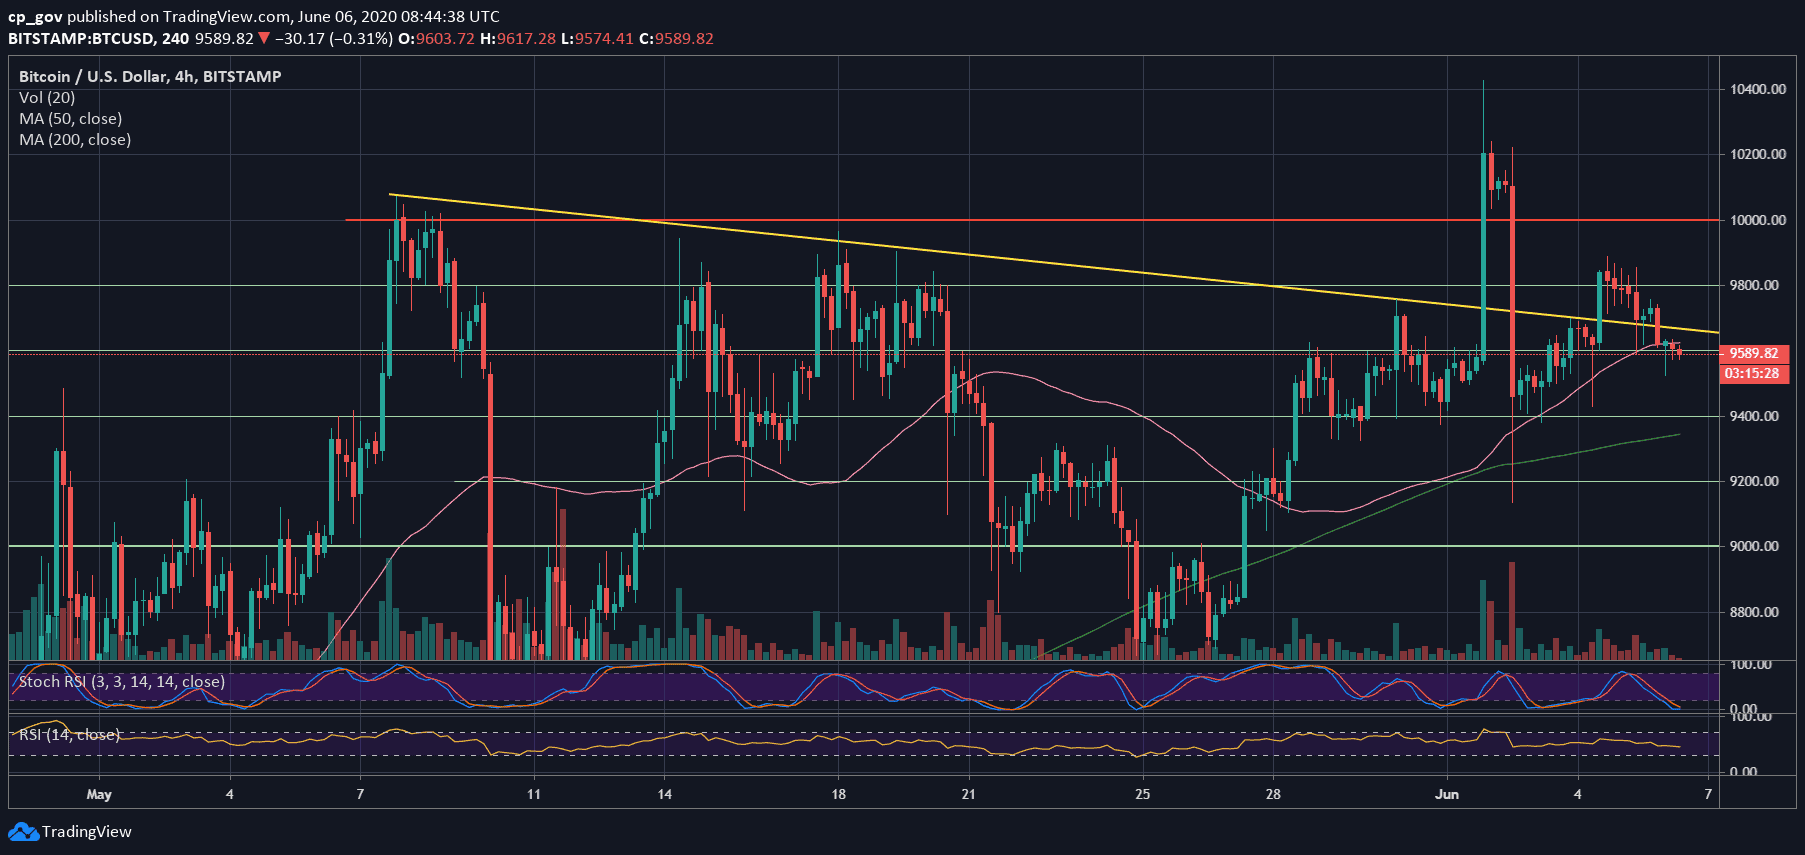
June started very violently for Bitcoin. On the first day of the month of June, the primary cryptocurrency recorded a 3-month high after touching the $10,500 resistance mark.
However, the drop was even quicker, as Bitcoin price saw a free-fall to $9135 on Bitstamp, and even lower on BitMEX exchange.
Over the past days, the volatility had decreased, along with the declining amount of trading volume. Keeping in mind also the RSI indicator, which is also indecisive around the 50-neutral area.
All that time, there is the month-old descending trend-line (since the $10K May-7 high) that Bitcoin cannot breach on the daily (with a full body candle above the line).
The bottom line is that after two false breakouts over the past week and numerous failed attempts to break, the chances for a bearish move increase. Just as in football, if you don’t score, the other team will.
Key Support and Resistance Levels
The first major area of resistance now lies at the mentioned descending trend-line, currently around $9650. However, only a break and a full-body daily-candle above the line will confirm a breakout.
We also have to remember that the whole area until $10,000 is full of demand chunks – especially around $9800.
In case Bitcoin can break above, then the first 5-digit resistance lies around $10,200, followed by the 2020 high around $10,500.
Looking from the bearish side, the first significant support lies around $9400, along with the blue ascending trend-line on the daily chart. Further below lies Tuesday’s low at $9135, followed by $9000 and $8800.
Total Market Cap: $273.5 billion
Bitcoin Market Cap: $176.9 billion
BTC Dominance Index: 64.7%
*Data by CoinGecko
BTC/USD BitStamp 4-Hour Chart
BTC/USD BitStamp 1-Day Chart
