This was one of the worst days for Bitcoin’s price over the past years. Starting yesterday just one step away from the K mark, Bitcoin saw an intraday crash to below 00, before a slight recovery.At some point, the daily candle reached almost 20% in the negative. Anyone who knows Bitcoin can’t say it’s out of the blue. However, as we get close to the halving, such a massive decrease can trigger a larger panic-sell. We had seen already what weak hands could do only two months ago on March 12, when Bitcoin lost over 50% in just a day.Over the past days, Bitcoin tried to break above the ,000 mark hardly but with no success. And when it doesn’t succeed in going higher, it loses momentum and falls.As mentioned here over the past week, the real test would be the 00 – ,000
Topics:
Yuval Gov considers the following as important: Bitcoin (BTC) Price, BTC Analysis, btcusd, btcusdt
This could be interesting, too:
Chayanika Deka writes XRP, SOL, and ADA Inclusion in US Crypto Reserve Pushes Traders on Edge
Chayanika Deka writes Why Arthur Hayes Is Bullish on Bitcoin Under Trump’s Economic Strategy
Mandy Williams writes Why the Bitcoin Market Is Stuck—and the Key Metric That Could Change It: CryptoQuant CEO
Wayne Jones writes Metaplanet Acquires 156 BTC, Bringing Total Holdings to 2,391
This was one of the worst days for Bitcoin’s price over the past years. Starting yesterday just one step away from the $10K mark, Bitcoin saw an intraday crash to below $8000, before a slight recovery.
At some point, the daily candle reached almost 20% in the negative. Anyone who knows Bitcoin can’t say it’s out of the blue. However, as we get close to the halving, such a massive decrease can trigger a larger panic-sell. We had seen already what weak hands could do only two months ago on March 12, when Bitcoin lost over 50% in just a day.
Over the past days, Bitcoin tried to break above the $10,000 mark hardly but with no success. And when it doesn’t succeed in going higher, it loses momentum and falls.
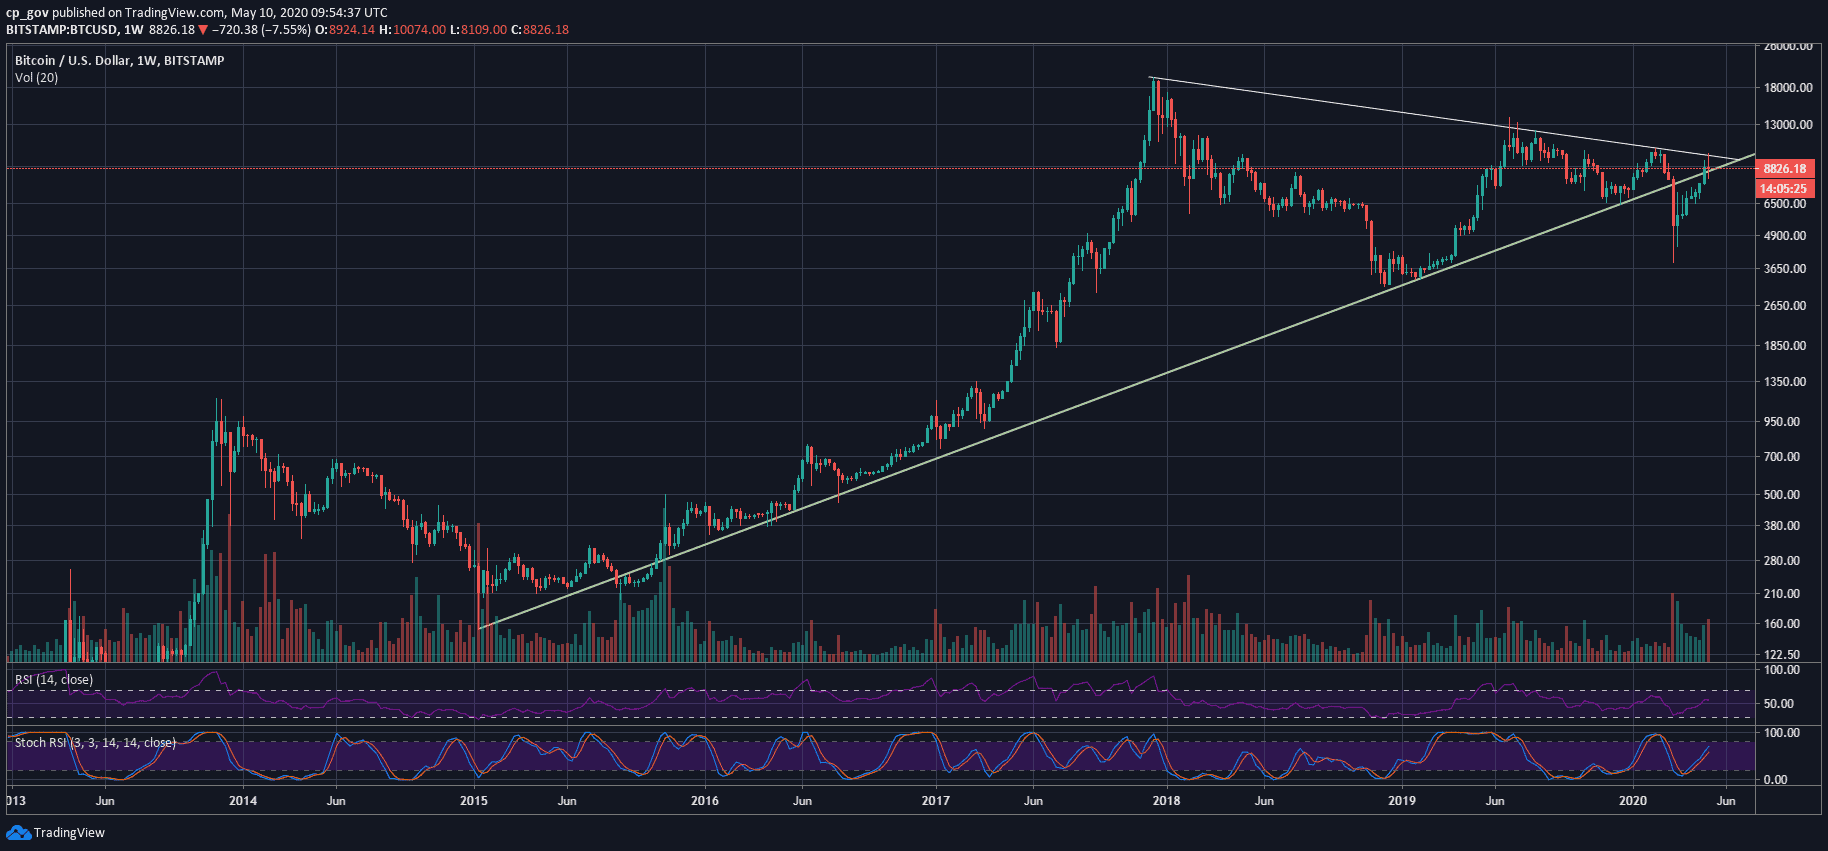
As mentioned here over the past week, the real test would be the $9800 – $10,000 resistance level (which can be seen on the following weekly multi-year chart). Bitcoin will look to close this week’s candle above the $8400 level.
There Are Some Good News
As been said here before, violent moves to one side (up) carry violent movements to the other side (down). Looking at the Bitcoin chart, it had not seen a significant correction since the V-shape recovery from the March 12 plunge.
Hence, it was expected to see a decrease, and it was likely to be a cruel one.
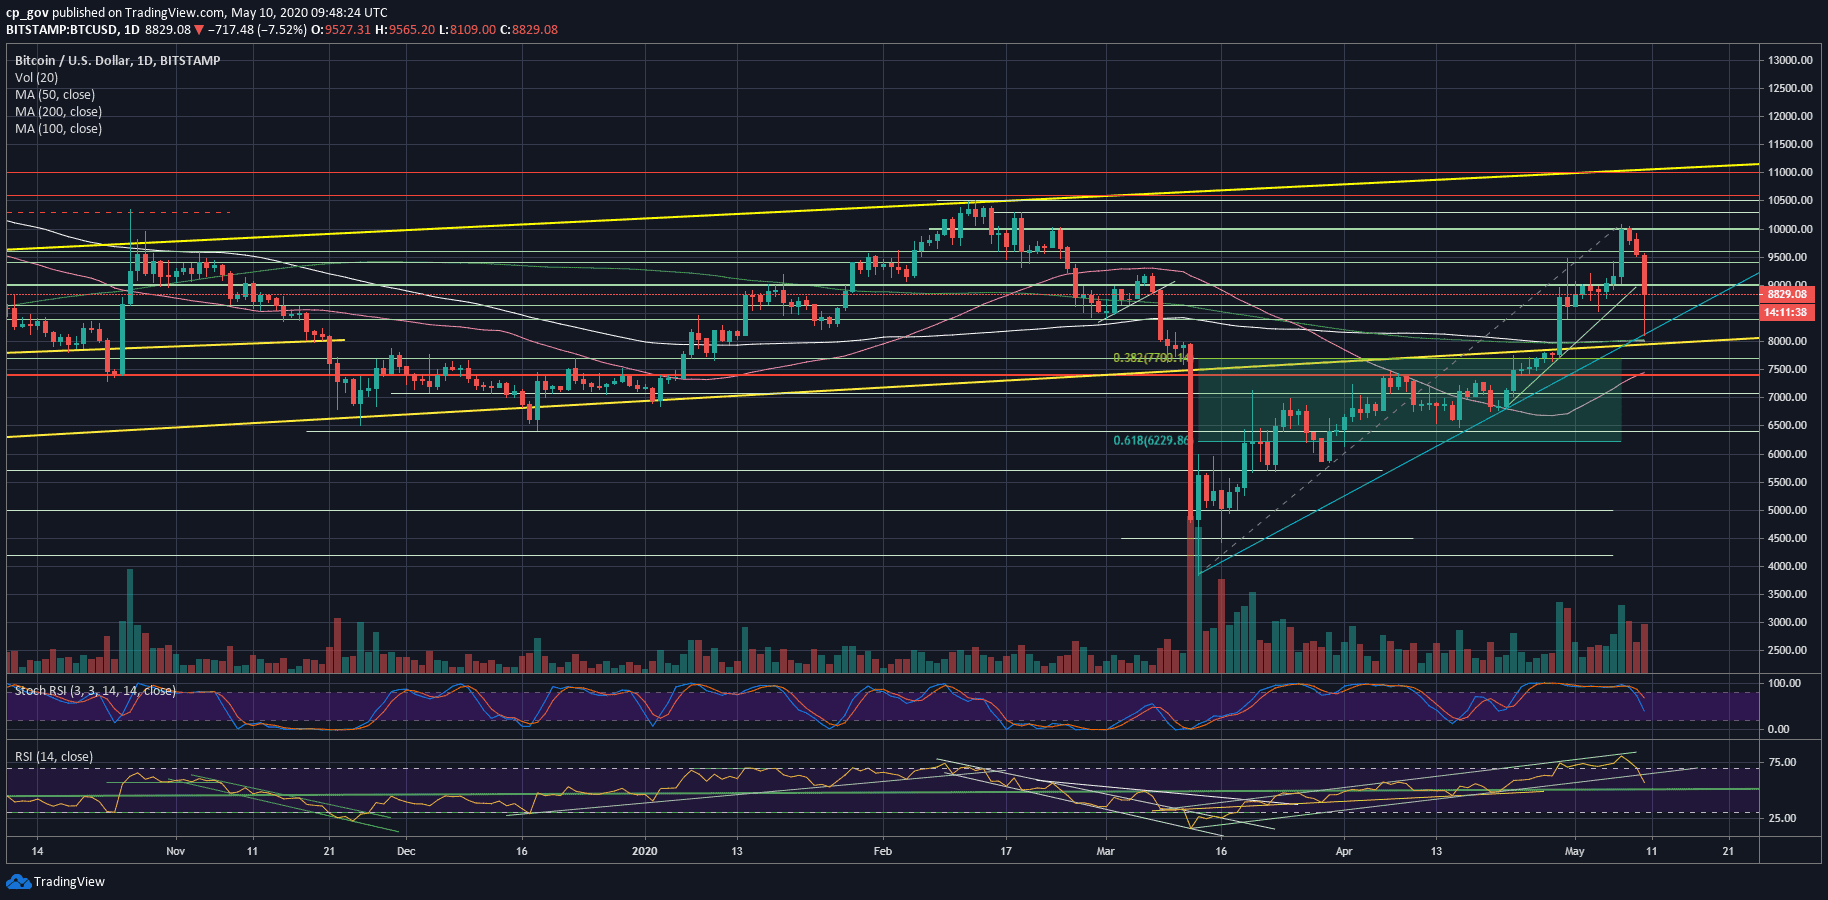
As can be seen on the following daily chart, the zone of $8000, today’s low, includes both the 200 and the 100 days moving average lines.
Since breaking above the moving average lines on April 29, 2020, Bitcoin didn’t come down to confirm them as support. Besides, the low of today correlates with the ascending trend-line, which started forming during the March 12 crash. This line is marked blue on the following chart.
The question is what will happen from here: whether Bitcoin will hold up and not dive further below $8,000, since things can get very ugly, especially following some selling pressure around the halving, which is expected to take place in less than 300 blocks.
Total Market Cap: $242 billion
Bitcoin Market Cap: $162.3 billion
BTC Dominance Index: 67.0%
*Data by CoinGecko
Key Support & Resistance Levels From Here
Support and Resistance
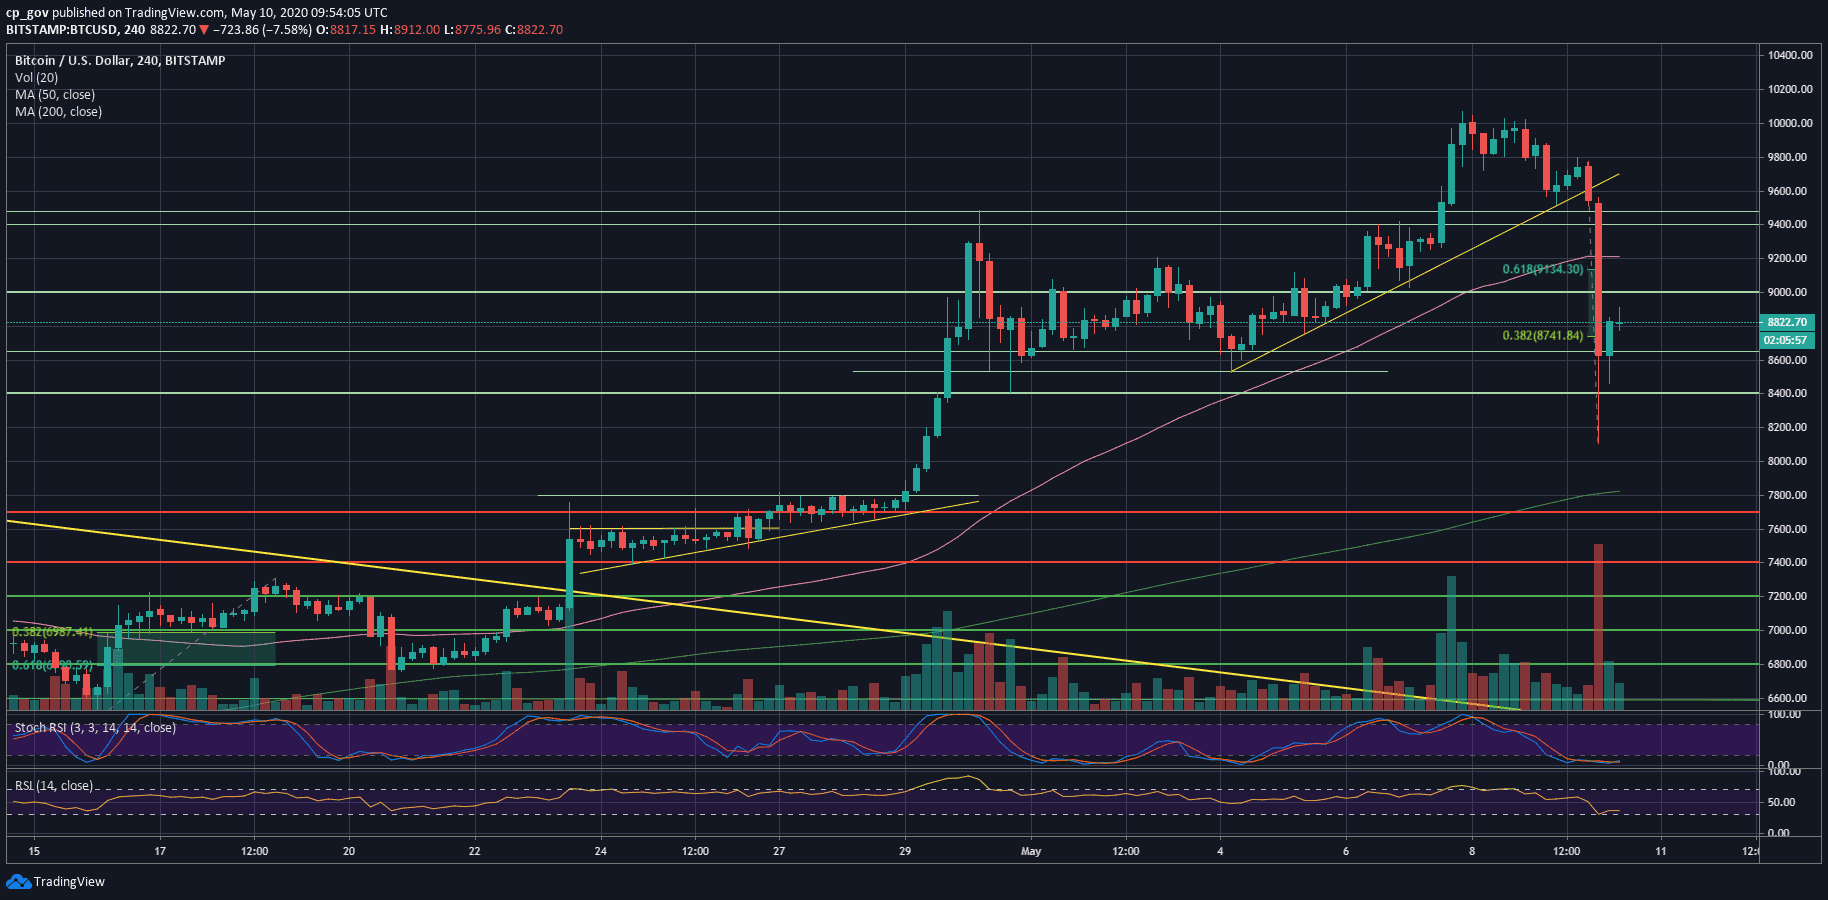
As of writing these lines, Bitcoin recovered from the $8K support zone and is currently trading between the $8600 support and the $9K resistance.
In case $8600 does not hold, then the next support might be $8400, followed by the $8K level, as described above. Further down lies $7700, which is also the 38.2% Fibonacci retracement level (since the March 12 recovery). Next is $7400, along with the 50-days moving average line (the pink line).
From above, in case the $9K is broken up, then the next resistance levels would be $9130 (the 61.8% level) and $9400 – $9500 (the prior high).
The Daily RSI
The RSI reflects the cruel plunge; however, the momentum indicator currently maintains the 50 bullish RSI level. The RSI will look to regain momentum around the 64-65 levels, where lies a mid-term ascending trend-line.
Trading Volume
The massive amount of long liquidations would probably mark Sunday’s volume candle next to the highest volume days over the past month. However, there are more than 12 hours as of now until the candle closes.
BTC/USD BitStamp 4-Hour Chart
BTC/USD BitStamp 1-Day Chart