This week had been quite volatile, even for Bitcoin. After the primary cryptocurrency broke-up to the 2020 highs near .5K, followed by a quicker drop back below the same critical trend-line, BTC is left now at the same levels it was trading at for the majority of the past week.The bottom line is that Bitcoin has hard times dealing with the descending trend-line as can be seen on both charts below – the daily and the 4-hour chart.This trend-line was started forming a month ago when Bitcoin reached the ,000 mark for the first time since recording the 2020 high around mid-February.Another Rejection: K Incoming?As can be seen below, today’s daily candle tested the same trend-line and failed to break above. Immediately, Bitcoin lost over 0, getting away from the line.As of now,
Topics:
Yuval Gov considers the following as important: Bitcoin (BTC) Price, BTC Analysis, btcusd, btcusdt
This could be interesting, too:
Chayanika Deka writes XRP, SOL, and ADA Inclusion in US Crypto Reserve Pushes Traders on Edge
Chayanika Deka writes Why Arthur Hayes Is Bullish on Bitcoin Under Trump’s Economic Strategy
Mandy Williams writes Why the Bitcoin Market Is Stuck—and the Key Metric That Could Change It: CryptoQuant CEO
Wayne Jones writes Metaplanet Acquires 156 BTC, Bringing Total Holdings to 2,391
This week had been quite volatile, even for Bitcoin. After the primary cryptocurrency broke-up to the 2020 highs near $10.5K, followed by a quicker drop back below the same critical trend-line, BTC is left now at the same levels it was trading at for the majority of the past week.
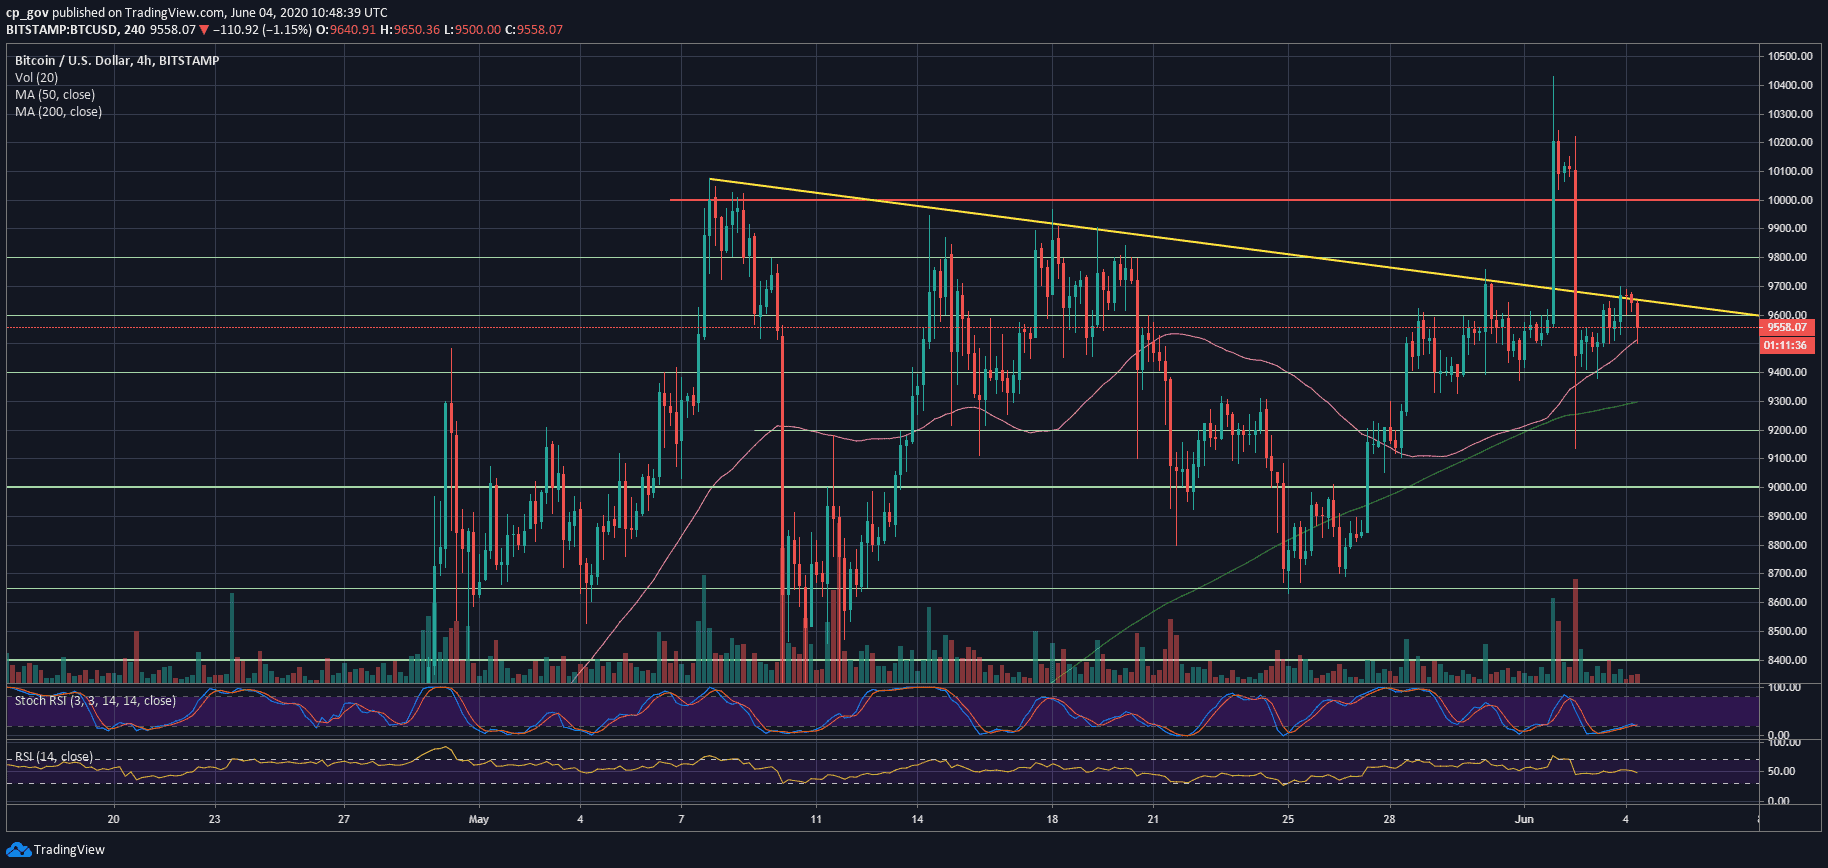
The bottom line is that Bitcoin has hard times dealing with the descending trend-line as can be seen on both charts below – the daily and the 4-hour chart.
This trend-line was started forming a month ago when Bitcoin reached the $10,000 mark for the first time since recording the 2020 high around mid-February.
Another Rejection: $9K Incoming?
As can be seen below, today’s daily candle tested the same trend-line and failed to break above. Immediately, Bitcoin lost over $100, getting away from the line.
As of now, Bitcoin is back at the trading range between $9400 – $9600 following today’s failure.
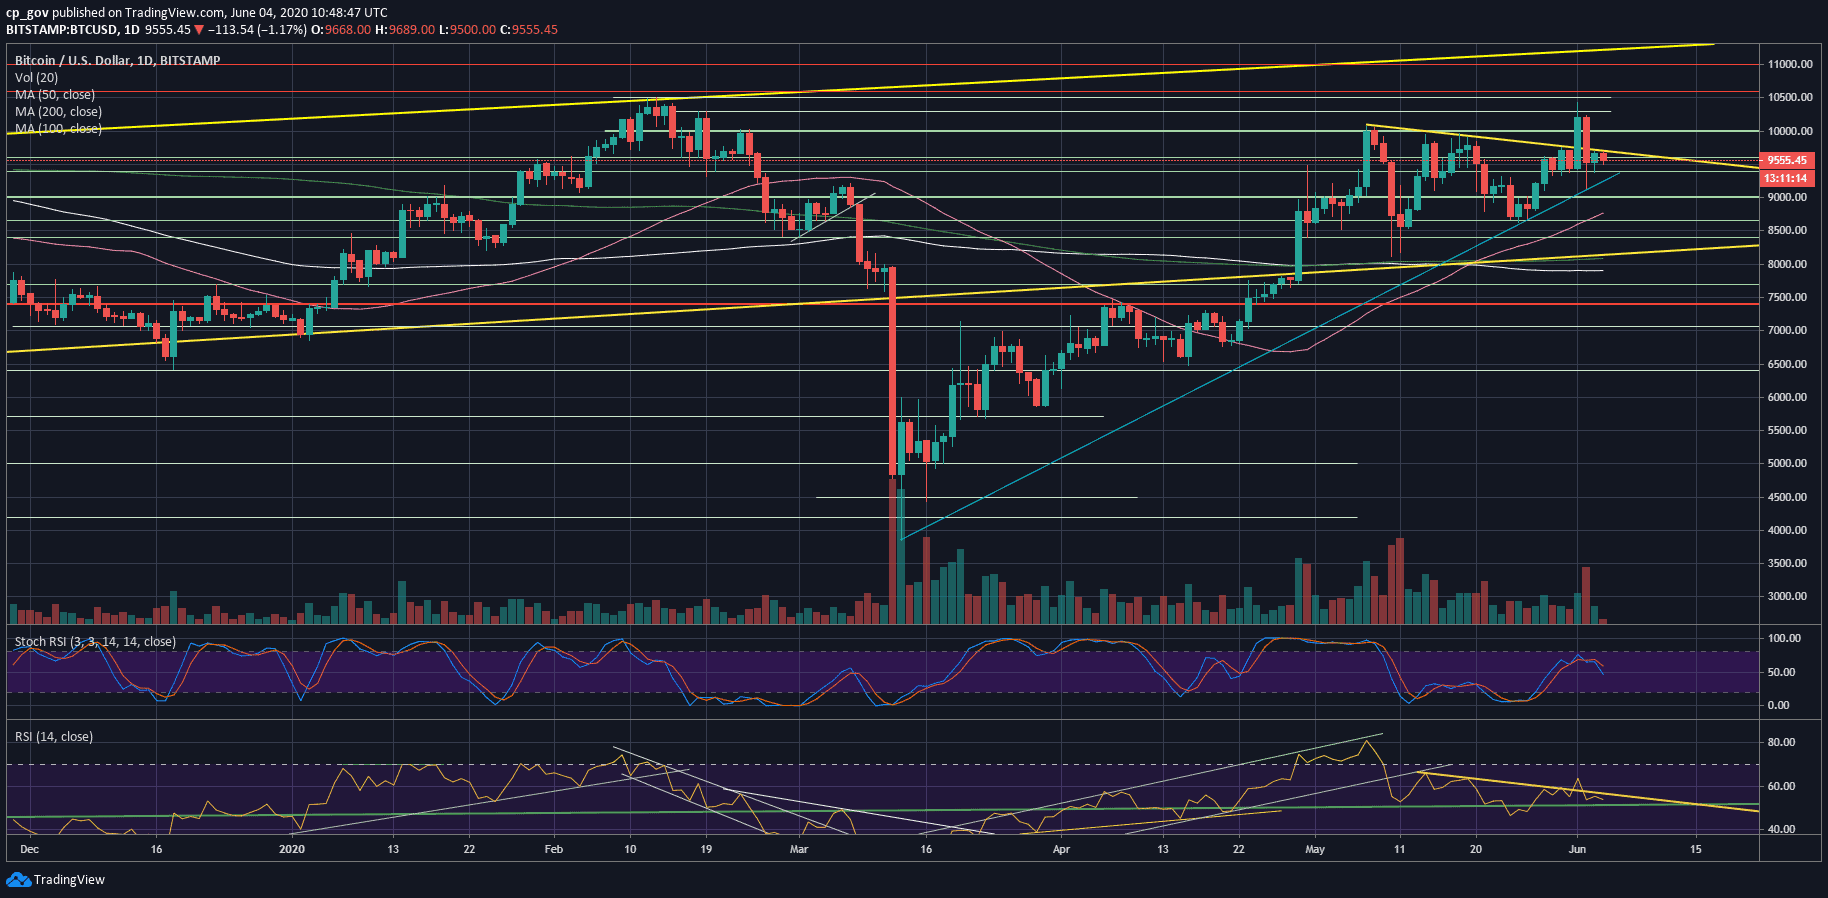
As mentioned here yesterday, Bitcoin must maintain $9135 on this week’s candle close in order to stay above the long-term ascending trend-line from 2015.
Looking at the RSI indicator, we can see the momentum is decreasing as well, as the indicator nearing the critical level of 50.
The first significant test will be the $9400 support, along with the blue marked ascending trend-line on the daily chart.
In case the line breaks down, we can rapidly see Bitcoin retesting the $9K level, followed by $8800, together with the 50-days moving average line (marked pink).
From above, the first major resistance is the mentioned descending trend-line, which currently lies around $9650. In case Bitcoin does break up, followed by high trading volumes, we can expect the next resistance at $9800, followed by the $10K mark.
Total Market Cap: $271.5 billion
Bitcoin Market Cap: $175.8 billion
BTC Dominance Index: 64.8%
*Data by CoinGecko
BTC/USD BitStamp 4-Hour Chart
BTC/USD BitStamp 1-Day Chart