Quick recap: for the past few weeks, Bitcoin had been following the crashing global markets. While the S&P 500 and Nasdaq lost more than 30% over the past month, Bitcoin followed them but with a little bit of leverage.The primary cryptocurrency is now trading at a 50% discount from the highs of mid-February, when it was trading above the ,000 mark.Many crypto enthusiasts waited for this moment. Bitcoin was born after the most recent significant financial crisis, the one of 2008. Nowadays, Bitcoin is facing its first real economic collapse, but so far behaving just like any other asset. Not the way Satoshi Nakamoto expected it to be.Turning Point For BTC?We could see the same positive correlation between Bitcoin and the stock markets over the past weeks. However, during the past days,
Topics:
Yuval Gov considers the following as important: AA News, Bitcoin (BTC) Price, Bitcoin Long-Term Prediction, BTC Analysis, btcusd
This could be interesting, too:
Chayanika Deka writes Yuga Labs Secures Major Win as SEC Closes Investigation Without Charges
Andrew Throuvalas writes Bitcoin Soars Back To ,000 After BlackRock CEO Says “Buy The Dip”
Chayanika Deka writes XRP, SOL, and ADA Inclusion in US Crypto Reserve Pushes Traders on Edge
Chayanika Deka writes Why Arthur Hayes Is Bullish on Bitcoin Under Trump’s Economic Strategy
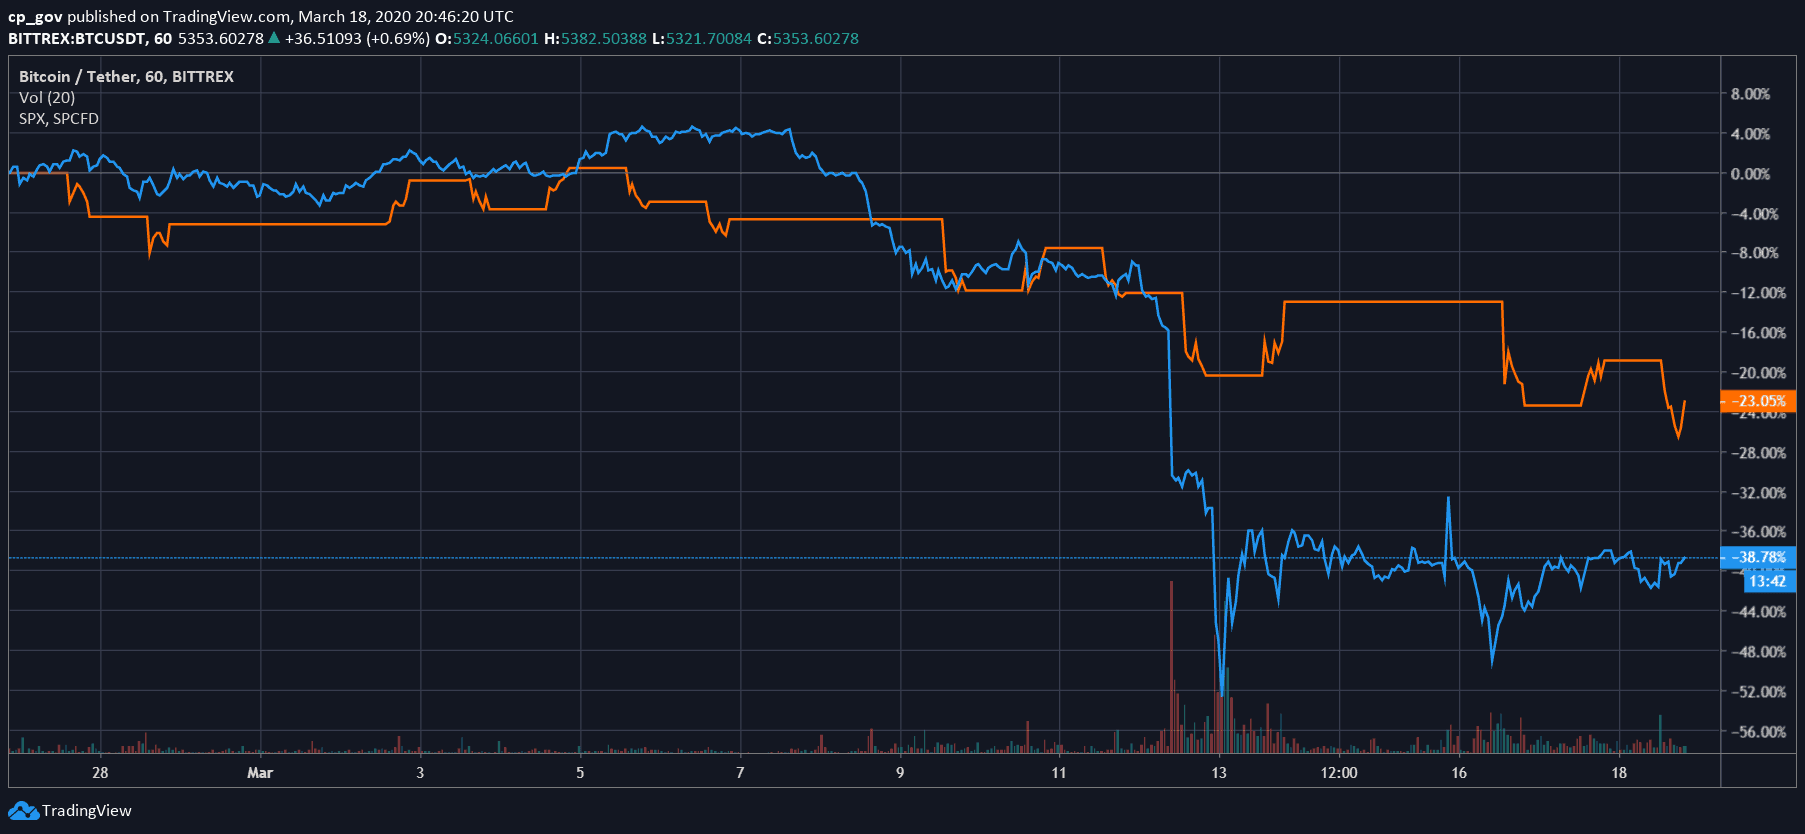
Quick recap: for the past few weeks, Bitcoin had been following the crashing global markets. While the S&P 500 and Nasdaq lost more than 30% over the past month, Bitcoin followed them but with a little bit of leverage.
The primary cryptocurrency is now trading at a 50% discount from the highs of mid-February, when it was trading above the $10,000 mark.
Many crypto enthusiasts waited for this moment. Bitcoin was born after the most recent significant financial crisis, the one of 2008. Nowadays, Bitcoin is facing its first real economic collapse, but so far behaving just like any other asset. Not the way Satoshi Nakamoto expected it to be.
Turning Point For BTC?
We could see the same positive correlation between Bitcoin and the stock markets over the past weeks. However, during the past days, Bitcoin holds firmly, trading inside a range between $5000 and $5500. This is despite another plunge of 5-6% in the major indexes.
Is this the turning point, when Bitcoin says goodbye to the positive correlation in order to become a real safe-haven asset? Only time will tell. Just a reminder, Gold crashed at the beginning of the 2008 financial crisis, just as it does now, before starting to be a hedge and started soaring.
Crypto Market Data
Total Market Cap: $150 billion
Bitcoin Market Cap: $95.6 billion
BTC Dominance Index: 63.7%
*Data by CoinGecko
Key Levels To Watch & Next Possible Targets
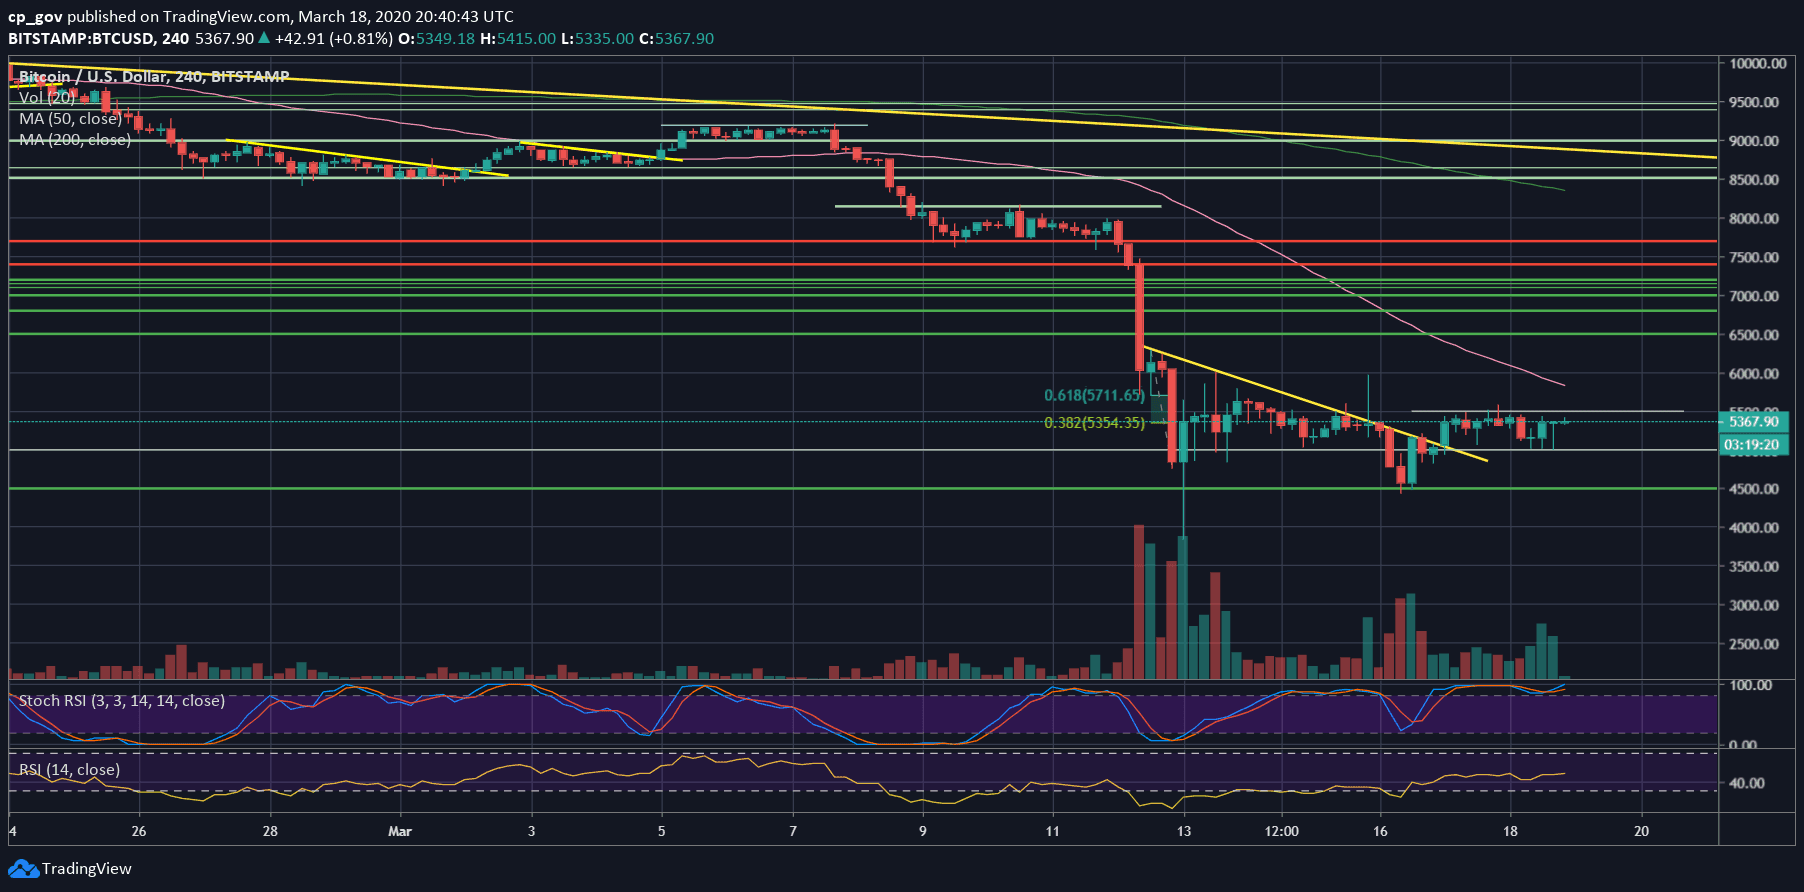
– Support/Resistance levels: As mentioned above, the overall picture can be seen on the 4-hour chart below. Bitcoin is trading between $5000 from below, and $5500 from above. A breakout to either direction is likely to point the next short-term for Bitcoin.
From above, the first resistance is the $5500 price zone (the 78.6% Fib retracement level from the June 2019 bull-run), followed by $5700. Further above lies $6000 – $6100 (Sunday’s high).
From below, the first major level of support is the $5000 mark. Further below lies $4700 – $4800. Beneath, there is the Monday’s low around $4500, before the next significant level at $4200 (old resistance turned support level from the beginning of 2019), and the $4000 mark.
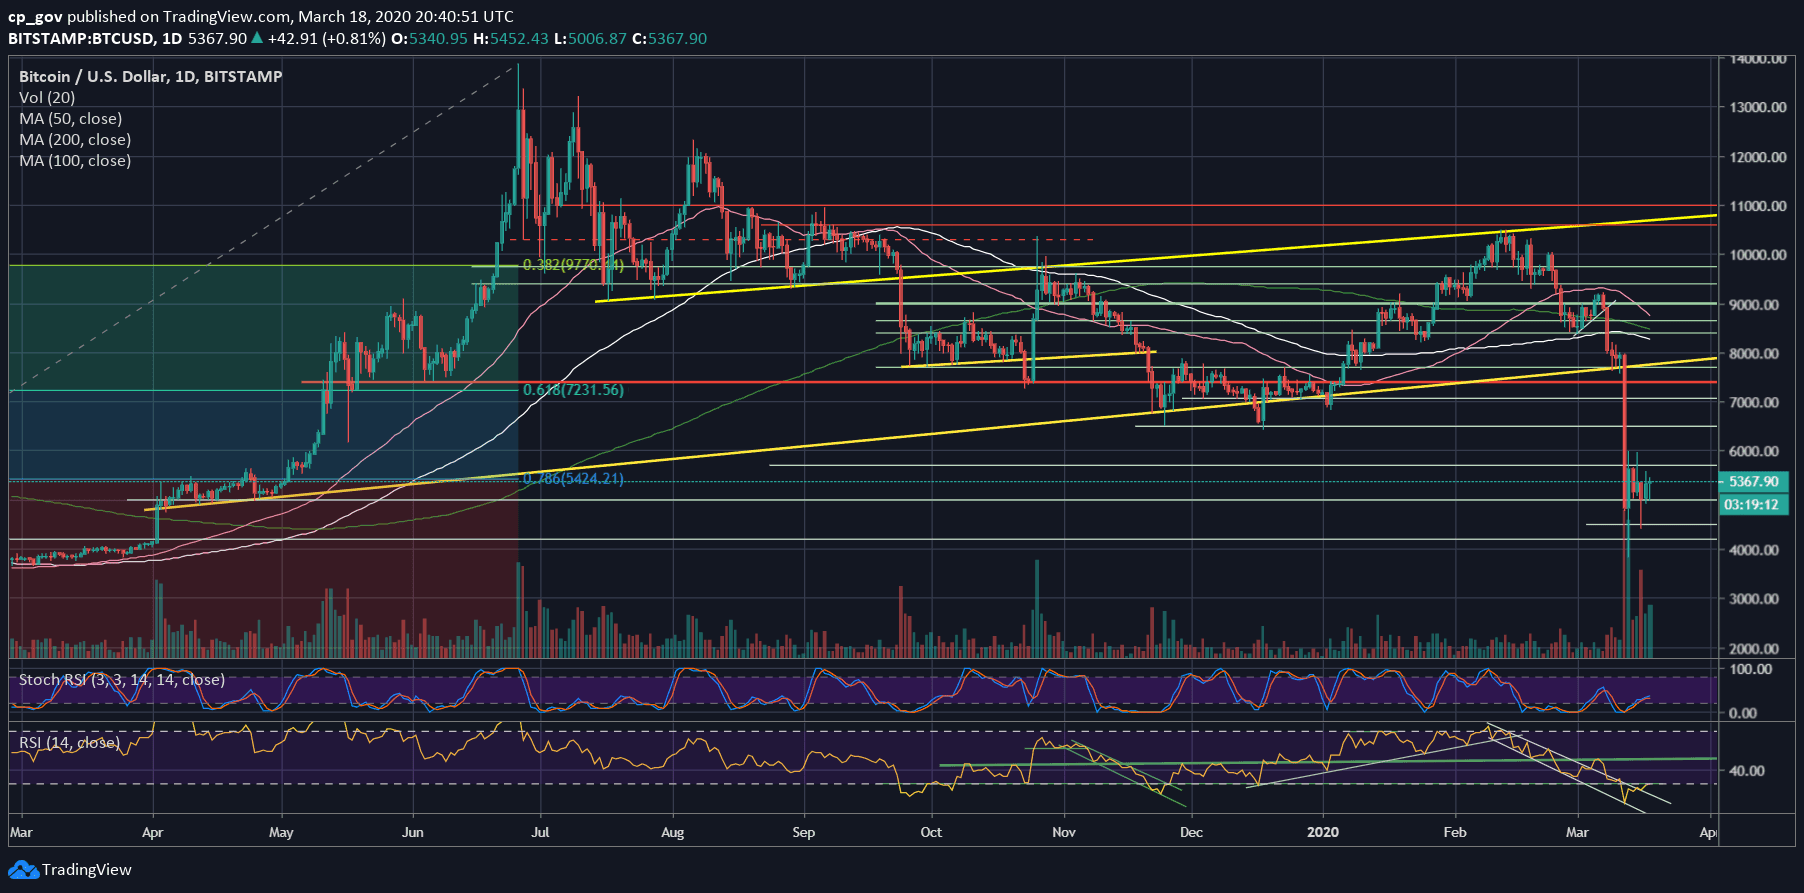
– The RSI Indicator: The RSI is at a decision point. After breaking out of the marked wedge, which started forming a month ago, the RSI is facing the 30 level as resistance. A break here can boost the bulls.
– Trading volume: As mentioned here before, Thursday and Friday, March 12 & 13, were the two highest daily volume candles over the past year. Since then, the volume had been declining, getting ready for the next move.
BTC/USD BitStamp 4-Hour Chart
BTC/USD BitStamp 1-Day Chart