Over the past days since Thursday, we saw Bitcoin safely trading about the 00 mark. During last Thursday, Bitcoin surged to over K, breaking above the critical 50-days moving average line (marked pink on the following daily chart). Since then, and together with the bullish wind form Wall Street (3% gains on Friday), Bitcoin topped at 06 (Bitstamp) as of yesterday. Over the past hours, Bitcoin is having a small correction below 00. However, the critical area from below is still the MA-50 line – currently around 40, along with the K mark. From the bullish side, we can mention the massive volume of Thursday’s reversal candle. That was the highest volume day since April 2nd. After gaining over 0 in two days, it’s reasonable to see Bitcoin correcting down. As of now, the
Topics:
Yuval Gov considers the following as important: Bitcoin (BTC) Price, BTC Analysis, btcusd
This could be interesting, too:
Chayanika Deka writes XRP, SOL, and ADA Inclusion in US Crypto Reserve Pushes Traders on Edge
Chayanika Deka writes Why Arthur Hayes Is Bullish on Bitcoin Under Trump’s Economic Strategy
Mandy Williams writes Why the Bitcoin Market Is Stuck—and the Key Metric That Could Change It: CryptoQuant CEO
Wayne Jones writes Metaplanet Acquires 156 BTC, Bringing Total Holdings to 2,391
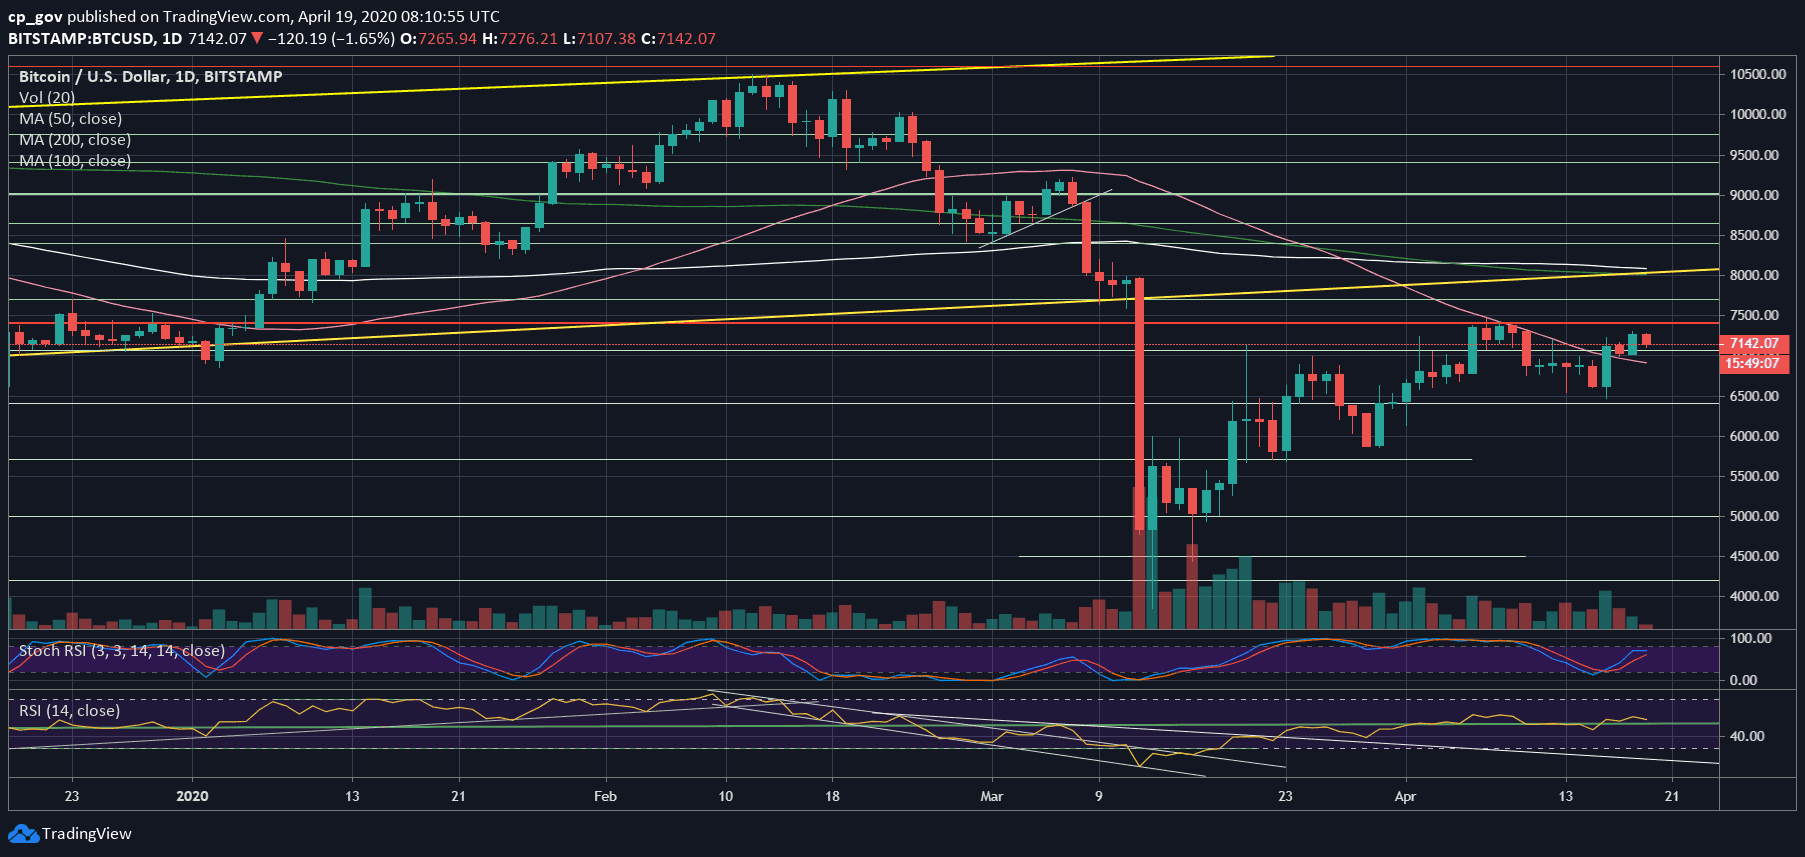
Over the past days since Thursday, we saw Bitcoin safely trading about the $7000 mark. During last Thursday, Bitcoin surged to over $7K, breaking above the critical 50-days moving average line (marked pink on the following daily chart).
Since then, and together with the bullish wind form Wall Street (3% gains on Friday), Bitcoin topped at $7306 (Bitstamp) as of yesterday. Over the past hours, Bitcoin is having a small correction below $7200. However, the critical area from below is still the MA-50 line – currently around $6940, along with the $7K mark.
From the bullish side, we can mention the massive volume of Thursday’s reversal candle. That was the highest volume day since April 2nd. After gaining over $800 in two days, it’s reasonable to see Bitcoin correcting down.
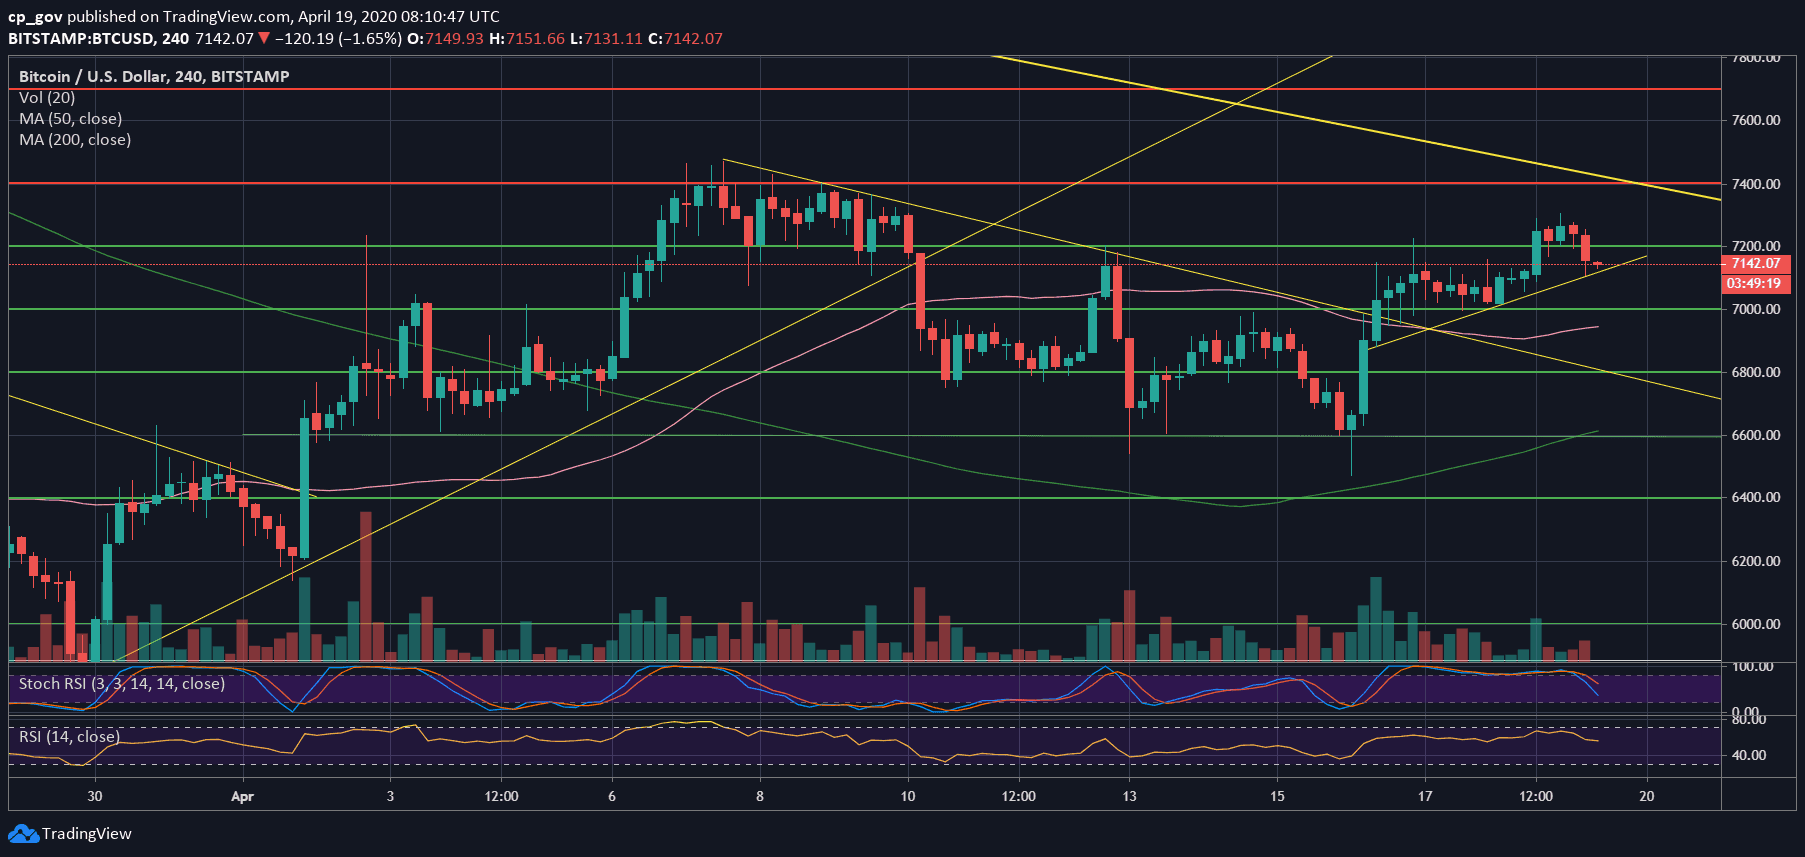
As of now, the bulls will watch the crucial level of $7400 – $7500. The latter contains the monthly high from ten days ago, along with a mid-term descending trend-line. There is always the fear of a double-top pattern that can quickly turn to a bearish setting.
Total Market Cap: $208.4 billion
Bitcoin Market Cap: $132 billion
BTC Dominance Index: 63.4%
*Data by CoinGecko
Key Levels To Watch & Next Possible Targets
– Support/Resistance levels: As mentioned above, Bitcoin reached $7300 and got rejected. From below, the initial support is the prior resistance at $7150 – $7200. Below lies the $7K price area, along with the 50-days moving average line (the pink line on the daily chart). Further below lies $6800, and $6600.
From above, after $7300, lies the significant resistance area at the $7400 – $7500 (April’s high), as discussed above. Further above lies $7700.
– The RSI Indicator: After breaking back above the 50 mark, the RSI looks a bit tired. There is a bit of bearish price divergence on the daily chart.
– Trading volume: As mentioned above, Thursday was the second-highest volume day, month to date. Friday and Saturday saw a decreasing amount of volume, in anticipation of the next big move.
BTC/USD BitStamp 4-Hour Chart
BTC/USD BitStamp 1-Day Chart