Over the past two days, we saw Bitcoin losing momentum following the global markets. After reaching the 00 resistance, Bitcoin price failed to break the symmetrical triangle as can be seen on the following 4-hour chart.From there, Bitcoin found temporary support upon the 00 boundary, before continuing the 3-day plunge to the lower angle of the triangle. As of writing these lines, the lower ascending trend-line holds. The critical support lies around 30 (Bitstamp), which is also the daily low.The past month was devastating for almost all assets. While Wall Street’s leading indices are down 30% from their all-time high reached mid-February, Bitcoin lost over 40% from its 2020 high reached mid-February as well.Last week Bitcoin was trading steadily above the K mark. As of now, in
Topics:
Yuval Gov considers the following as important: Bitcoin (BTC) Price, BTC Analysis, btcusd
This could be interesting, too:
Chayanika Deka writes XRP, SOL, and ADA Inclusion in US Crypto Reserve Pushes Traders on Edge
Chayanika Deka writes Why Arthur Hayes Is Bullish on Bitcoin Under Trump’s Economic Strategy
Mandy Williams writes Why the Bitcoin Market Is Stuck—and the Key Metric That Could Change It: CryptoQuant CEO
Wayne Jones writes Metaplanet Acquires 156 BTC, Bringing Total Holdings to 2,391
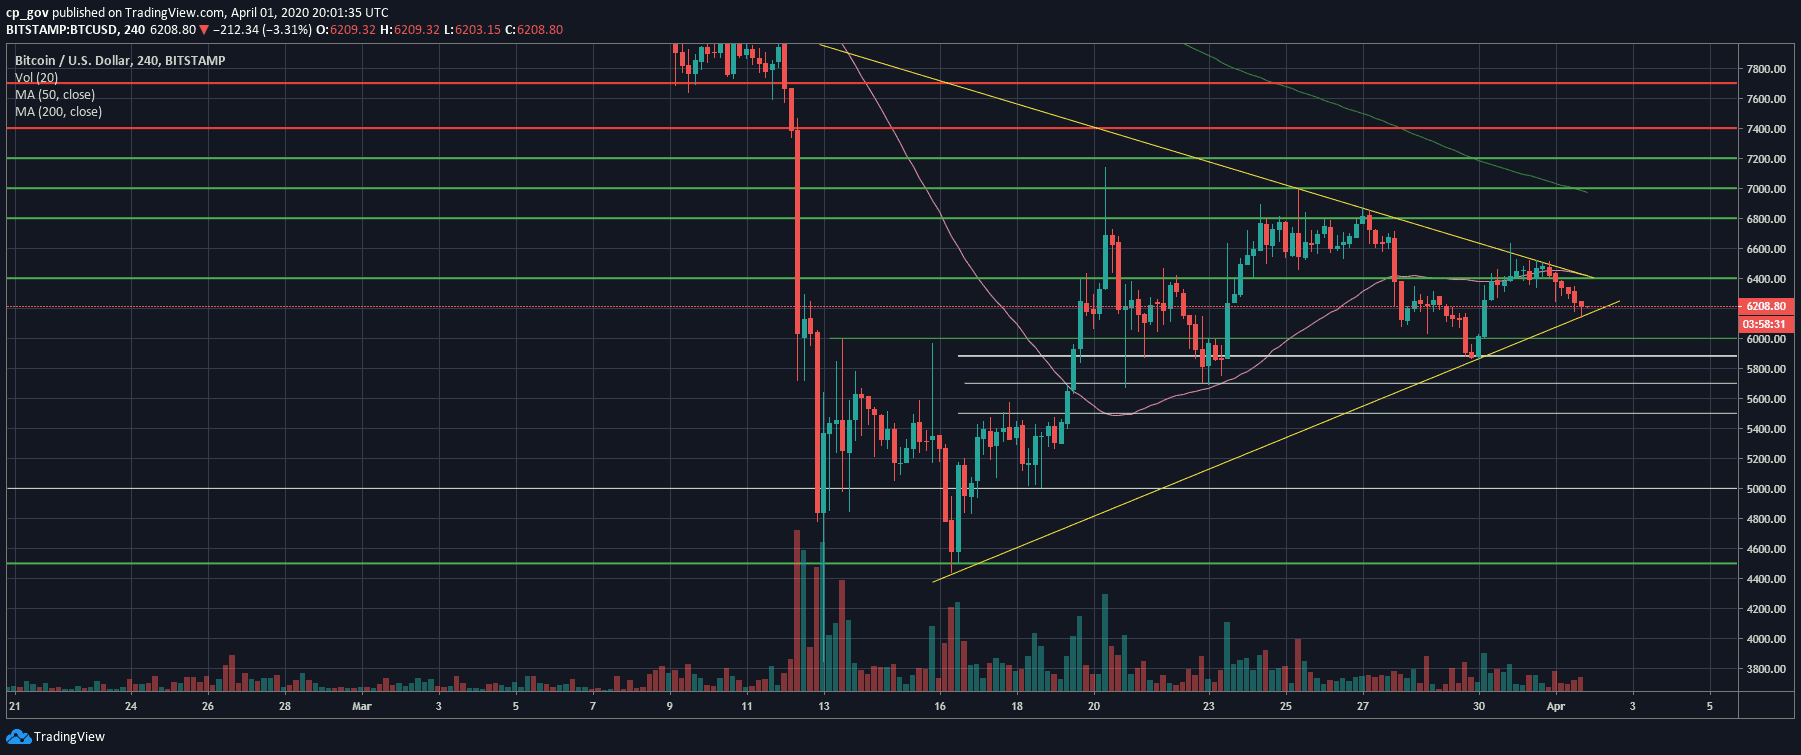
Over the past two days, we saw Bitcoin losing momentum following the global markets. After reaching the $6600 resistance, Bitcoin price failed to break the symmetrical triangle as can be seen on the following 4-hour chart.
From there, Bitcoin found temporary support upon the $6400 boundary, before continuing the 3-day plunge to the lower angle of the triangle. As of writing these lines, the lower ascending trend-line holds. The critical support lies around $6130 (Bitstamp), which is also the daily low.
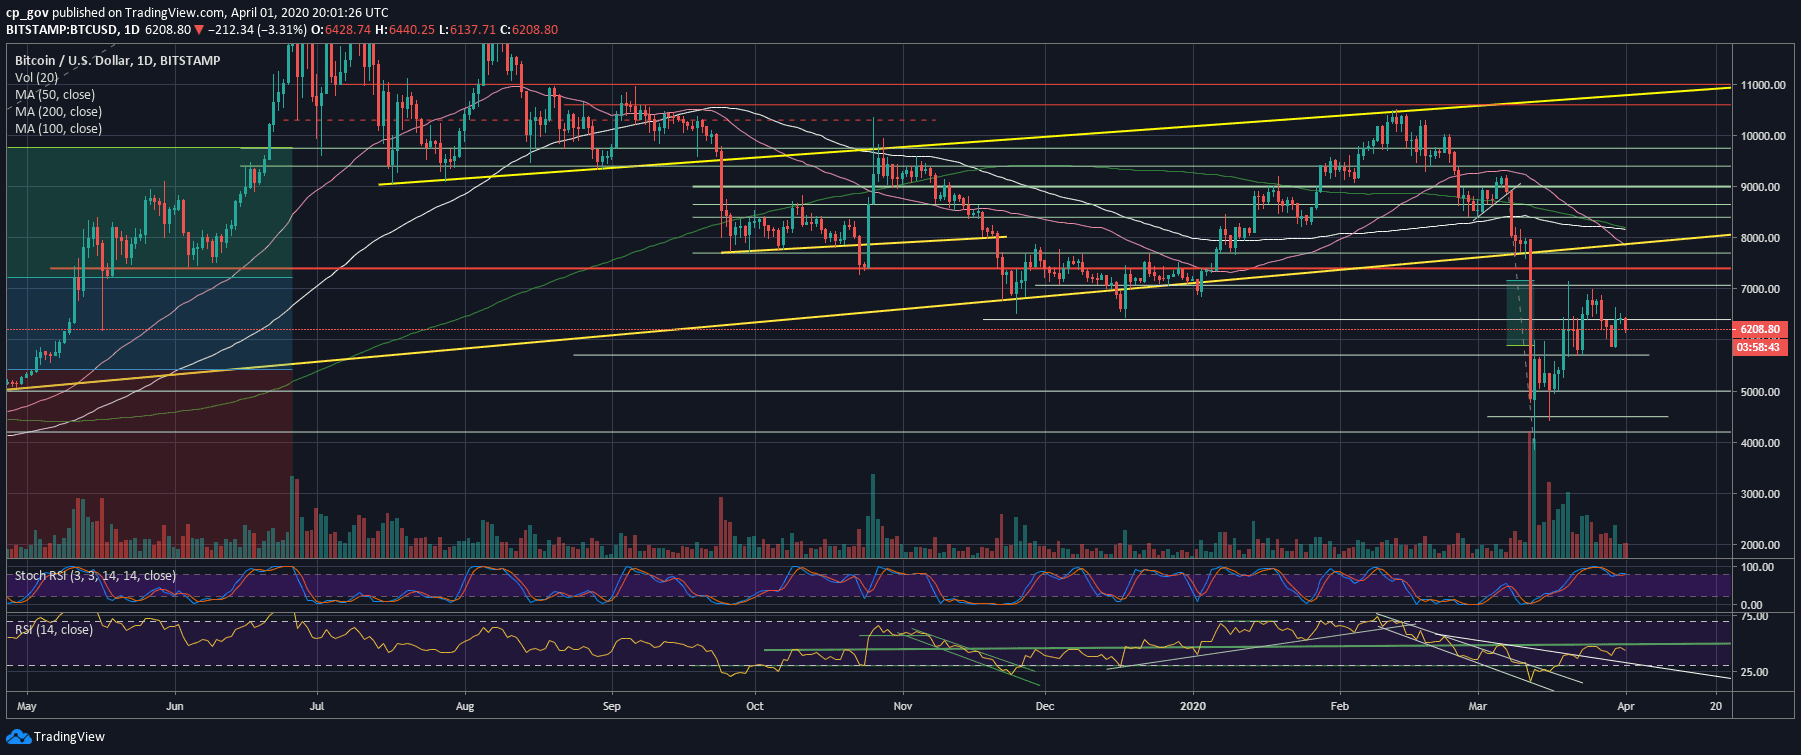
The past month was devastating for almost all assets. While Wall Street’s leading indices are down 30% from their all-time high reached mid-February, Bitcoin lost over 40% from its 2020 high reached mid-February as well.
Last week Bitcoin was trading steadily above the $6K mark. As of now, in case Bitcoin won’t hold the mentioned support line, it could quickly develop into a deeper plunge to the $5K area once again.
Total Market Cap: $175.6 billion
Bitcoin Market Cap: $113.7 billion
BTC Dominance Index: 64.8%
*Data by CoinGecko
Key Levels To Watch & Next Possible Targets
– Support/Resistance levels: After breaking down the $6300 – $6400 price range (together with the 4-hour MA-50 pink line), Bitcoin is now facing the crucial support around the $6100 area, along with the lower ascending angle of the 4-hour’s triangle.
In case of a breakdown, we can expect the next support line to be found at $5880 – $5900. Further down lies $5700 and $5500, before the $5200 – $5300 price zone.
In case of a correction, the first resistance level from above now lies at $6200, followed by the $6300 – $6400 support turned resistance strip. Above lies the prior high at $6600.
– The RSI Indicator: The RSI encountered the crucial resistance at 48 – 50 and became bearish quickly. As of now, the RSI is facing down, and more than that, the Stochastic RSI oscillator is about to enter the neutral area after a bearish crossover at the overbought territory. This might lead to even further drop.
– Trading volume: Despite the action, the volume levels had been declining since mid-February. Bitcoin is waiting for the next move to take place, not mentioning the next move might have started today, April 1st.
BTC/USD BitStamp 4-Hour Chart
BTC/USD BitStamp 1-Day Chart