Following the coronavirus health crisis, the global stock markets collapsing one after another. Despite the Fed’s emergency steps, the markets continue to tumble.The EU markets are recording over 10% declines, while Wall Street is reaching the low level of December 2018. 13-Month ROI had demolished in 30 days.Bitcoin is not left behind. After the Fed’s decision yesterday, Bitcoin responded with a quick surge of 14%. However, the party didn’t last long – Just an hour after, when Wall Street futures opened in deep red, and Bitcoin returned to the 00 range.The Bitcoin RollercoasterSince then, Bitcoin’s price saw huge volatility. Following the crashing markets, Bitcoin plunged to the 00 support area, but quickly recovered nicely, and as of writing these lines, Bitcoin price is trading
Topics:
Yuval Gov considers the following as important: Bitcoin (BTC) Price, BTC Analysis
This could be interesting, too:
Chayanika Deka writes XRP, SOL, and ADA Inclusion in US Crypto Reserve Pushes Traders on Edge
Chayanika Deka writes Why Arthur Hayes Is Bullish on Bitcoin Under Trump’s Economic Strategy
Mandy Williams writes Why the Bitcoin Market Is Stuck—and the Key Metric That Could Change It: CryptoQuant CEO
Jordan Lyanchev writes Liquidations Top 0M as Bitcoin Falls K, Reversing Trump-Driven Rally
Following the coronavirus health crisis, the global stock markets collapsing one after another. Despite the Fed’s emergency steps, the markets continue to tumble.
The EU markets are recording over 10% declines, while Wall Street is reaching the low level of December 2018. 13-Month ROI had demolished in 30 days.
Bitcoin is not left behind. After the Fed’s decision yesterday, Bitcoin responded with a quick surge of 14%. However, the party didn’t last long – Just an hour after, when Wall Street futures opened in deep red, and Bitcoin returned to the $5300 range.
The Bitcoin Rollercoaster
Since then, Bitcoin’s price saw huge volatility. Following the crashing markets, Bitcoin plunged to the $4500 support area, but quickly recovered nicely, and as of writing these lines, Bitcoin price is trading above the $5K mark.
Again, we still see the positive correlation between Bitcoin and the equity markets. If Satoshi could have spoken today, he would have said that this is not what the original plan was.
This financial crisis might somehow lead to the mass adoption of Bitcoin; however, until that happens, we are likely to see huge volatility to both sides.
In my opinion, we are still far from the day when there will be an inverse correlation to the markets, but anything can happen, and quick. Until then, caution in trading is required.
Back to the charts
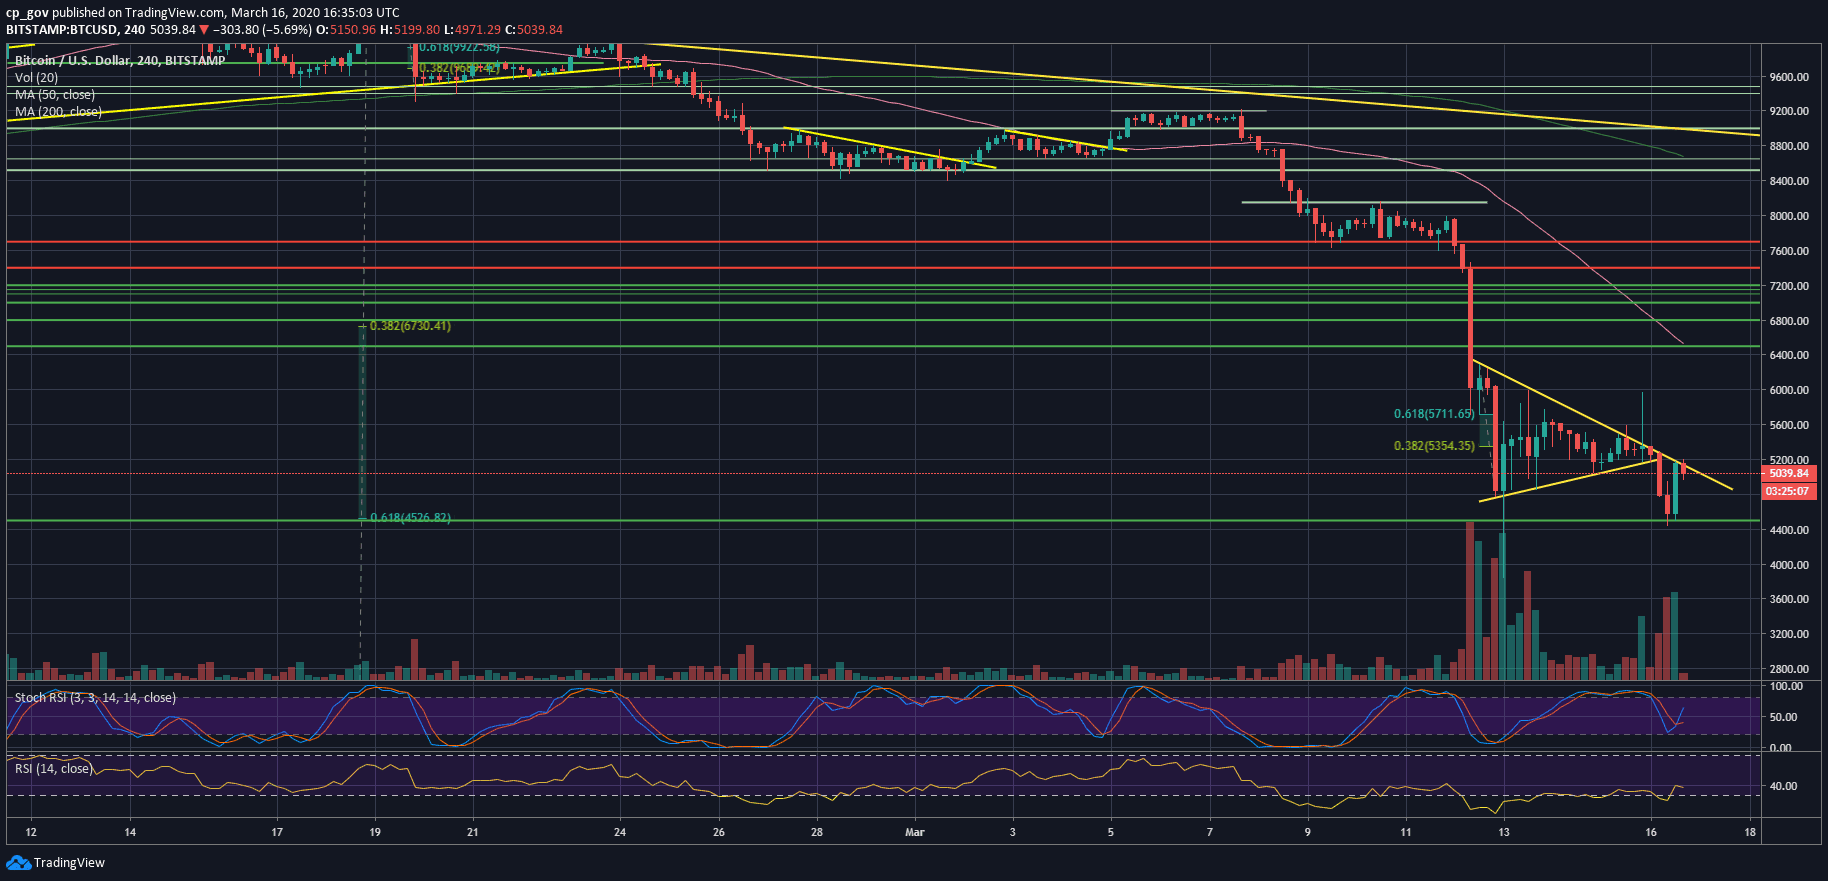
Yesterday we mentioned the symmetrical triangle pattern on the 4-hour chart, and we also said that it would be likely making its breakout decision according to the Wall Street futures.
As can be seen below, this is exactly what happened. Following a bullish fake-out (after the Fed’s decision), the breakout took place, and as can be seen – the bears were with their hands on.
Bitcoin broke down at the $5200 level, and saw a free fall to the $4500 support, in a matter of hours. Following that, Bitcoin corrected most of the drops, and now facing the triangle’s angle from below, around $5200, as the first level of resistance.
Total Market Cap: $143 billion
Bitcoin Market Cap: $92 billion
BTC Dominance Index: 64.3%
*Data by CoinGecko
Key Levels To Watch & Next Possible Targets
– Support/Resistance levels: As mentioned above, the first level of resistance is the $5200 support turned resistance, along with the descending trend-line.
In case Bitcoin breaks up – the next level is the $5350, followed by the $5500 price zone (the 78.6% Fib retracement level from the June 2019 bull-run), while the next one is $5700 support turned resistance level. Further above lies $6000 (yesterday’s high following the Fed decision’s temp rally).
From below, the first level of support is now the $5000 mark. Further below $4700 – $4800. Beneath, there is the daily low around $4500, before the next significant level at $4200 (old resistance turned support level from the beginning of 2019), and the $4000. As a reminder, the 2020 low from Thursday’s odd dump lies around $3700.
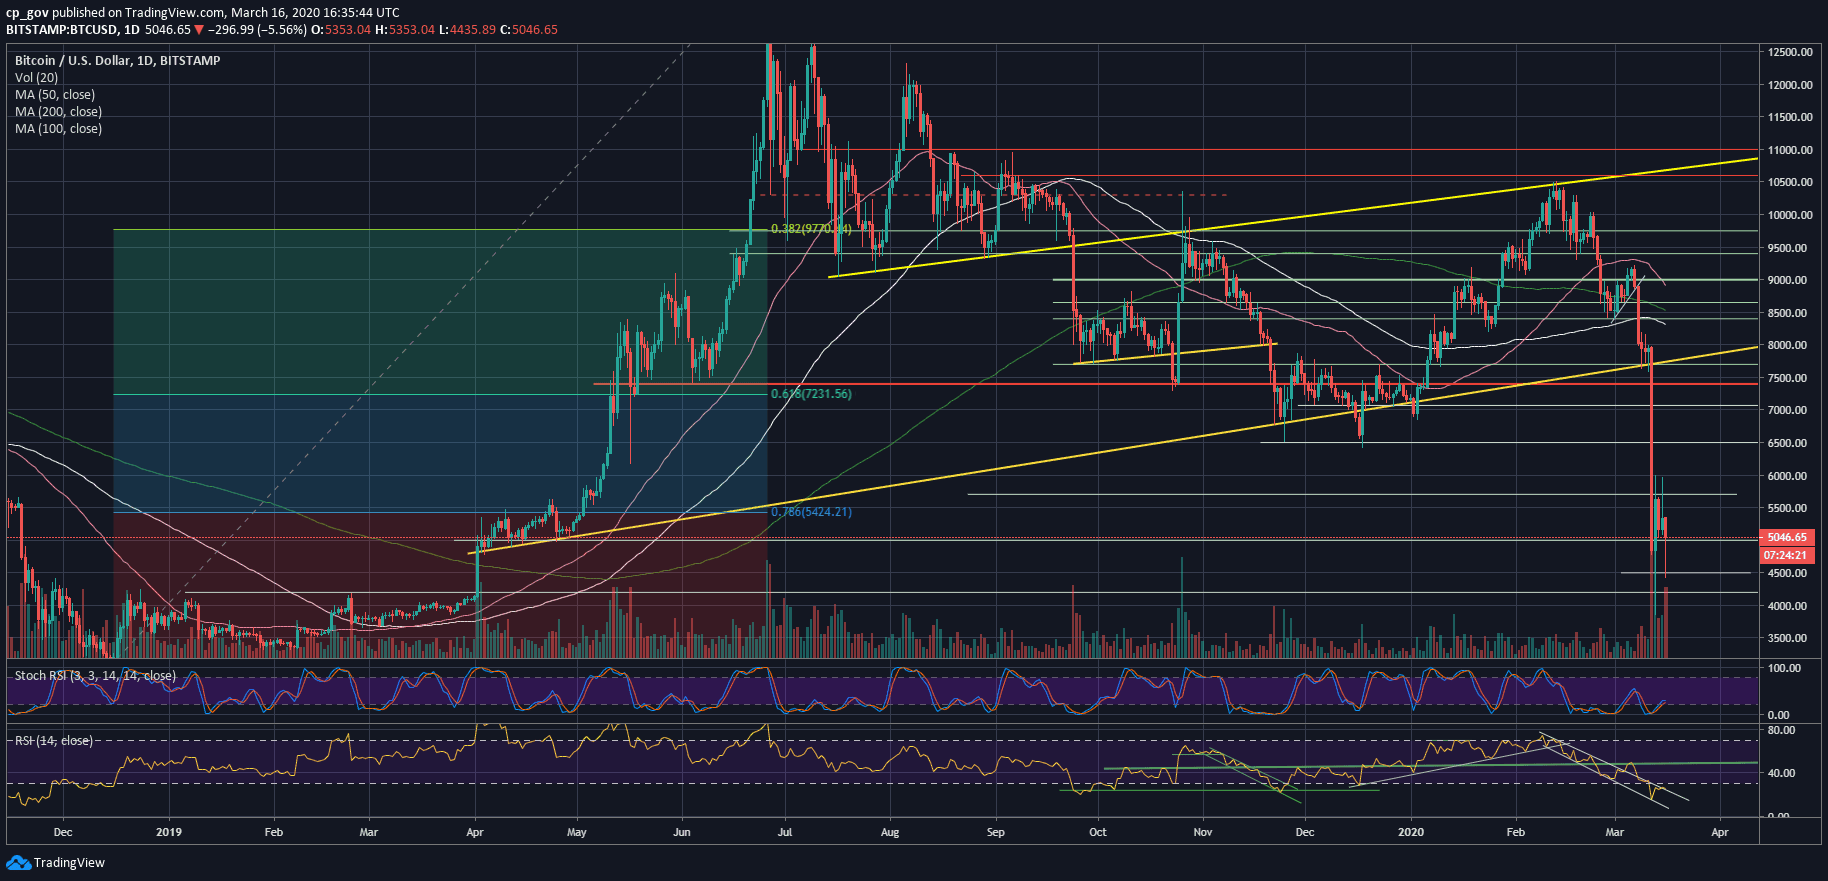
– The RSI Indicator: The RSI is back inside the descending wedge pattern, which started forming at the beginning of February 2020. As of writing theses lines, the momentum indicator is still testing the upper boundary of the wedge as resistance, but the chances are in favor of the bears, as it seems now.
– Trading volume: Massive amounts of volume followed the recent sell-off; actually both Thursday and Friday, March 12 & 13, saw higher volume levels than the capitulation day of November 2018.
BTC/USD BitStamp 4-Hour Chart
BTC/USD BitStamp 1-Day Chart