Over the past two days, we saw Bitcoin continued its correlation with Wall Street. After reaching a 2-month low at 00, and finding support upon the historic trend-line, Bitcoin recovered to 50, however, just like the Wall Street futures, BTC price lost momentum and now trading roughly around 00 – 00.In the bigger picture, Bitcoin touched the historic ascending trend-line two days ago, as can be seen on the following weekly chart. This historic trend line was started forming in January 2015, when Bitcoin found the 2014 bear market’s bottom at 2 (Bitstamp).BTC/USD weekly overview, Source: TradingViewThe coronavirus had created a new financial situation that led Wall Street to its worst day since the Sub-Prime real estate crisis in 2008.No one thinks that this is the end of the
Topics:
Yuval Gov considers the following as important: Bitcoin (BTC) Price, BTC Analysis, btcusd
This could be interesting, too:
Chayanika Deka writes XRP, SOL, and ADA Inclusion in US Crypto Reserve Pushes Traders on Edge
Chayanika Deka writes Why Arthur Hayes Is Bullish on Bitcoin Under Trump’s Economic Strategy
Mandy Williams writes Why the Bitcoin Market Is Stuck—and the Key Metric That Could Change It: CryptoQuant CEO
Wayne Jones writes Metaplanet Acquires 156 BTC, Bringing Total Holdings to 2,391
Over the past two days, we saw Bitcoin continued its correlation with Wall Street. After reaching a 2-month low at $7600, and finding support upon the historic trend-line, Bitcoin recovered to $8150, however, just like the Wall Street futures, BTC price lost momentum and now trading roughly around $7800 – $7900.
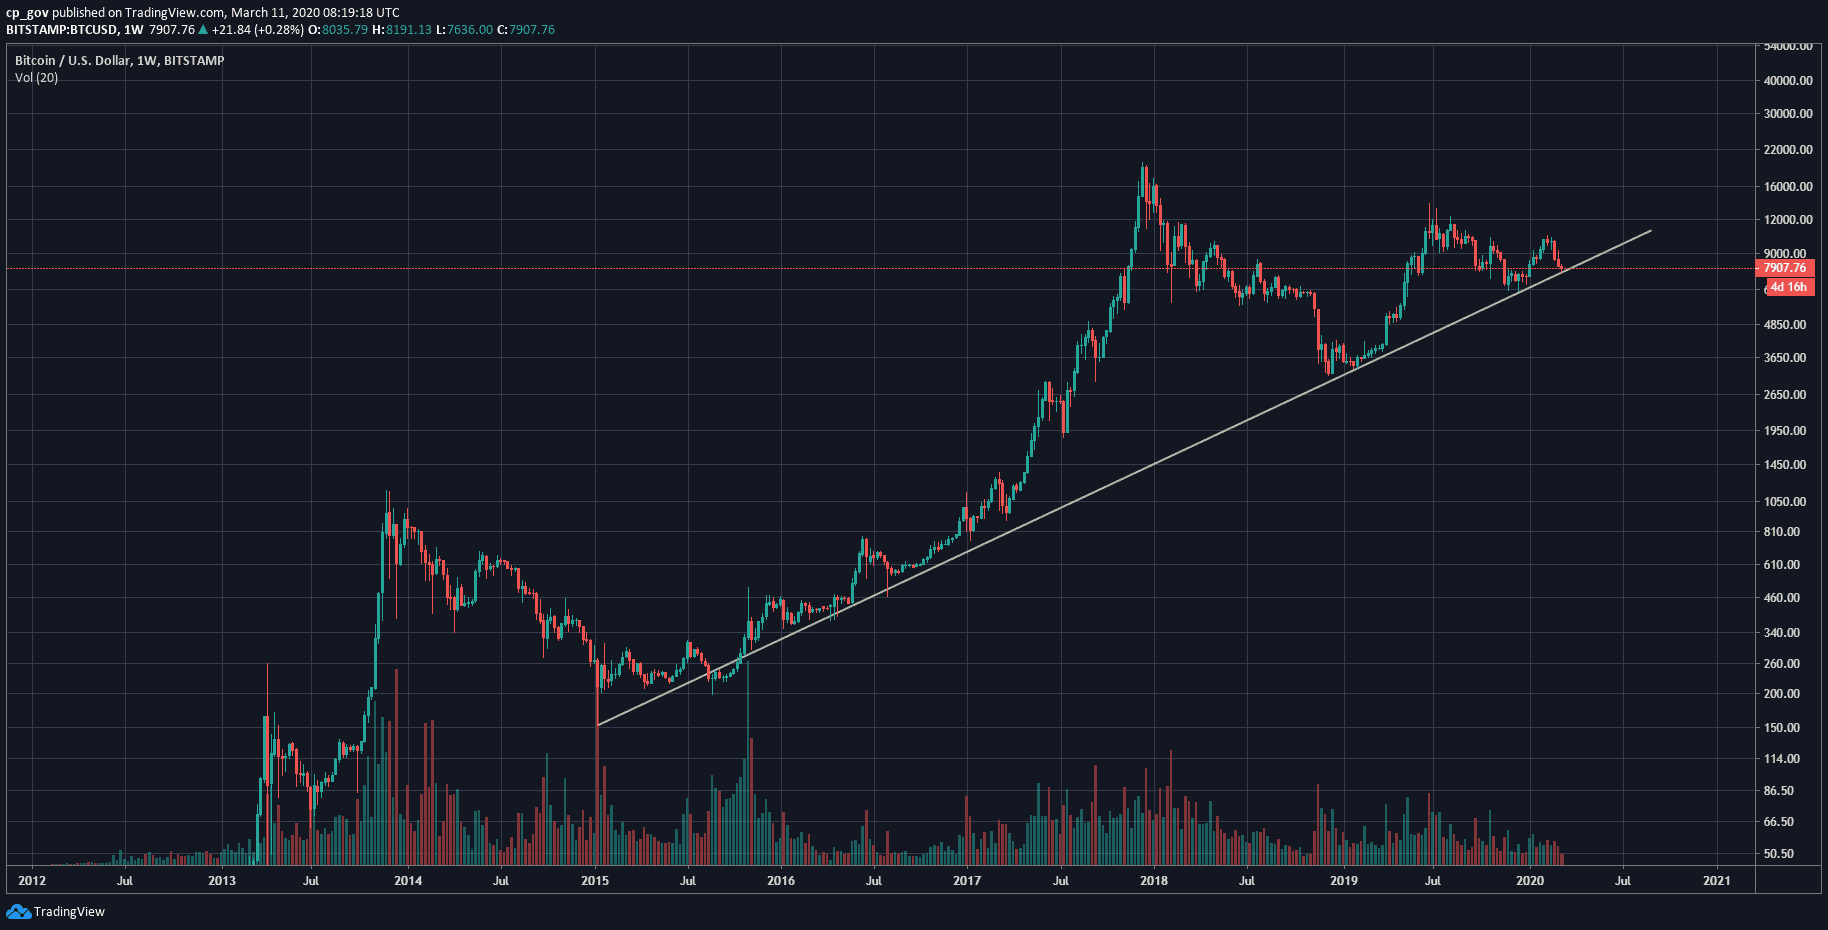
In the bigger picture, Bitcoin touched the historic ascending trend-line two days ago, as can be seen on the following weekly chart. This historic trend line was started forming in January 2015, when Bitcoin found the 2014 bear market’s bottom at $152 (Bitstamp).
The coronavirus had created a new financial situation that led Wall Street to its worst day since the Sub-Prime real estate crisis in 2008.
No one thinks that this is the end of the volatility, as the global markets continue to see extreme moves. Yesterday Wall Street produced a green correction of 4%, while today’s trading is expected to open lower, as the futures pointing on a 2% decrease (as of now).
What is the relation? These days, Bitcoin is encountering its first major global financial crisis. During such times, most people tend to sell-off and hedge to cash.
Yes, Satoshi did plan to see Bitcoin as a safe-haven asset just like Gold, but so far, the past 2-3 weeks of trading proved something else, as the price of Bitcoin followed Wall Street and the global markets.
The 2015 Trend-Line
For the rest of this week, Bitcoin will have to ‘deal’ with the historical trend line and especially the crucial support around $7600, which is this week’s current low. A weekly close below $7600 is likely to send Bitcoin to new lows.
So far, we can see that the support holds firmly, but anything can change quickly, and as we already noticed, it also relies on external forces like Wall Street.
Total Market Cap: $225 billion
Bitcoin Market Cap: $144.2 billion
BTC Dominance Index: 64.1%
*Data by CoinGecko
Key Levels To Watch & Next Possible Targets
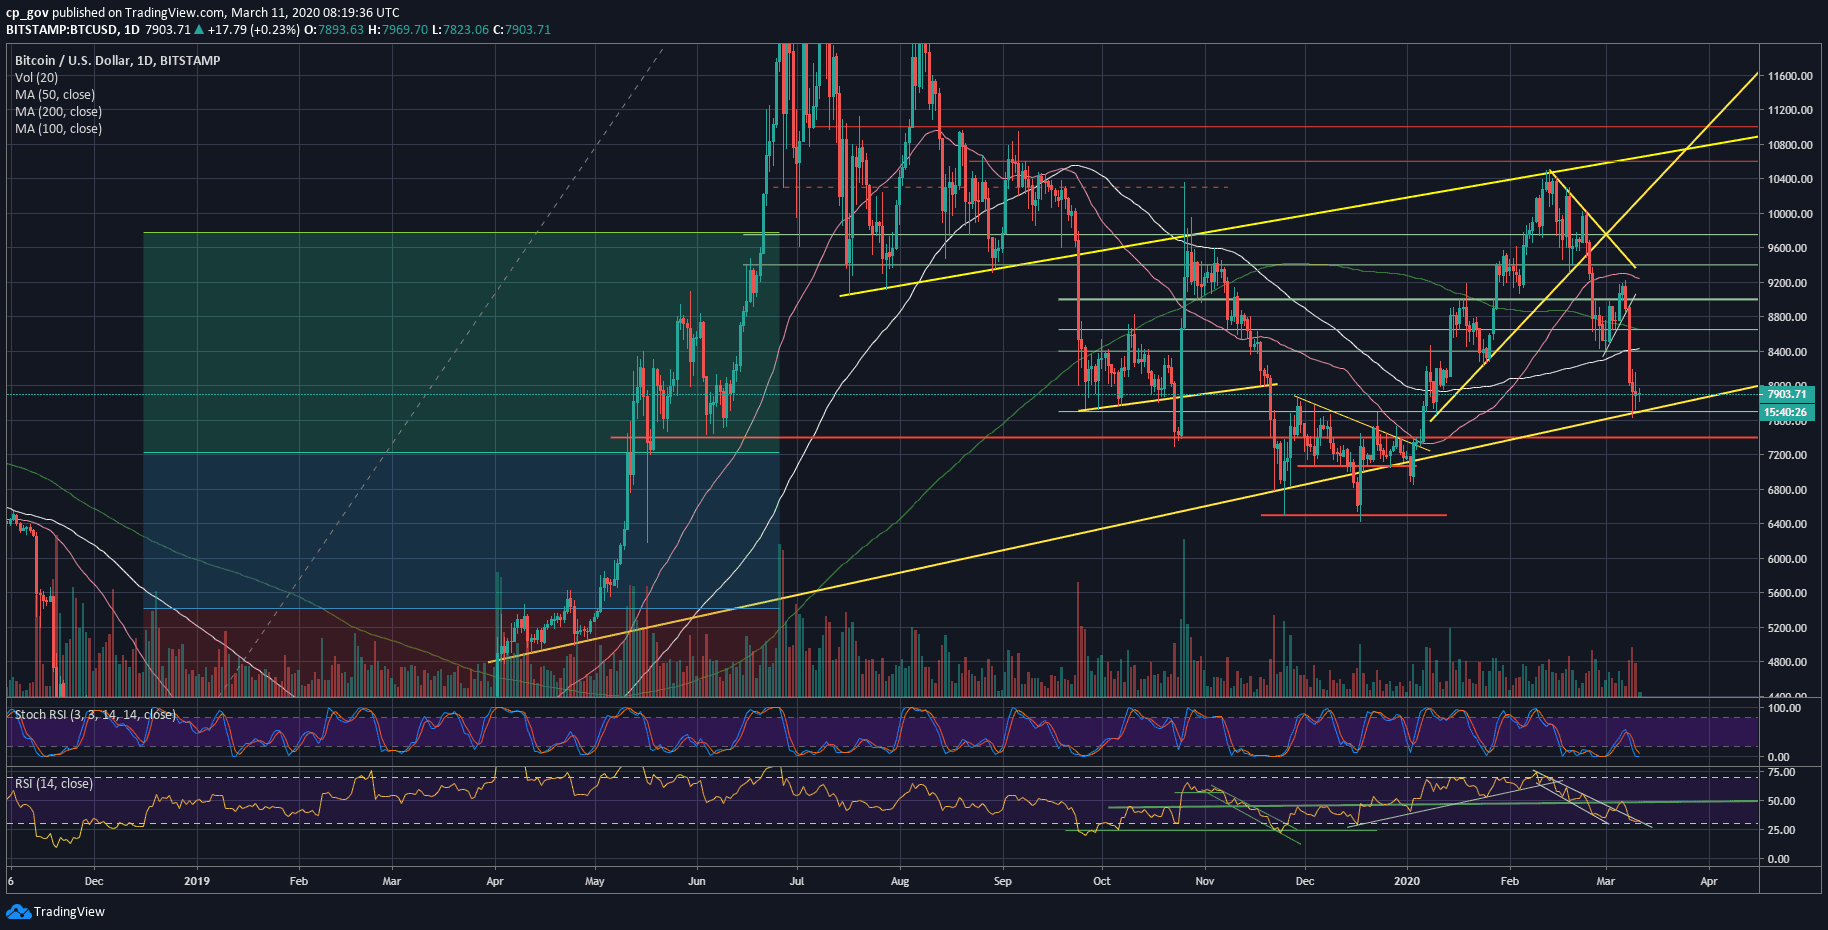
– Support/Resistance levels: In case that Bitcoin maintains the crucial level of $7600, then the first resistance will be the $8000 benchmark, followed by $8150, which is the low from yesterday. Further above lies $8300 and $8500.
From below, the first level of support is $7700, before the critical $7600. In case of a break-down, we can expect Bitcoin to reach $7400, which is weak support, and $7200 which is the Golden Fibonacci retracement level following the June 2019 bull-run.
Below lies and $7000 and $6800, which is the 2020 low from January 3rd. Further below lies $6400 – $6500, which is the double bottom from November – December of 2019.
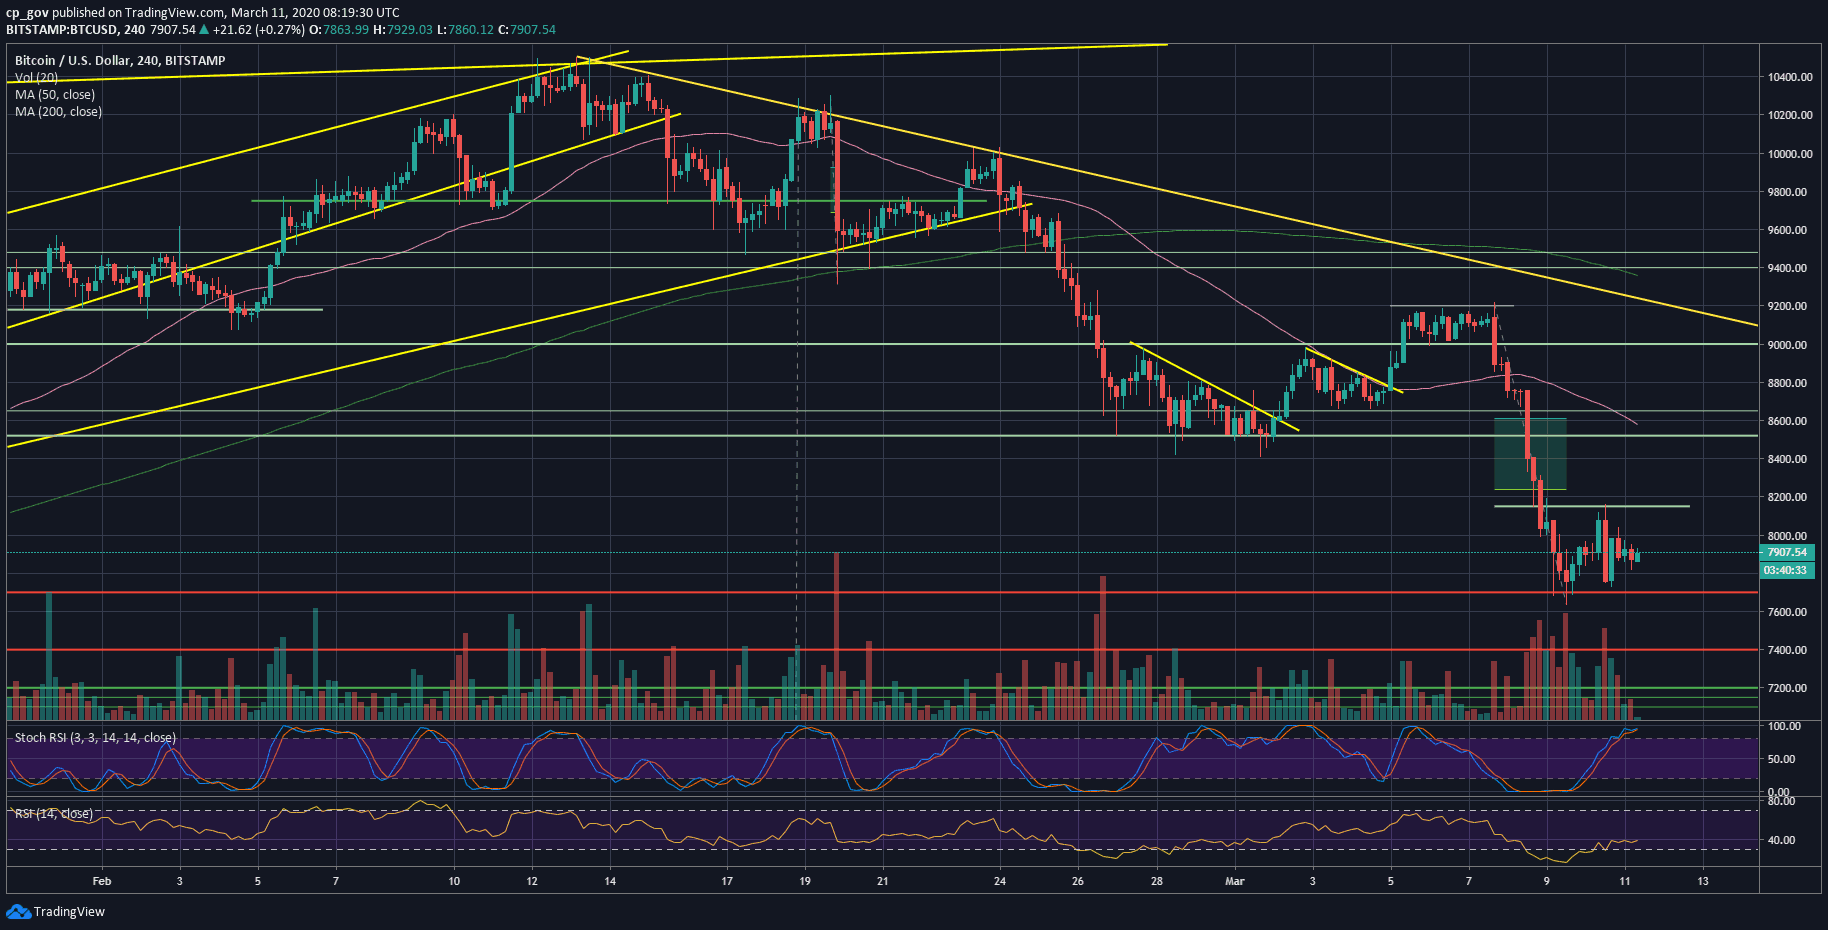
– The RSI Indicator: following a failed attempt to break above the critical 50 RSI level, the indicator broke down violently. As of writing these lines, the RSI is trying to maintain above the 30-support level, along with the marked wedge as resistance.
– Trading volume: The volume levels are increasing in the past days. Monday’s drop volume marked the highest volume day in 2020.
BTC/USD BitStamp 4-Hour Chart
BTC/USD BitStamp 1-Day Chart