After losing support above the ,000 price benchmark, Bitcoin was trading steadily around the 00 throughout the long weekend – including Good Friday, which took place last Friday.On our most recent BTC analysis from yesterday, we had stated that a price movement is imminent once the new week starts following the futures on Wall Street. Shortly after, Bitcoin initiated a decent move to retest the significant support at 00, together with the 50-days moving average line (marked pink on the following daily chart).The rejection turned to be a fake-out, and Bitcoin quickly plunged 0, marking 40 (Bitstamp) as the current daily low. This is the lowest price Bitcoin saw since the first day of April, 12 days ago.Besides, Bitcoin losses the key support of 00 and about to breakdown
Topics:
Yuval Gov considers the following as important: Bitcoin (BTC) Price, BTC Analysis, btcusd
This could be interesting, too:
Chayanika Deka writes XRP, SOL, and ADA Inclusion in US Crypto Reserve Pushes Traders on Edge
Chayanika Deka writes Why Arthur Hayes Is Bullish on Bitcoin Under Trump’s Economic Strategy
Mandy Williams writes Why the Bitcoin Market Is Stuck—and the Key Metric That Could Change It: CryptoQuant CEO
Wayne Jones writes Metaplanet Acquires 156 BTC, Bringing Total Holdings to 2,391
After losing support above the $7,000 price benchmark, Bitcoin was trading steadily around the $6800 throughout the long weekend – including Good Friday, which took place last Friday.
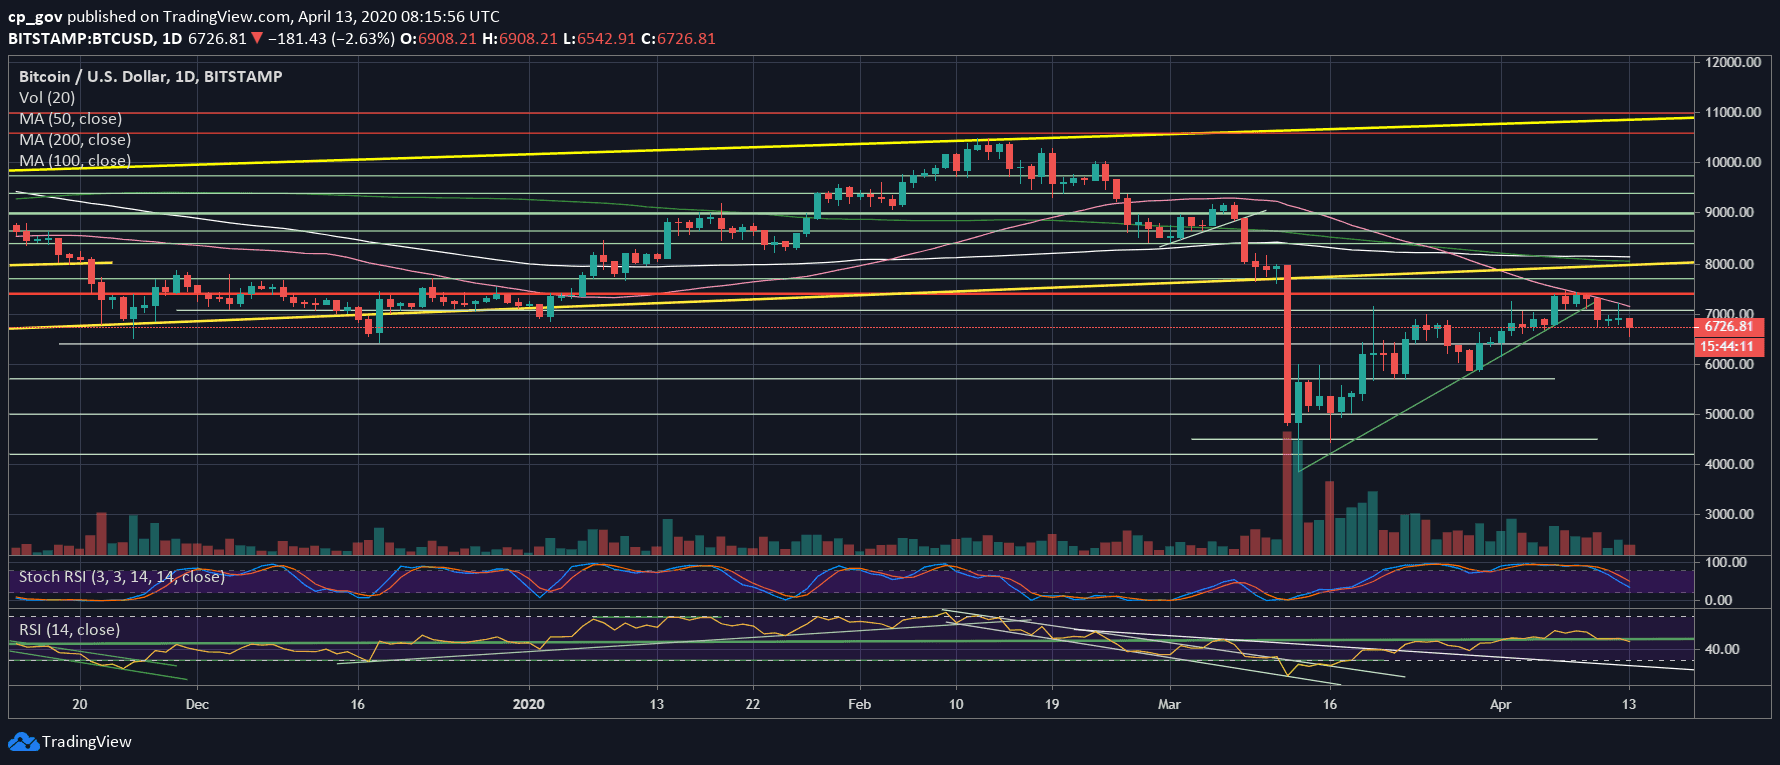
On our most recent BTC analysis from yesterday, we had stated that a price movement is imminent once the new week starts following the futures on Wall Street. Shortly after, Bitcoin initiated a decent move to retest the significant support at $7200, together with the 50-days moving average line (marked pink on the following daily chart).
The rejection turned to be a fake-out, and Bitcoin quickly plunged $650, marking $6540 (Bitstamp) as the current daily low. This is the lowest price Bitcoin saw since the first day of April, 12 days ago.
Besides, Bitcoin losses the key support of $6800 and about to breakdown from the crucial 50 RSI area. Looking at the Stochastic RSI oscillator, as we mentioned yesterday, the momentum indicator is pointing down, while there is even more room to go down.
Bitcoin bulls would hope to see a daily close above the $6800 level; however, as it seems now, the chances for that are low. Maybe if there will be a greenish day at Wall Street, as we know, the recent weeks’ correlation between BTC and the markets is almost identical.
Total Market Cap: $191.4 billion
Bitcoin Market Cap: $122.8 billion
BTC Dominance Index: 64.1%
*Data by CoinGecko
Key Levels To Watch & Next Possible Targets
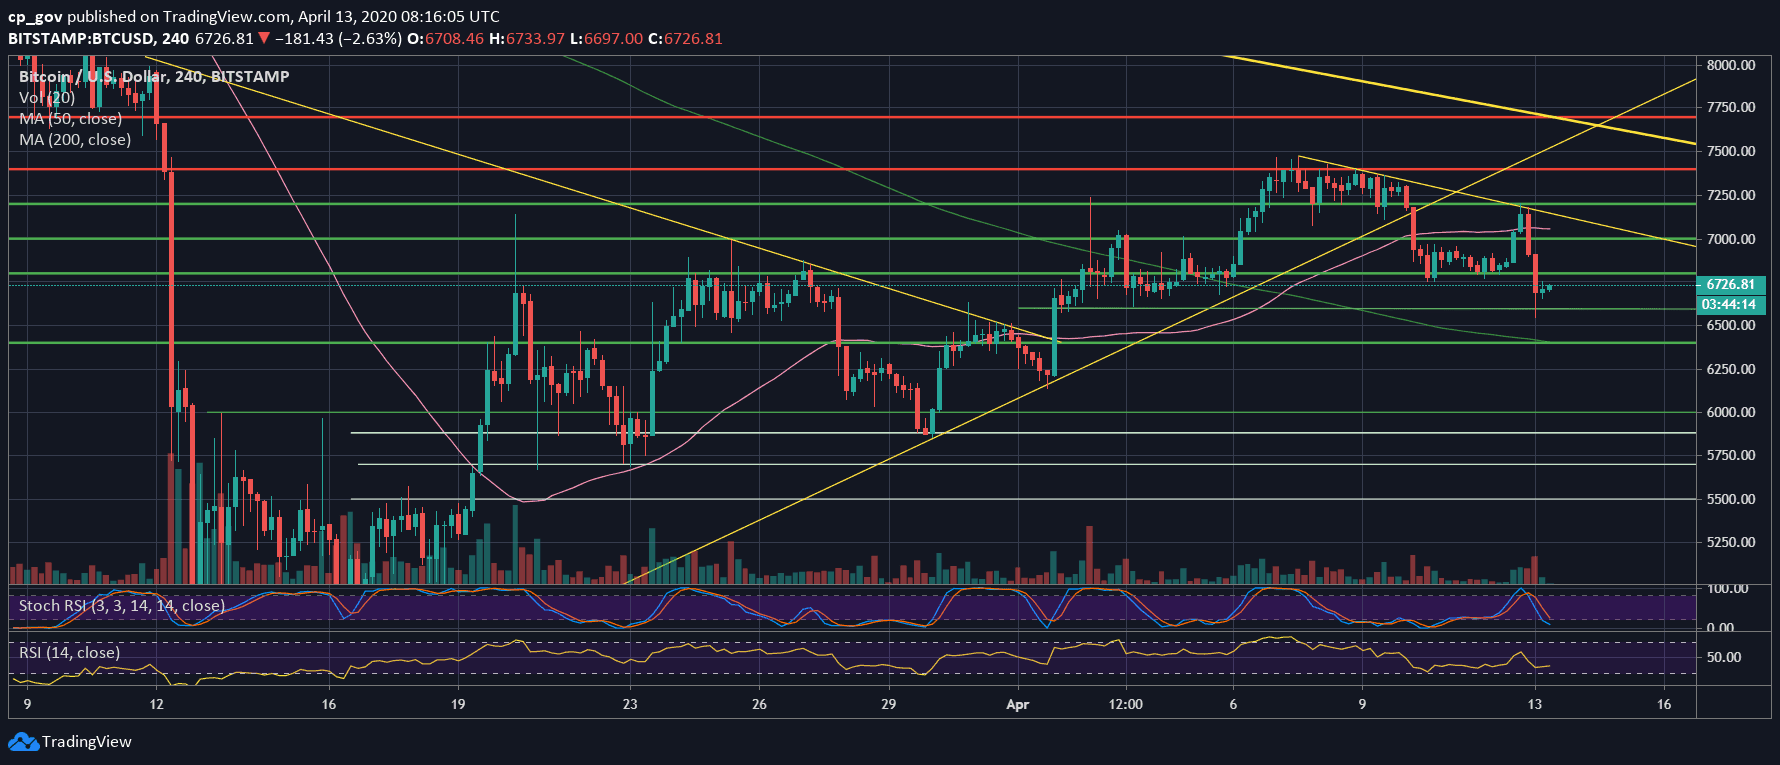
– Support/Resistance levels: After breaking down from the $6800 level, this becomes the first level of resistance. In case Bitcoin can break above, then the next target would be the $7000, along with the MA-50 (currently around $7050). Further above lies $7200.
From below, Bitcoin found support around the $6550 – $6600 level. Was it only temp support? Could be. Bitcoin might visit $6400 in the case of a breakdown, and even further down at $6000 – $62000 zone as its next destination.
– The RSI Indicator: discussed above.
– Trading volume: Despite the recent price action, and probably due to the weekend, the volume was not very significant. It will be interesting to see how Monday’s candle closes by means of volume.
BTC/USD BitStamp 4-Hour Chart
BTC/USD BitStamp 1-Day Chart