After reaching over 00 a few days ago, the Bitcoin price corrected down to the Golden Fibonacci level at 00, and since then, BTC is trading mostly around the 00 price range.As can be seen on the following 4-hour chart, there is a lower highs trajectory on the short-term timeframe, getting closer to the crucial 00 support, which is the low from Thursday, the correction after the huge Wednesday’s rally.The Weekly Timeframe Since 2015This is an excellent opportunity to look at the long-term ascending trend-line on the weekly chart, which started forming in January 2015, by the famous capitulation candle that signaled the end of the 2014 bear market.As can be seen below, Bitcoin recently broke down this line on the horror March 12 crash. The breakdown was so violent, resulting in
Topics:
Yuval Gov considers the following as important: Bitcoin (BTC) Price, BTC Analysis, btcusd, btcusdt
This could be interesting, too:
Chayanika Deka writes XRP, SOL, and ADA Inclusion in US Crypto Reserve Pushes Traders on Edge
Chayanika Deka writes Why Arthur Hayes Is Bullish on Bitcoin Under Trump’s Economic Strategy
Mandy Williams writes Why the Bitcoin Market Is Stuck—and the Key Metric That Could Change It: CryptoQuant CEO
Wayne Jones writes Metaplanet Acquires 156 BTC, Bringing Total Holdings to 2,391
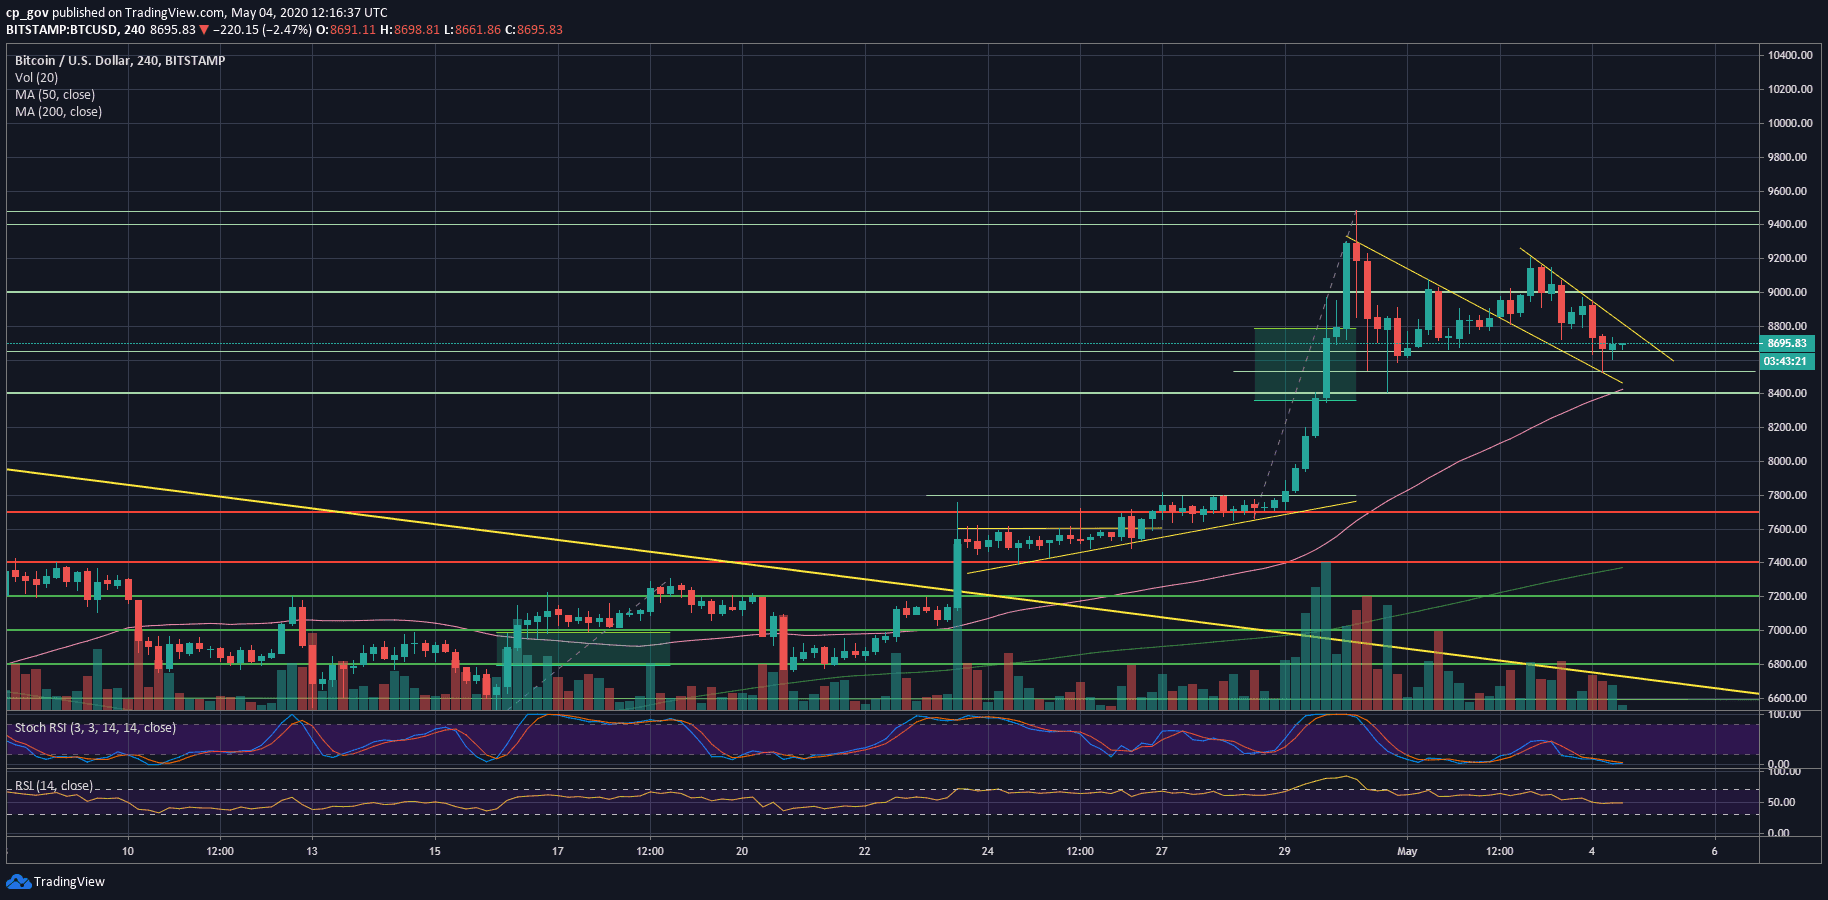
After reaching over $9400 a few days ago, the Bitcoin price corrected down to the Golden Fibonacci level at $8400, and since then, BTC is trading mostly around the $8600 price range.
As can be seen on the following 4-hour chart, there is a lower highs trajectory on the short-term timeframe, getting closer to the crucial $8400 support, which is the low from Thursday, the correction after the huge Wednesday’s rally.
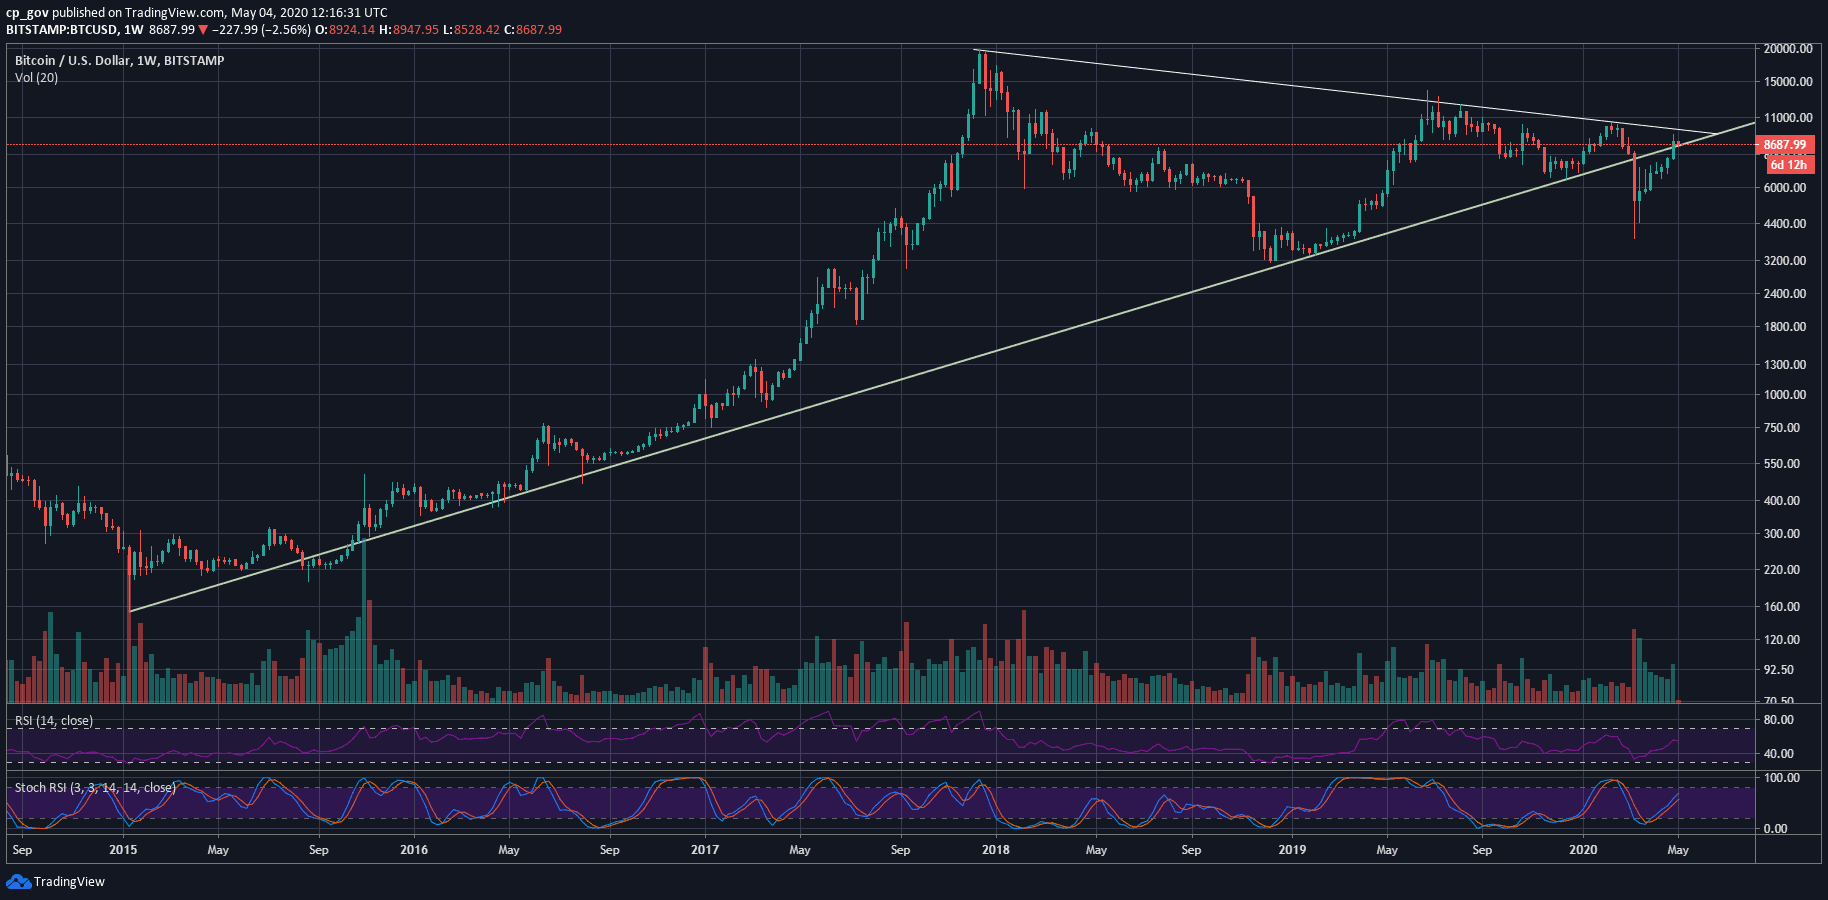
The Weekly Timeframe Since 2015
This is an excellent opportunity to look at the long-term ascending trend-line on the weekly chart, which started forming in January 2015, by the famous capitulation candle that signaled the end of the 2014 bear market.
As can be seen below, Bitcoin recently broke down this line on the horror March 12 crash. The breakdown was so violent, resulting in over a daily 50% price loss.
Since then, we saw the continuous recovery and a breakup of the line as of the past Wednesday, at around $8400. Yes, the same $8400, which was the mentioned above Thursday low.
On the bigger timeframe, Bitcoin must maintain the weekly trend-line at around $8400 (weekly close), and in any case, not to produce a full candle body below the trend line. For the lower timeframe’s support and resistance levels – keep on reading.
Total Market Cap: $242 billion
Bitcoin Market Cap: $160.2 billion
BTC Dominance Index: 66.0%
*Data by CoinGecko
Key Levels To Watch & Next Possible Targets
– Support/Resistance levels: Back to the lower timeframes of the daily and the 4-hour chart. Looking at the 4-hour chart, Bitcoin is locked between two descending trend-lines.
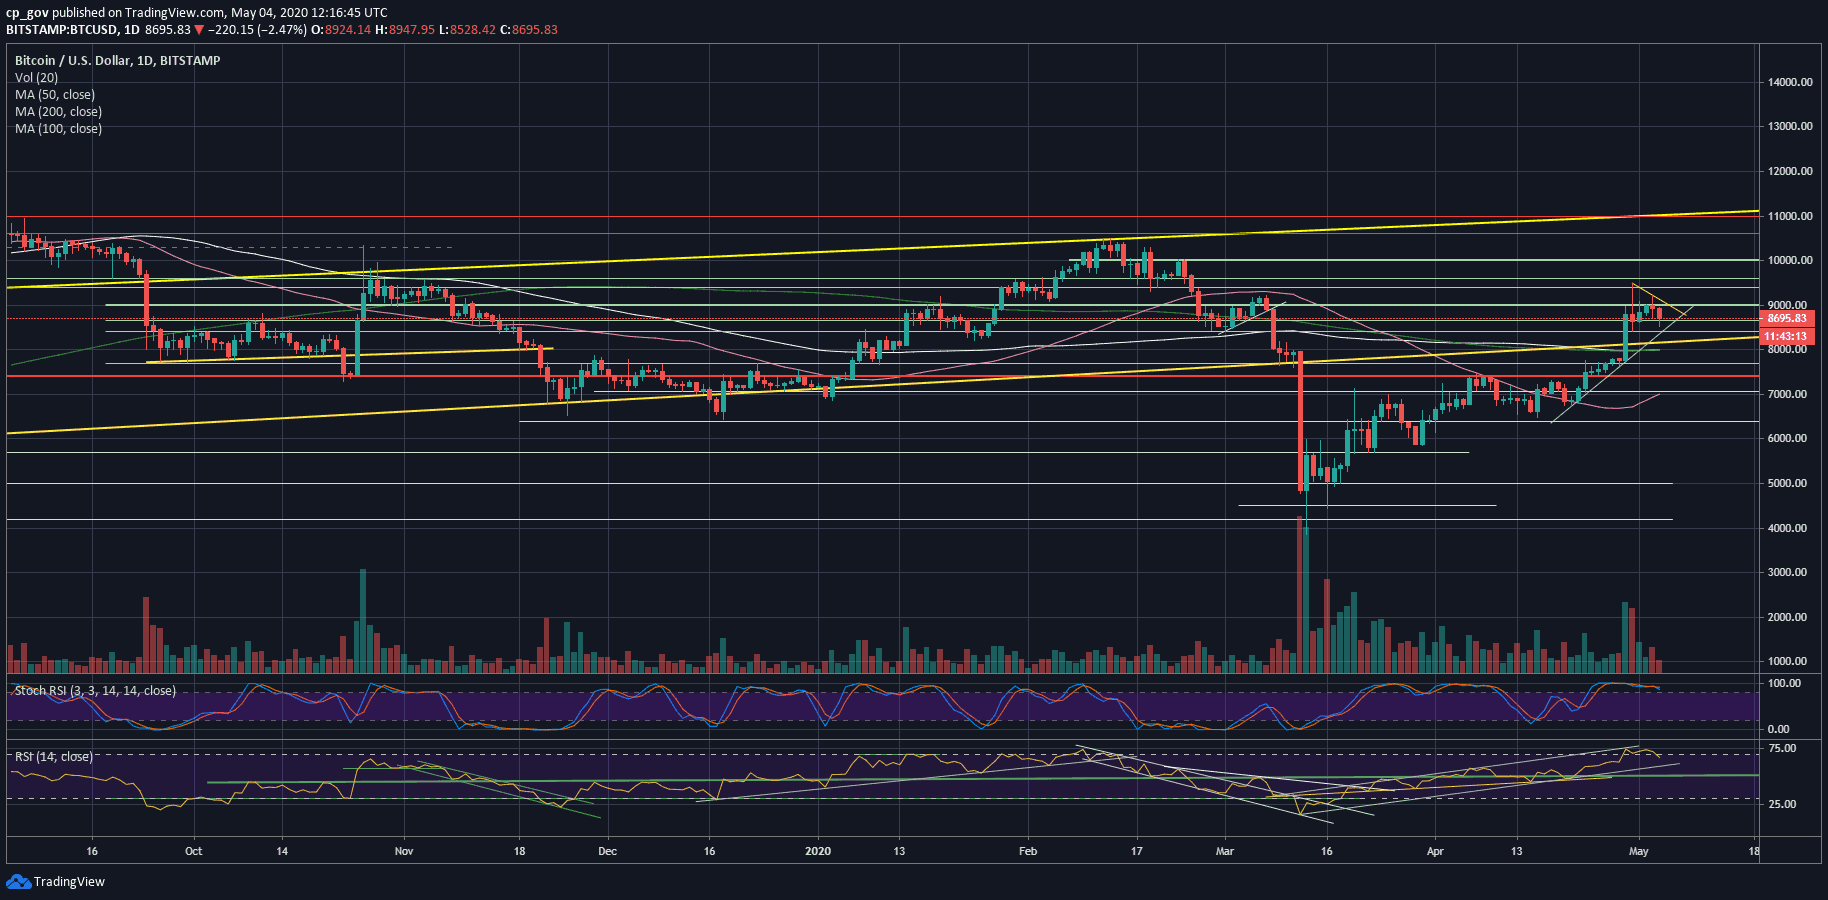
The first level of support lies at today’s low of $8530 (the lower line). Down below lies the $8400 crucial support line. Further below lies $8200 (weak support) and $8000, which contains both the 200 and the 100 days moving average lines.
From above, the first level of resistance now lies at $8800, along with the upper descending trend-line. Further above lies $9000, followed by $9200 and $9400 – $9500 (the April high).
On the bigger timeframe, a long-term weekly trend-line resistance lies around $9800 – $10,000. This is the most important price area for the Bitcoin bulls’ short-term.
– The RSI Indicator: Together with the price drop, the momentum indicator is also losing momentum towards the 66 level, where lies the nearest support. This level, along with 60, will be critical for the short-term.
– Trading volume: As expected, after Wednesday and Thursday breaking-records volume days, the weekend saw average levels of volume, in anticipation of the next big move.
BTC/USD BitStamp 4-Hour Chart
BTC/USD BitStamp 1-Day Chart