A senior analyst at RoboForex shares his insights into the future scenarios for Bitcoin, Ethereum, Litecoin, XRP and Bitcoin Cash price movement.Dmitriy Gurkovskiy, a senior analyst at foreign exchange broker RoboForex, provides his vision of the possible tendencies in price changes for Bitcoin as well as for other major cryptos.Bears continue pushing prices of assets to the downside as they broke the closest support levels again. In the daily chart of Bitcoin, a good level to rebound upwards from is 35. However, if bears break this level as well, the instrument may test the closest local low at 95.Within the given scenario, it’s interesting to watch Ethereum and Litecoin, because they have better chances to rebound upwards. Still, bulls must push prices a bit higher so that they
Topics:
Dmitriy Gurkovskiy considers the following as important: bch, bchusd, Bitcoin Cash, BTC, btcusd, crypto, crypto analysis, crypto price, crypto price analysis, ETH, ethusd, Guest Posts, LTC, ltcusd, News, Reports, roboforex, XRP, xrpusd
This could be interesting, too:
Christian Mäder writes Bitcoin-Transaktionsgebühren auf historischem Tief: Warum jetzt der beste Zeitpunkt für günstige Überweisungen ist
Bitcoin Schweiz News writes Litecoin jetzt in der Telegram-Wallet verfügbar!
Christian Mäder writes Das Bitcoin-Reserve-Rennen der US-Bundesstaaten: Wer gewinnt das Krypto-Wettrüsten?
Bitcoin Schweiz News writes BlackRock bringt Bitcoin-ETP nach Europa – Was bedeutet das für den Kryptomarkt?
A senior analyst at RoboForex shares his insights into the future scenarios for Bitcoin, Ethereum, Litecoin, XRP and Bitcoin Cash price movement.
Dmitriy Gurkovskiy, a senior analyst at foreign exchange broker RoboForex, provides his vision of the possible tendencies in price changes for Bitcoin as well as for other major cryptos.
Bears continue pushing prices of assets to the downside as they broke the closest support levels again. In the daily chart of Bitcoin, a good level to rebound upwards from is $7335. However, if bears break this level as well, the instrument may test the closest local low at $6395.
Within the given scenario, it’s interesting to watch Ethereum and Litecoin, because they have better chances to rebound upwards. Still, bulls must push prices a bit higher so that they could return above key levels. But if the current support levels are broken, assets may start more significant downtrends.
We discussed earlier that a possible descending correction may provide us with new levels to open long positions. However, it will be better to look for confirmations on shorter timeframes, but they haven’t shown any signals of new growth of the cryptocurrency market so far.
Bitcoin
In the daily chart, bears managed to break another support level. As we can see, even considering the current decline, the RSI hasn’t reached the trendline yet, that’s why it’s too early to imply a reversal. Moreover, the price has broken the area between Moving Average to the downside, thus indicating a significant bearish pressure. The mid-term trading idea suggests expecting a further decline, a test of $7335, and a possible growth from this level. However, as long as the price doesn’t break the local low and fix below $6075, one can expect another rebound to the upside. A very important signal here will be a confirmation from shorter timeframes.
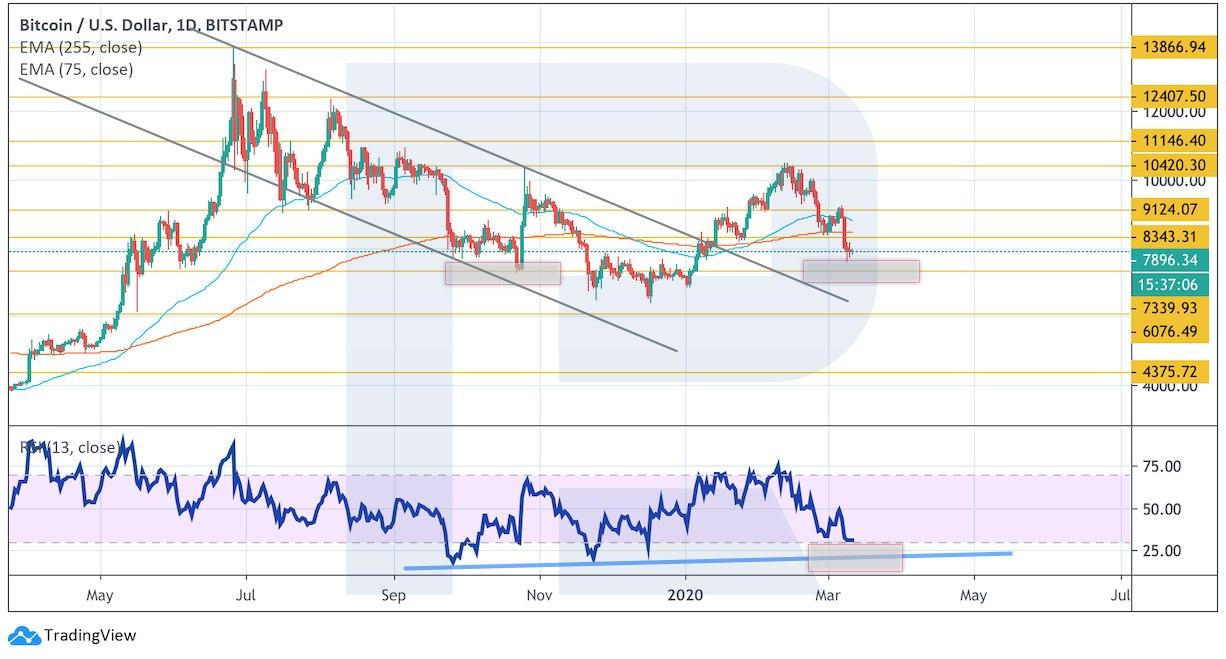
Photo: Roboforex / TradingView
As we can see in the H4 chart, the price has rebounded from Moving Averages, which indicate a mid-term bearish impulse. The RSI is also rebounding from the descending trendline. All these factors taken together confirm continued pressure from bears, that’s why the price may yet easily test the support area at $7335 in the nearest future. The rising tendency may resume only after the asset breaks the descending channel’s upside border and fixes above $8500. Meanwhile, bearish pressure remains rather strong.
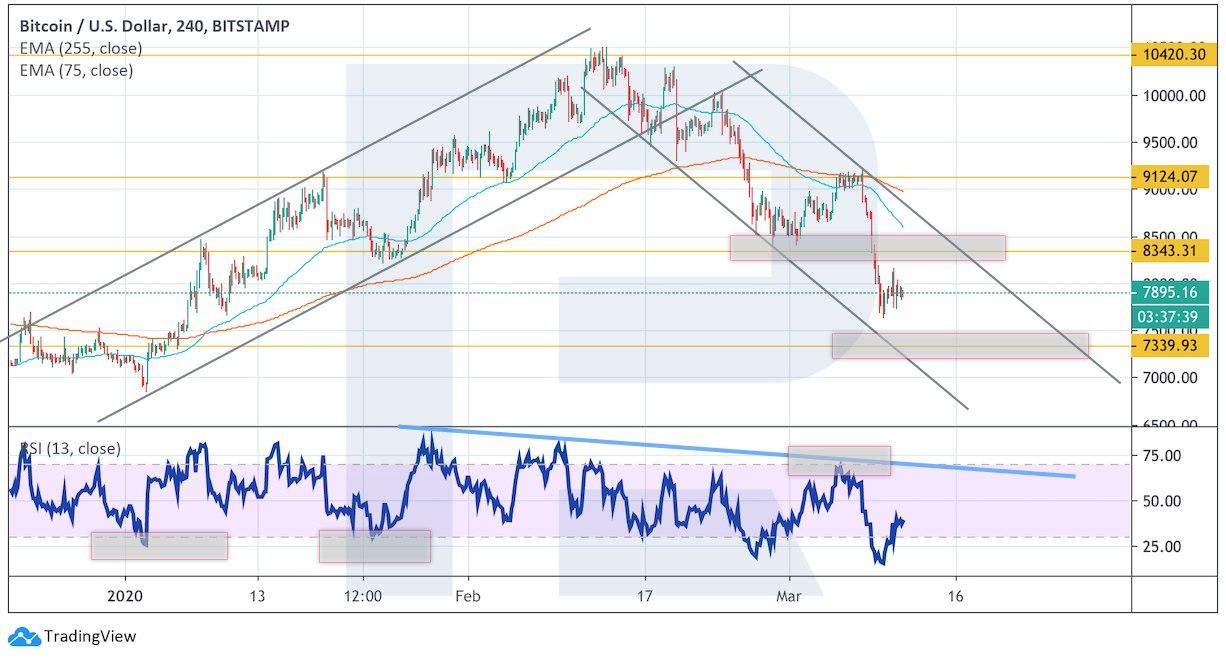
Photo: Roboforex / TradingView
Ethereum
As for Ethereum, bulls managed to keep the price between Moving Averages, which means that it may attempt to rebound from these levels to the upside. Also, here we can see an important support level close to $190. However, the RSI hasn’t dropped lower than 30 yet, so they can’t confirm the “new-growth” scenario. In addition to that, we shouldn’t exclude the possibility of a more serious test of the support area and a rebound with the first target at $240. Still, this scenario may longer be valid if the instrument breaks the channel’s downside border and fixes below $150. In this case, the downside target will be $115.
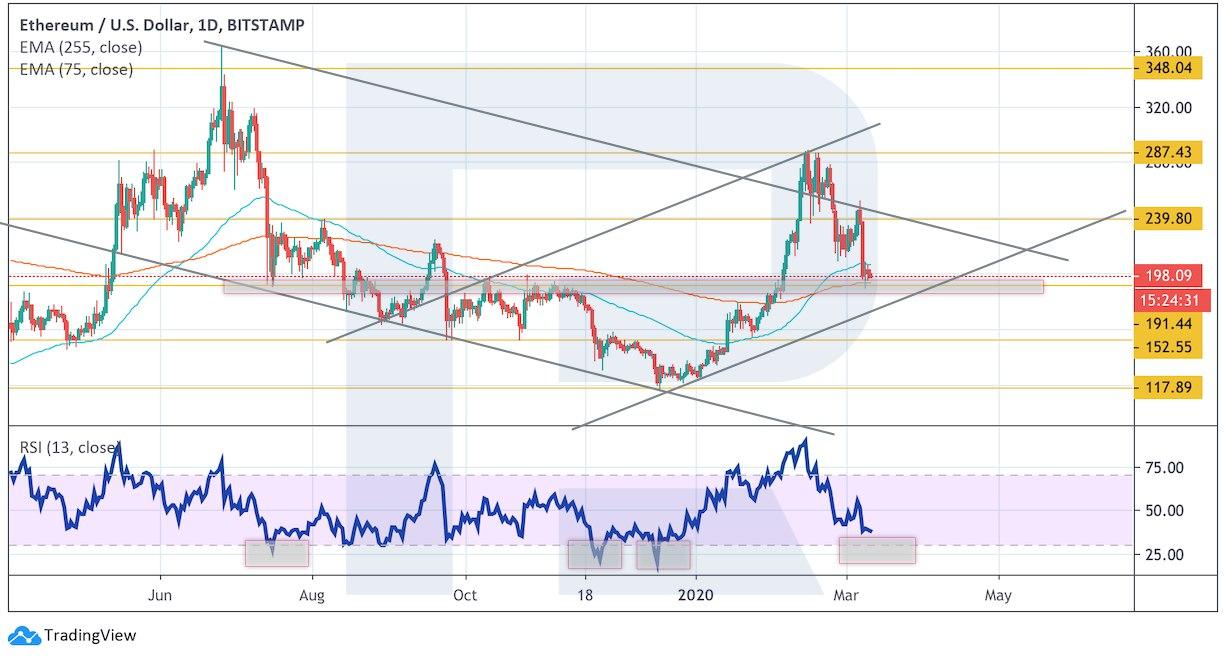
Photo: Roboforex / TradingView
On shorter timeframes, there is a high potential for the formation of a Wedge reversal pattern. However, the downside target area is still the support level between $195-180. After testing this area, the price may attempt to reverse. To confirm this scenario, the price must break the Wedge’s upside border and fix above $215. However, this scenario may be canceled if the pair breaks the pattern’s downside border. In this case, the asset may boost its decline and reach $115 very quickly.
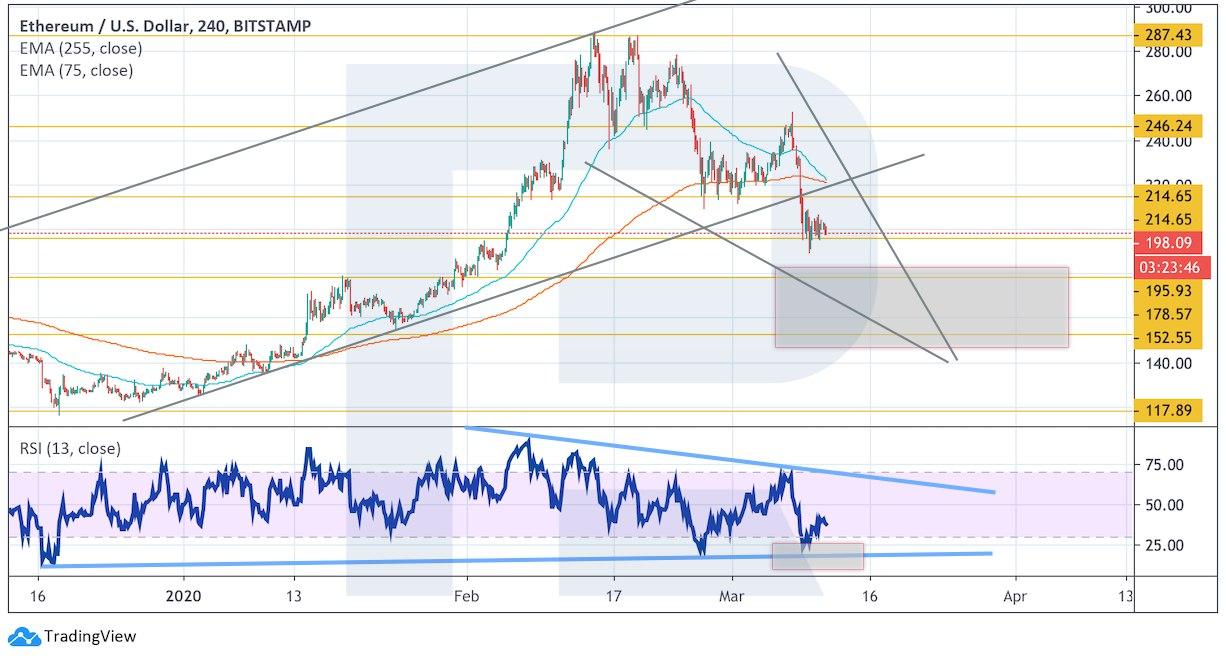
Photo: Roboforex / TradingView
Litecoin
In the daily chart, Litecoin is moving very close to the downside border of a “5-0” ascending pattern. It’s very important for bulls to put the price back inside the rising channel in the nearest future and try to recover towards $65. A good signal to confirm a rebound to the upside is a test of the support area on the price chart, but the RSI hasn’t reached the trendline yet. Another signal to confirm a new growth is a breakout of the medium line of Bollinger Bands: here we can see a breakout of the indicator’s downside border, which indicates a strong bearish pressure. If bulls fail to get back inside the channel, the downside target may be at $35.
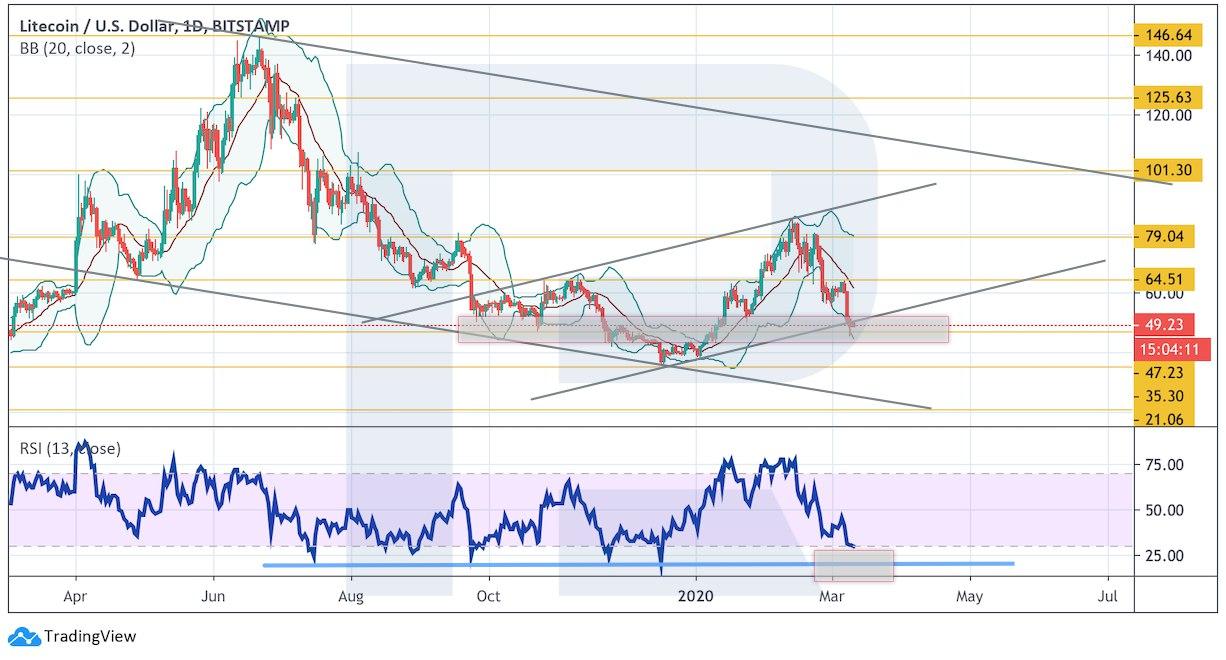
Photo: Roboforex / TradingView
As we can see in the H4 chart, the price continues falling inside the descending channel. At the moment, there is a possibility of correction towards the resistance level at $56 and further decline with the predicted target at $35. This scenario may be confirmed by a rebound from the resistance line at the RSI. However, the negative scenario may be canceled if the price breaks the descending channel’s upside border and fixes above $60. In this case, the instrument may finish the descending impulse and start a proper rising movement.
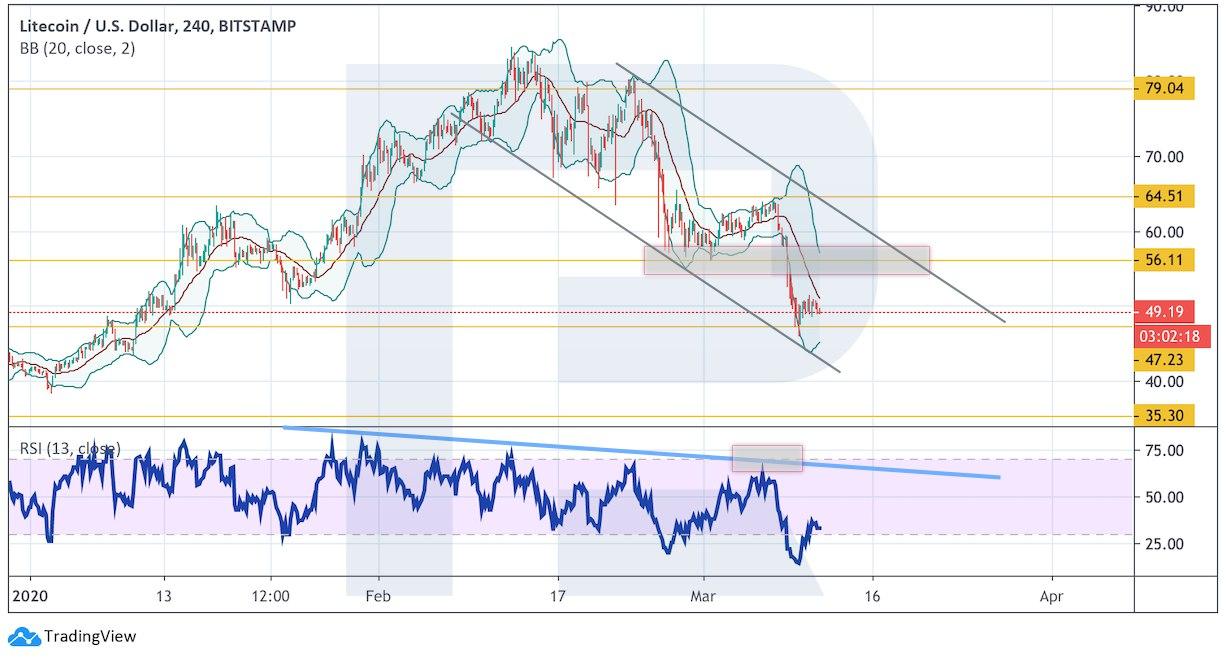
Photo: Roboforex / TradingView
XRP
In the daily chart, XRP continues falling; it is moving below Ichimoku Kinko Hyo Cloud, thus indicating a bearish tendency. Also, here we can see the rising channel’s downside border and the price may rebound upwards to test the resistance level close to $0.26. however, to resume the ascending tendency, bulls must push the price higher than $0.31. In this case, the instrument may break the channel’s upside border and try to reach $0.37.
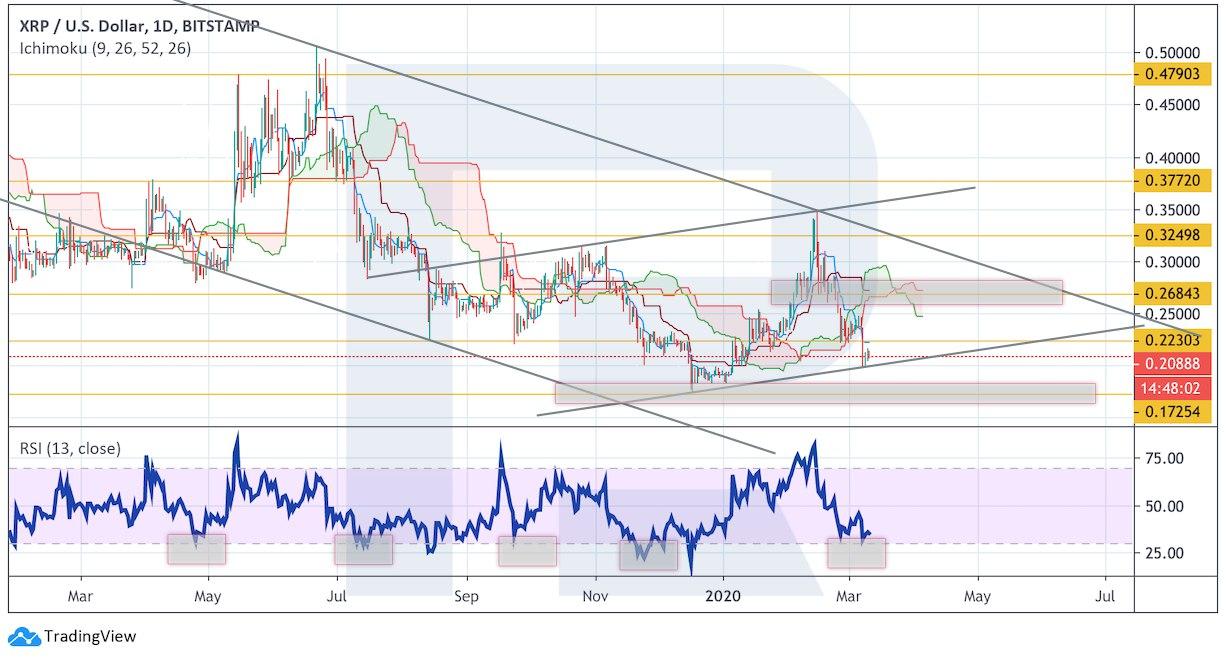
Photo: Roboforex / TradingView
As we can see in the H4 chart, XRP is also moving below the cloud but bulls have been able to stay above the support level. The short-term trading idea suggests expecting a test of the descending channel’s upside border at $0.22 and further decline with the target at $0.17. Another signal to confirm this scenario is a rebound from the resistance line at the RSI. Still, this scenario may no longer be valid if the instrument breaks the cloud’s upside border and fixes above $0.24. in this case, the asset may break the descending channel and continue trading upwards.
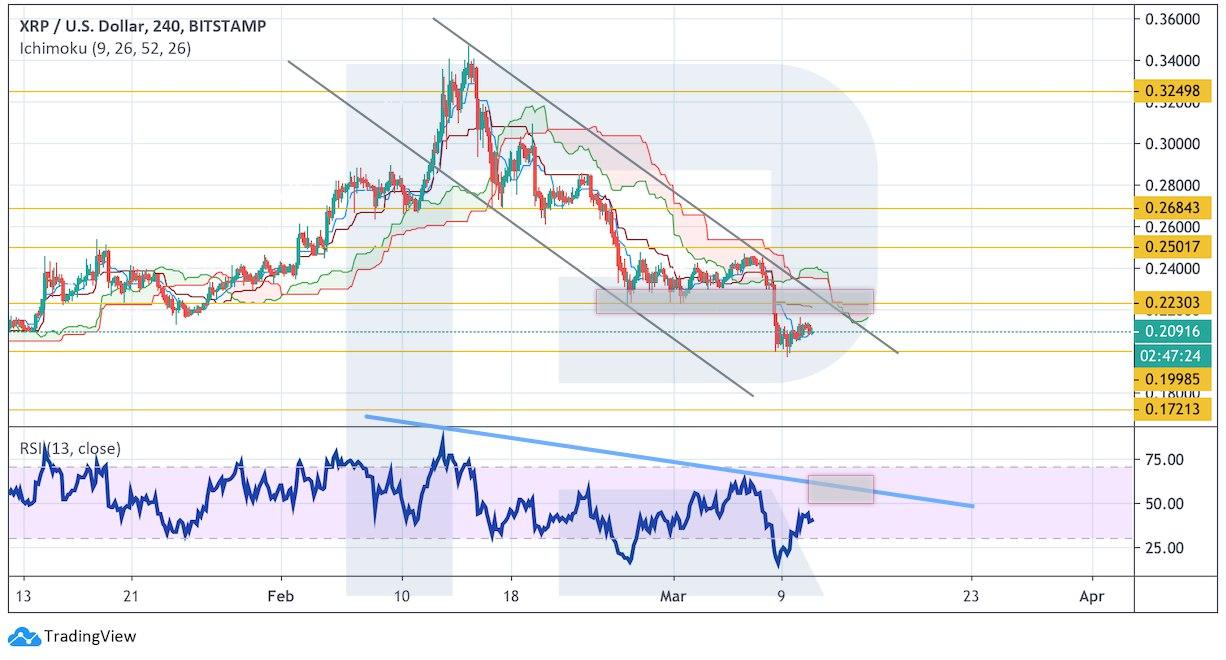
Photo: Roboforex / TradingView
Bitcoin Cash
Bears continue putting pressure on the asset; they have broken another support area and almost reached the rising channel’s downside border. The RSI also hasn’t reached the support level yet, that’s why we may expect further decline towards $230, a rebound from this level, and new growth. Still, this scenario may no longer be valid if the price breaks the channel’s downside border and fixes below $160.
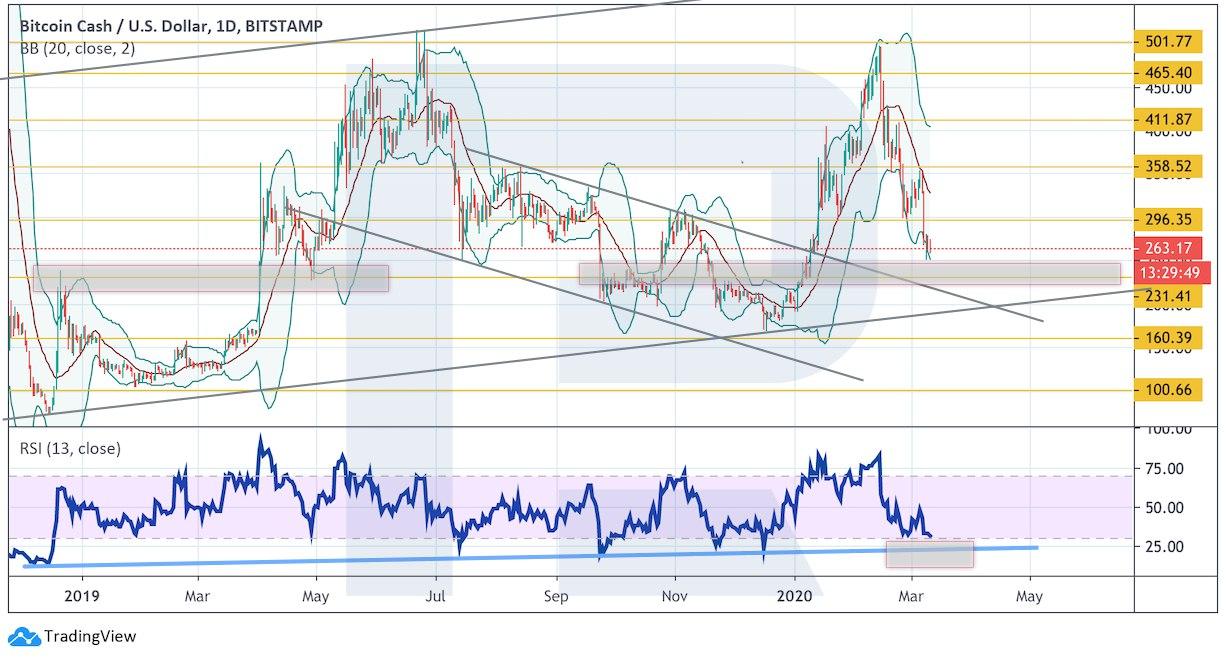
Photo: Roboforex / TradingView
In the H4 chart, the price is also falling inside the descending channel. The mid-term trading idea suggests expecting an ascending correction and a test of the resistance level close to $295. After that, the instrument may resume falling with the predicted target at $160. A test of the resistance at the RSI will confirm this scenario. However, this scenario will be canceled if the price skyrockets to break the channel’s upside border and fixes above $325.
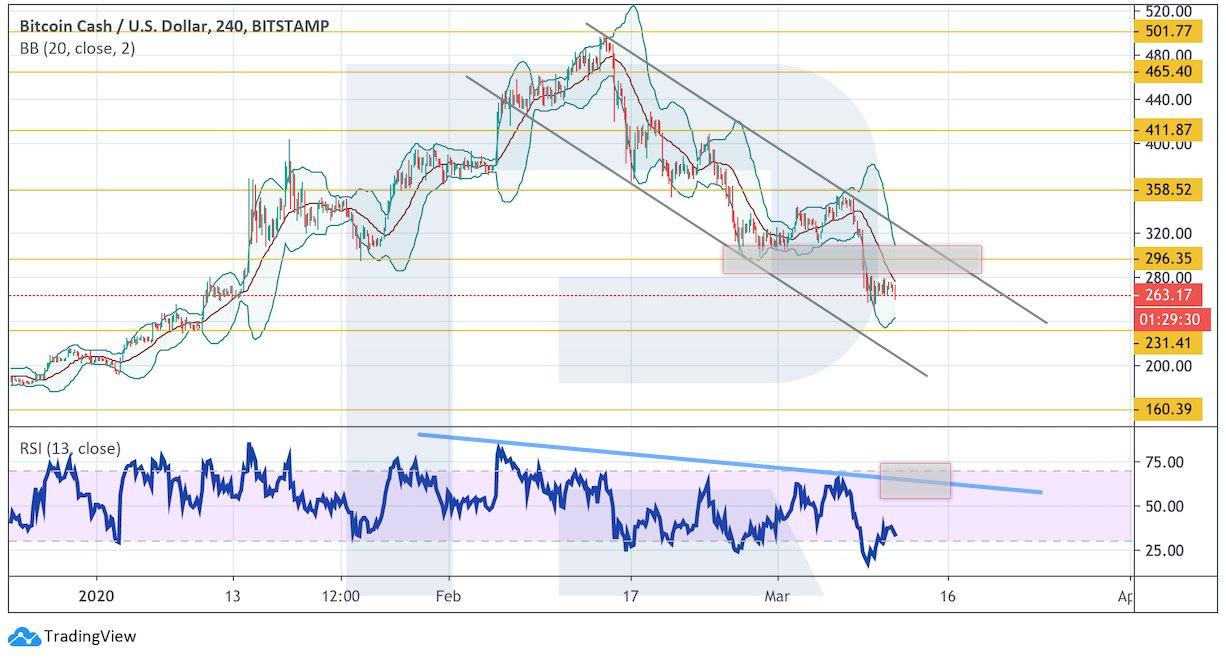
Photo: Roboforex / TradingView
Disclaimer: Any predictions contained herein are based on the authors' particular opinion. This analysis shall not be treated as trading advice. RoboForex shall not be held liable for the results of the trades arising from relying upon trading recommendations and reviews contained herein.

Dmitriy Gurkovskiy is a senior analyst at RoboForex, an award-winning European online foreign exchange forex broker.