Despite a promising start to the week, the bullish Bitcoin traders have struggled to maintain momentum. In the last few hours, bears have successfully overcome the intra-week support (white line), which was helping to keep BTC in an uptrend, and are now threatening to drive prices back towards the 0.5 Fibonacci level at ,150. Looking at the 4-hour chart, we can see that the decline was foreshadowed by a significant divergence between the RSI and the price action (yellow lines), which shows the uptrend was weak and likely to flip bearish. On the global crypto market capital chart by Coinmarketcap, we can also see that the amount of money flowing into the industry has started to dwindle, which typically forecasts more downside to come. Global crypto market capital chart
Topics:
Ollie Leech considers the following as important: Bitcoin (BTC) Price, BTC Analysis, BTCEUR, BTCGBP, btcusd, btcusdt
This could be interesting, too:
Chayanika Deka writes XRP, SOL, and ADA Inclusion in US Crypto Reserve Pushes Traders on Edge
Chayanika Deka writes Why Arthur Hayes Is Bullish on Bitcoin Under Trump’s Economic Strategy
Mandy Williams writes Why the Bitcoin Market Is Stuck—and the Key Metric That Could Change It: CryptoQuant CEO
Wayne Jones writes Metaplanet Acquires 156 BTC, Bringing Total Holdings to 2,391
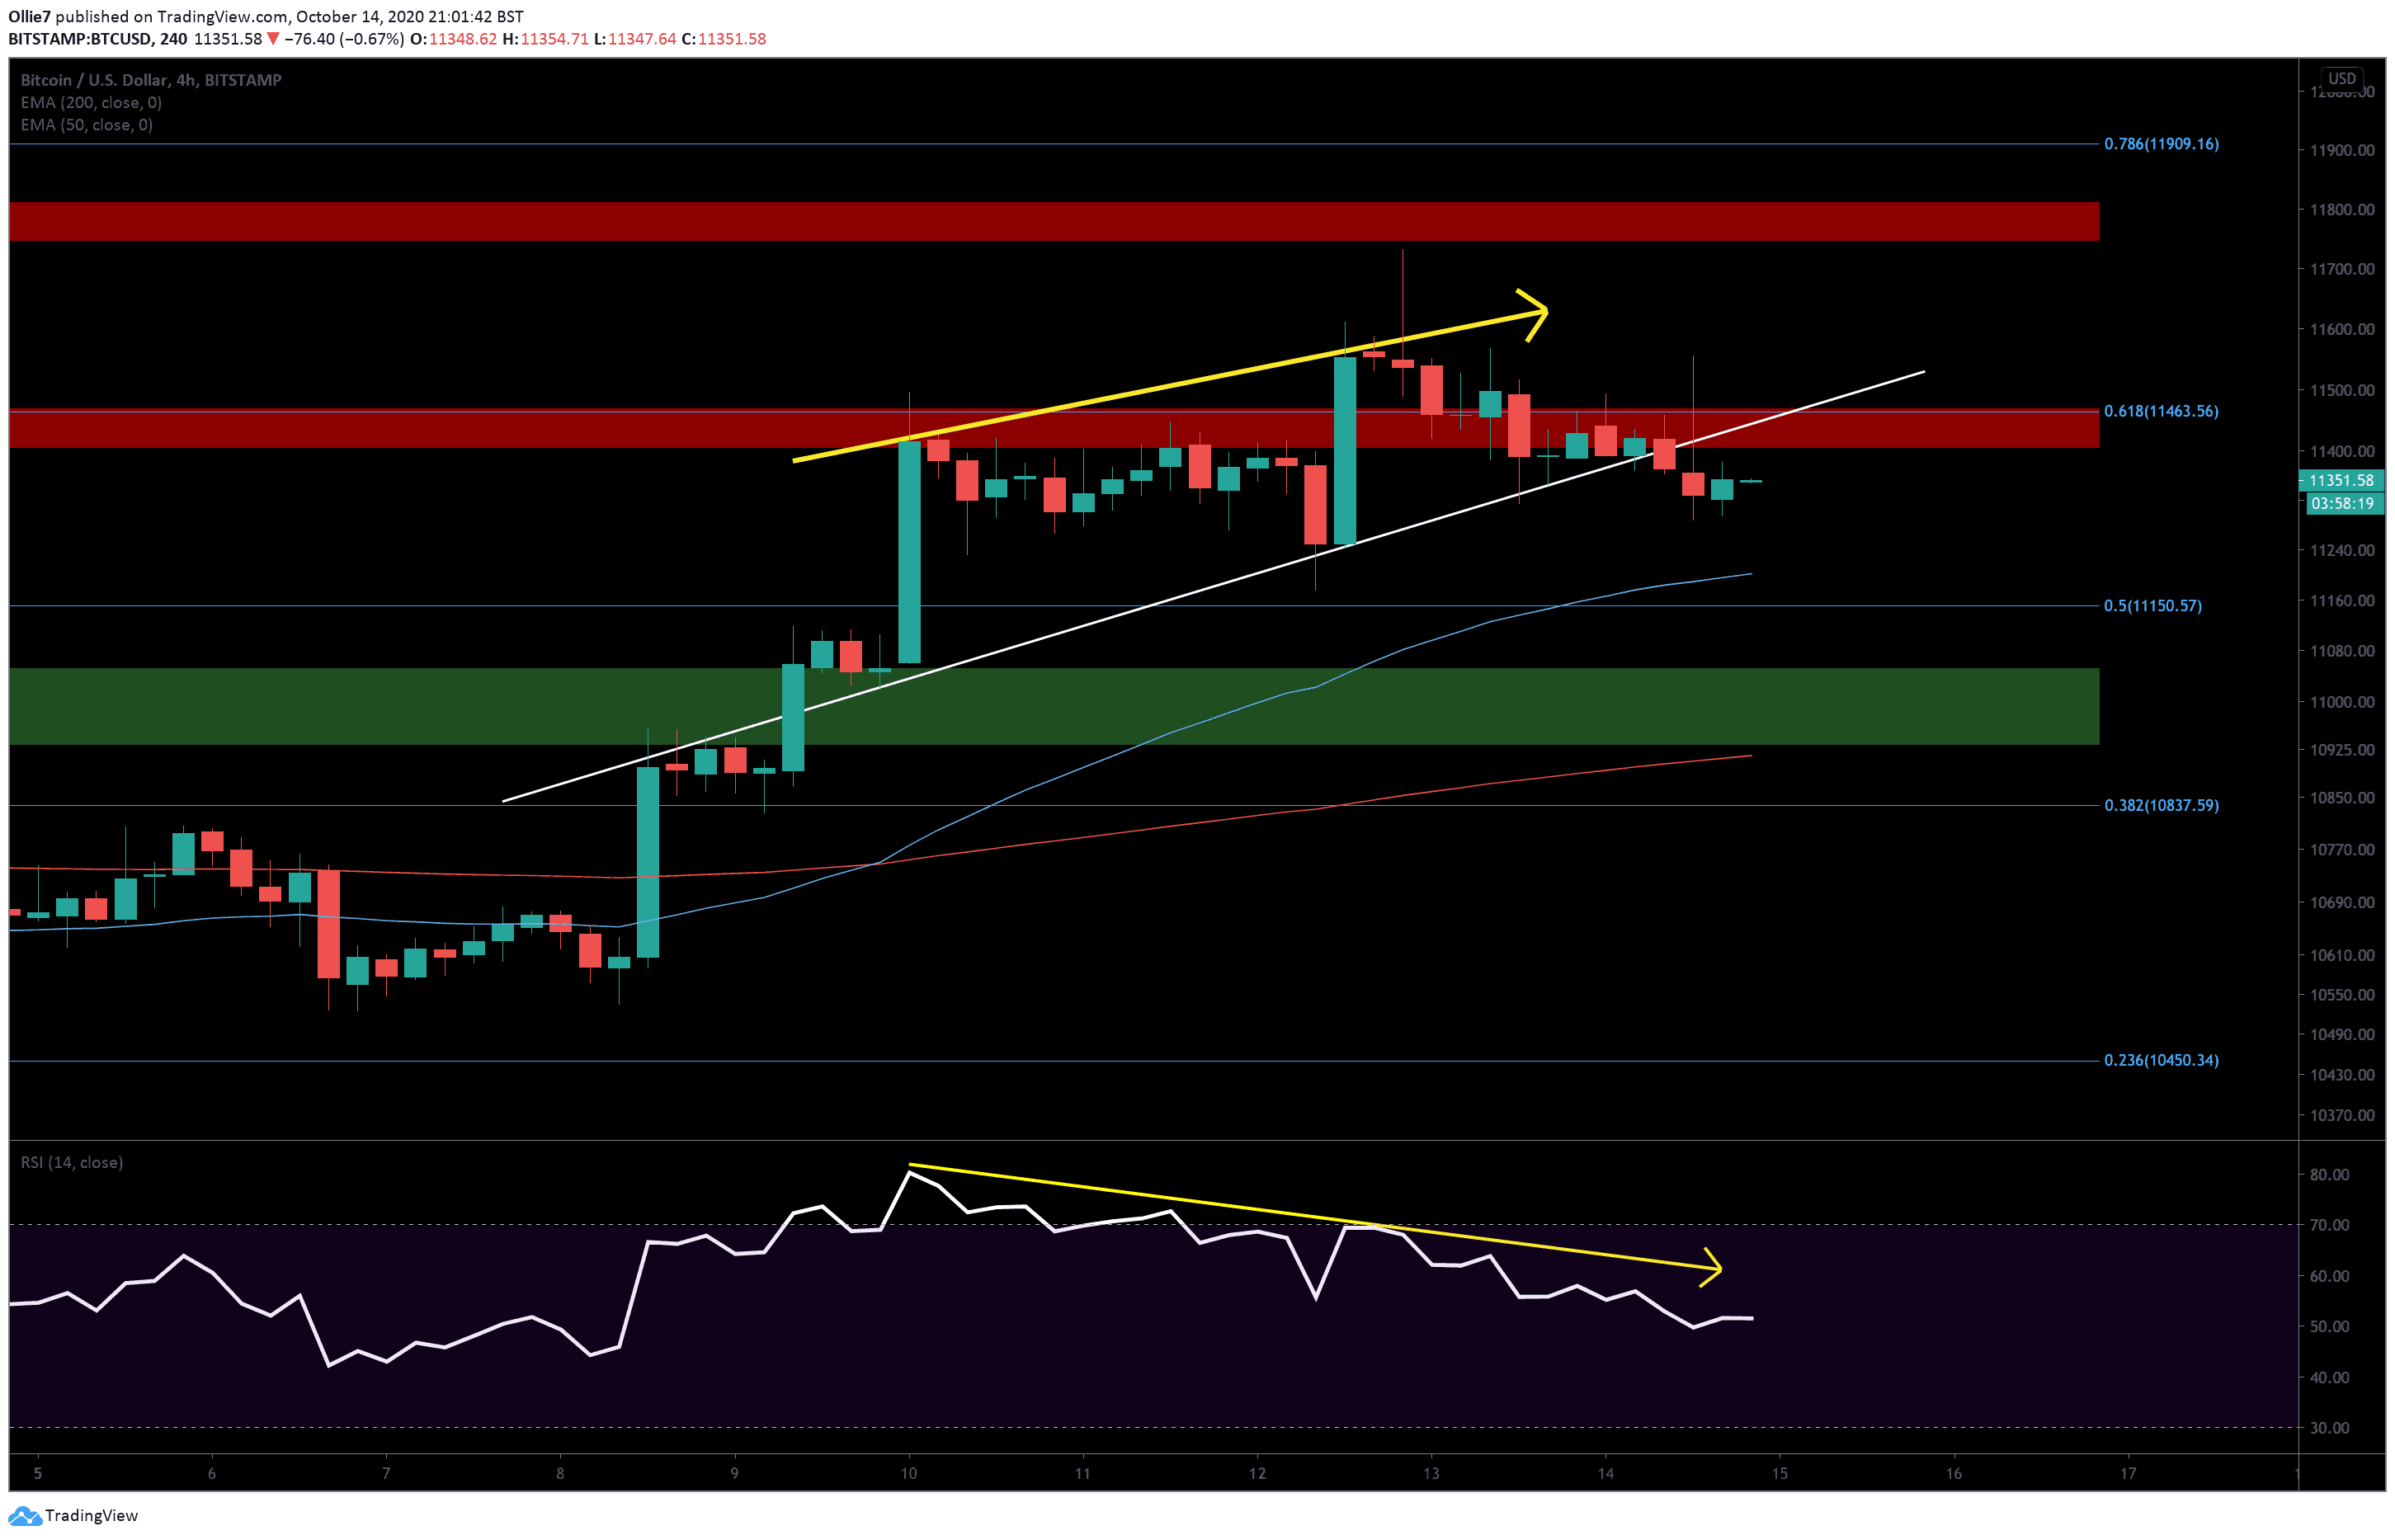
Despite a promising start to the week, the bullish Bitcoin traders have struggled to maintain momentum. In the last few hours, bears have successfully overcome the intra-week support (white line), which was helping to keep BTC in an uptrend, and are now threatening to drive prices back towards the 0.5 Fibonacci level at $11,150.
Looking at the 4-hour chart, we can see that the decline was foreshadowed by a significant divergence between the RSI and the price action (yellow lines), which shows the uptrend was weak and likely to flip bearish.
On the global crypto market capital chart by Coinmarketcap, we can also see that the amount of money flowing into the industry has started to dwindle, which typically forecasts more downside to come.

BTC Price Levels to Watch in the Short-term
Right now, it seems likely that we will see Bitcoin prices throwback on to the former support line (white) and find resistance before ricocheting off and heading down to the 4-hour 50 EMA (blue) approximately around the $11,200 area.
From there, we could see the asset push sideways as traders wait for more clarity in the market. However, if the selling pressure continues, then the 0.5 Fibonacci below at $11,150 and the main support zone (green) between $11,050 and $10,930 should help to prop up bitcoin’s price from further decline.
Underneath that, we also have the 200-EMA (red) at $10,915, which should also provide a solid foothold for bullish traders to relaunch from.
Looking above, the up-trending line and the 0.618 Fibonacci level at $11,464 will be the first set of levels that bullish traders will need to take back if bitcoin is to hold above the $11K level in the short-term.
If substantial buying volume appears, perhaps during the next Asian trading session, then the $11,600 and $11,800 will be top targets for a new rally.
Total market capital: $365 billion
Bitcoin market capital: $210 billion
Bitcoin dominance: 57.7%
*Data by Coingecko
Bitstamp BTC/USD 4-Hour Chart