As mentioned in the last analysis, we anticipated the down-trending level (blue line) would create some resistance for bullish traders, and after five failed attempts, they finally succeeded in breaking through it.Right now (as of writing these lines), BTC prices have jumped 5 in the last hour, and for the first time since January 2020, a bullish convergence has appeared on the monthly MACD.Bitcoin Price Levels to Watch in the Short-termDepending on the strength of the current breakout, we could see BTC briefly correct before pushing on towards the general areas of ,700, and possibly even ,800. To find more specific targets, we can look to the Fibonacci extension levels on the 4-hour chart (see below). This shows potential resistance at the ,498 – ,500 (current daily high),
Topics:
Ollie Leech considers the following as important: Bitcoin (BTC) Price, BTC Analysis, btcusd, btcusdt
This could be interesting, too:
Chayanika Deka writes XRP, SOL, and ADA Inclusion in US Crypto Reserve Pushes Traders on Edge
Chayanika Deka writes Why Arthur Hayes Is Bullish on Bitcoin Under Trump’s Economic Strategy
Mandy Williams writes Why the Bitcoin Market Is Stuck—and the Key Metric That Could Change It: CryptoQuant CEO
Wayne Jones writes Metaplanet Acquires 156 BTC, Bringing Total Holdings to 2,391
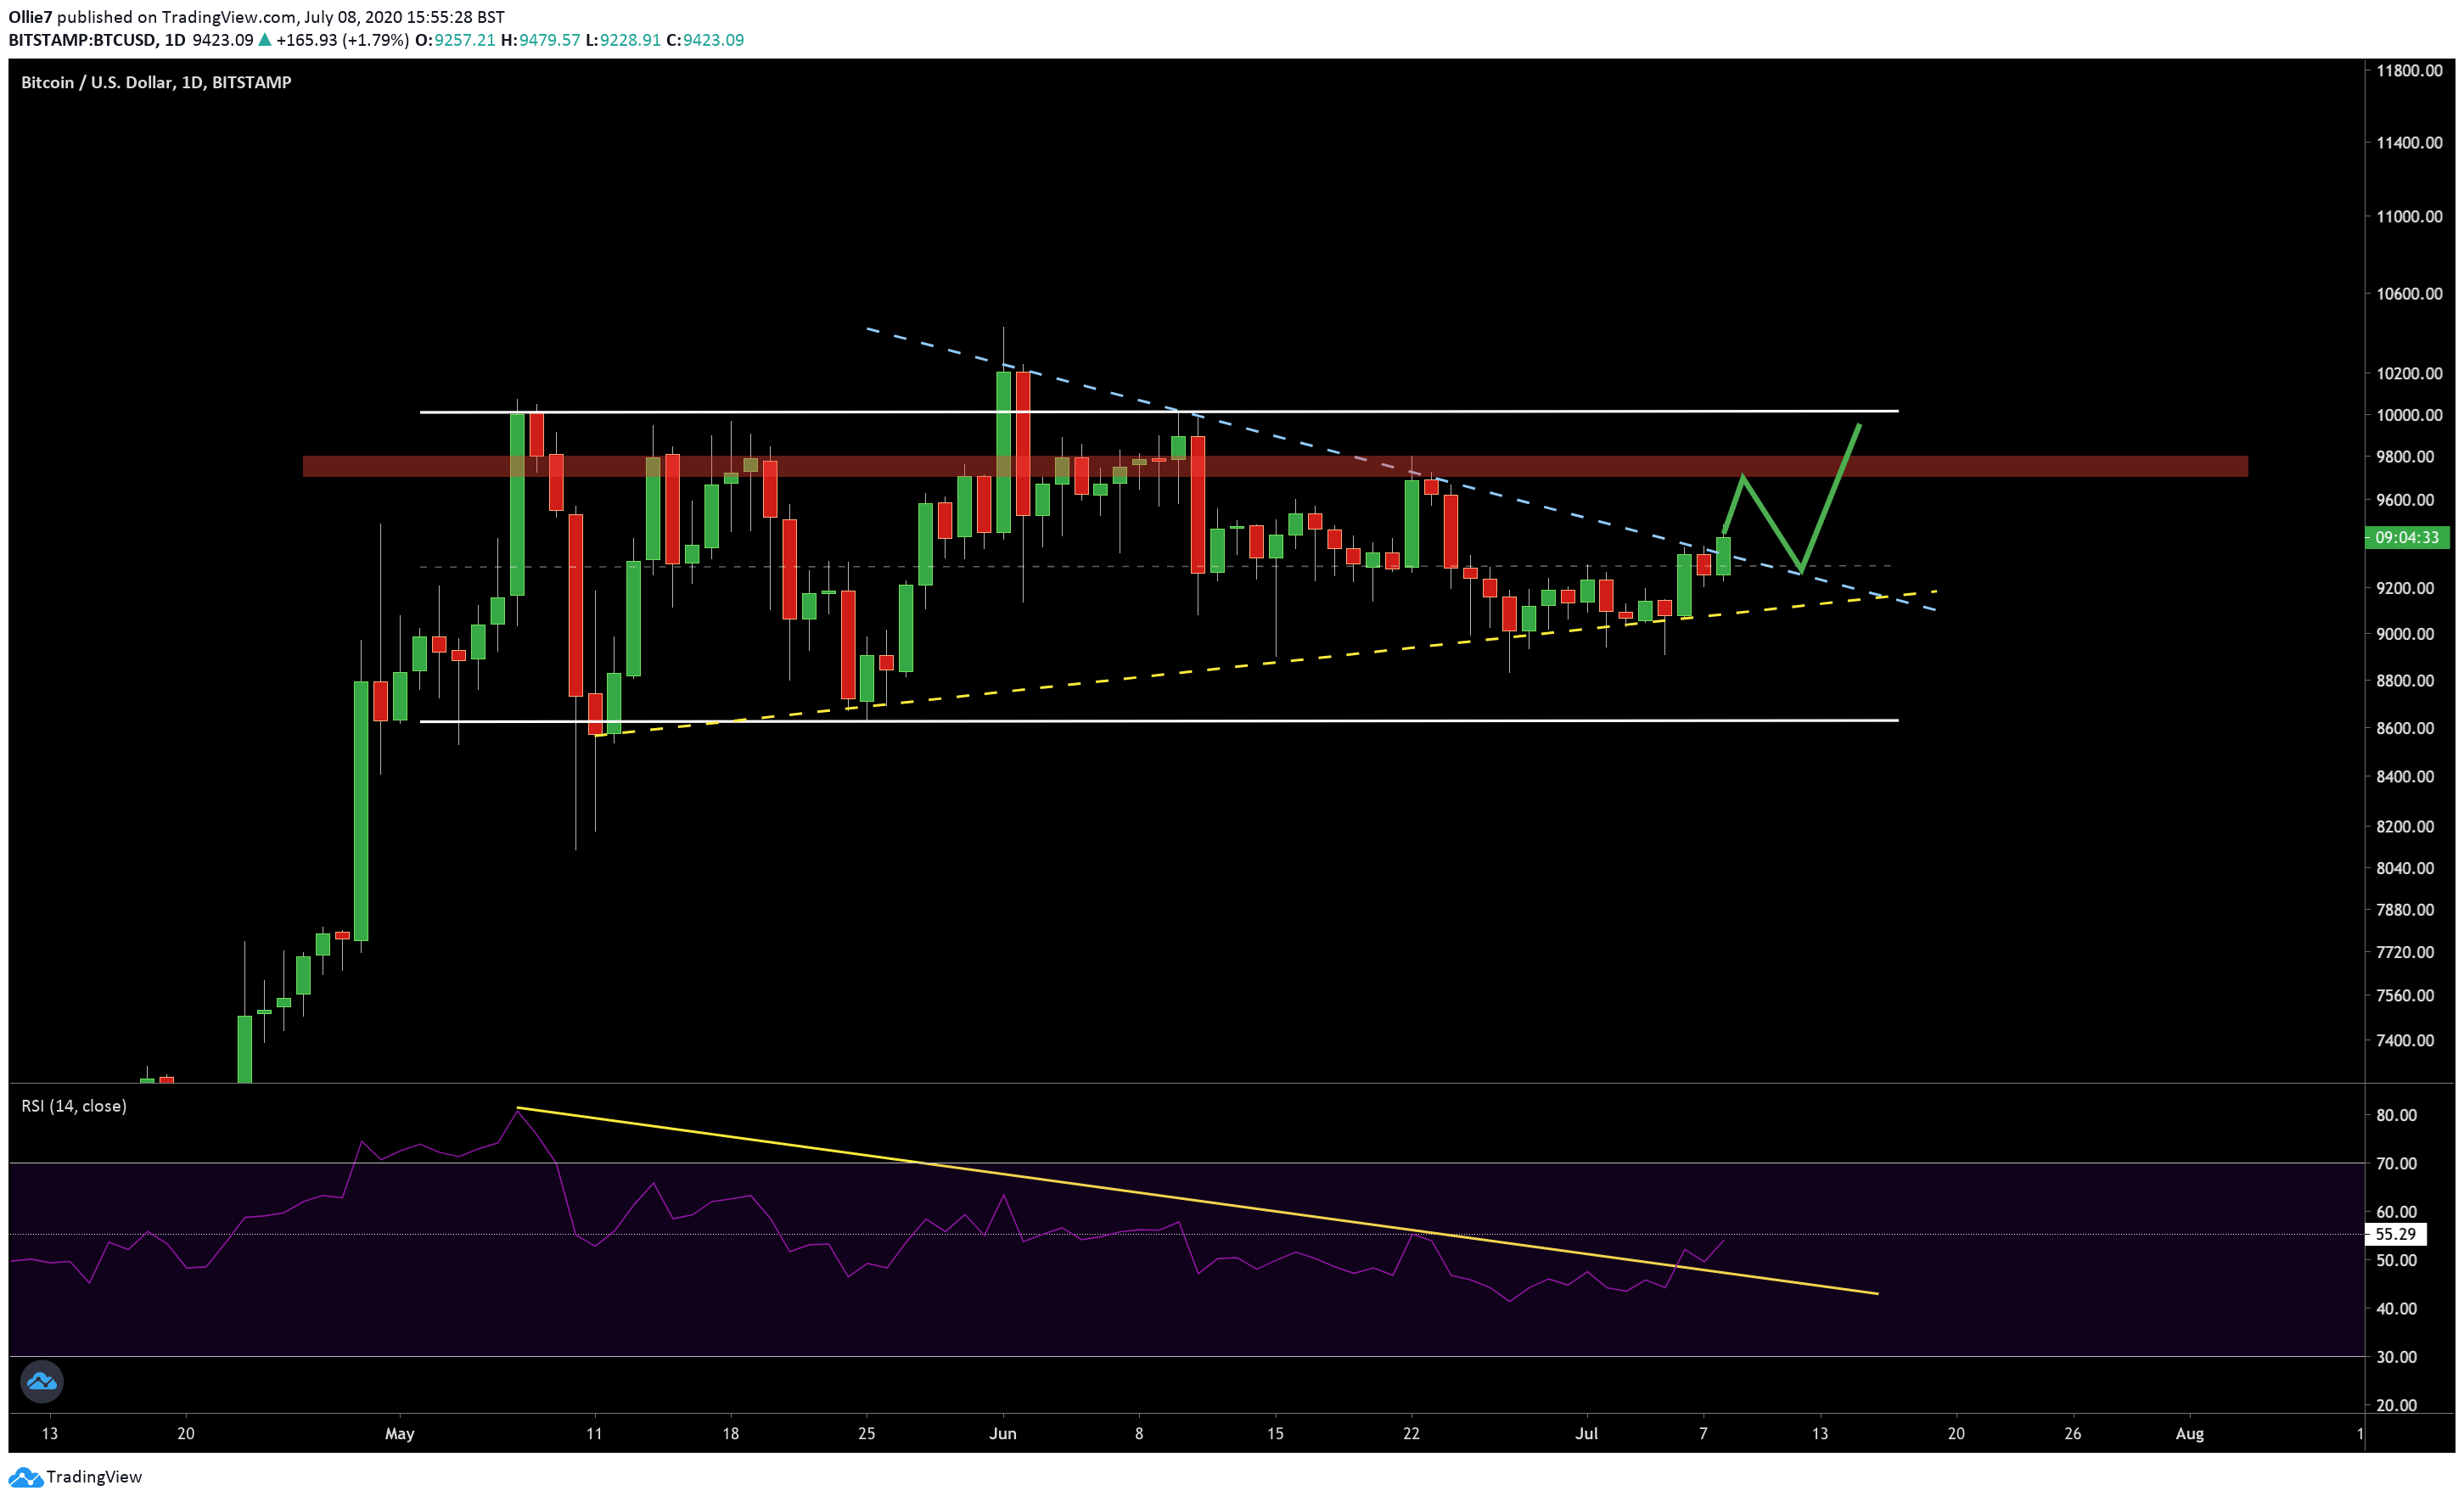
As mentioned in the last analysis, we anticipated the down-trending level (blue line) would create some resistance for bullish traders, and after five failed attempts, they finally succeeded in breaking through it.
Right now (as of writing these lines), BTC prices have jumped $175 in the last hour, and for the first time since January 2020, a bullish convergence has appeared on the monthly MACD.
Bitcoin Price Levels to Watch in the Short-term
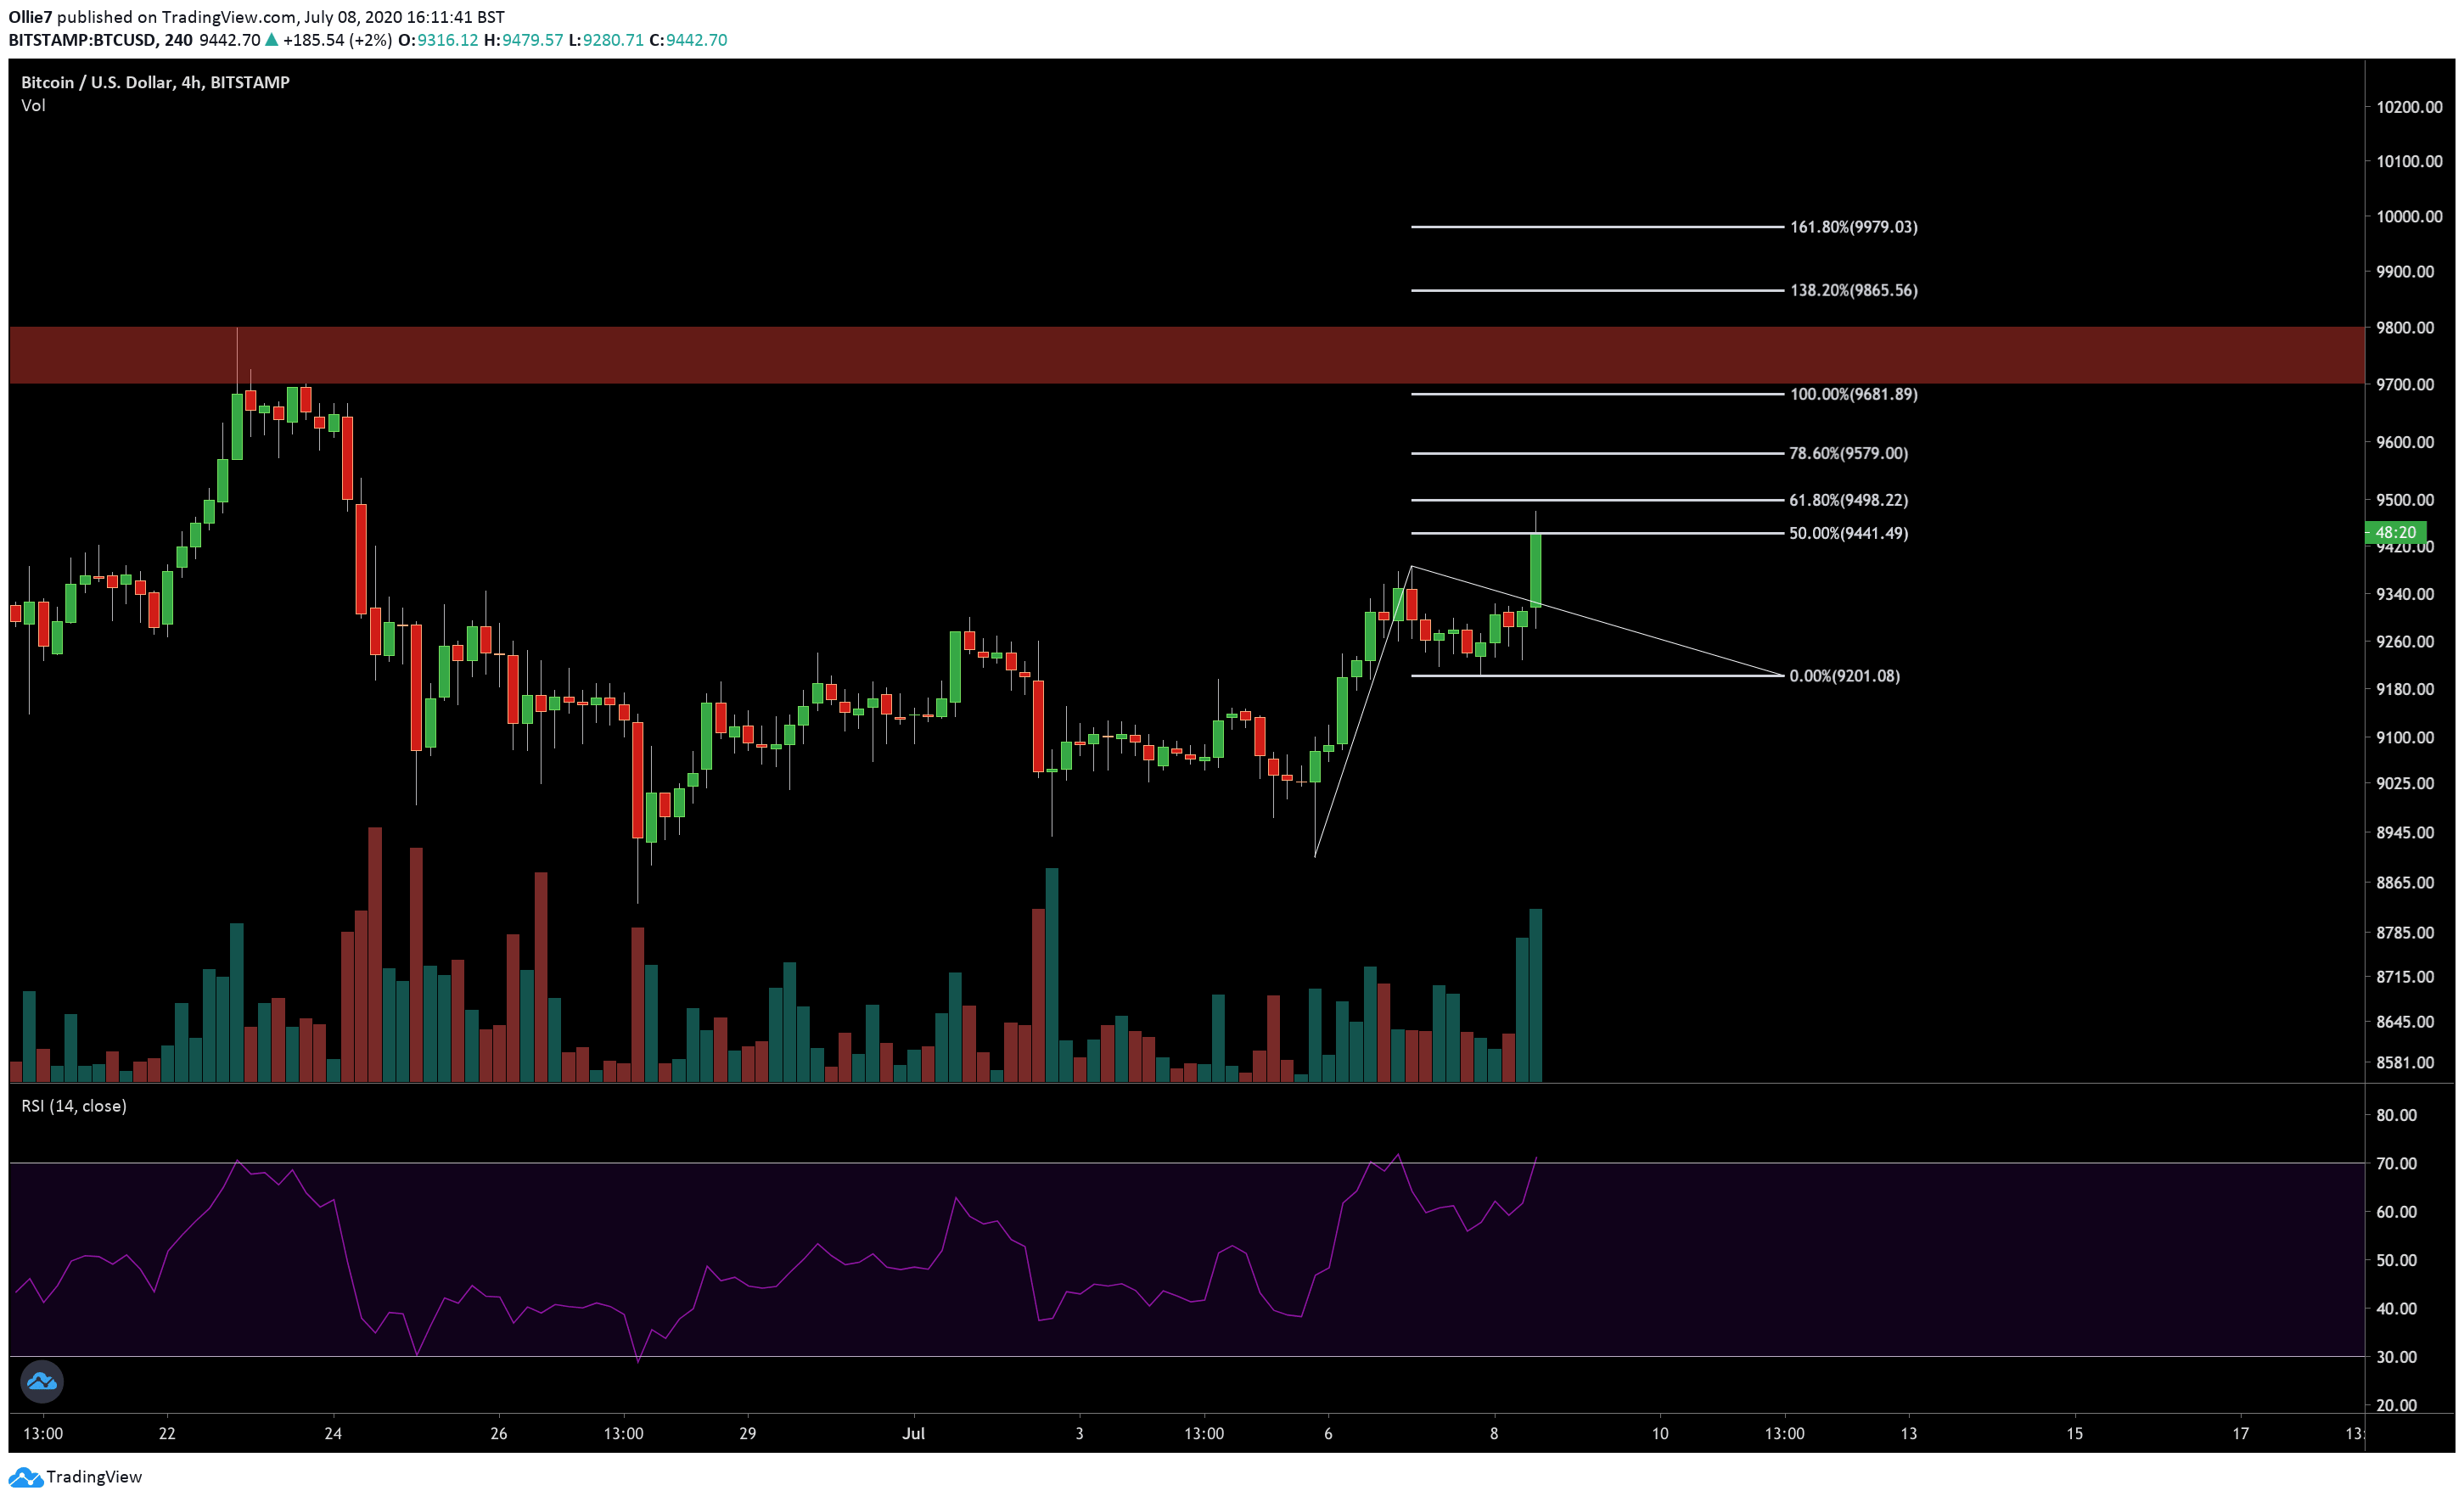
Depending on the strength of the current breakout, we could see BTC briefly correct before pushing on towards the general areas of $9,700, and possibly even $9,800. To find more specific targets, we can look to the Fibonacci extension levels on the 4-hour chart (see below). This shows potential resistance at the $9,498 – $9,500 (current daily high), $9,579, and $9,681 levels.
If bulls become exhausted, however, then it’s likely we’ll see the price either push sideways or throwback onto the previous resistance as a new support before rebounding (green line).
If things turn ugly, the $9,300 level will continue to be the first main support for Bitcoin in the short-term. From there, the psychological $9,000 would be the next most likely support area to watch for a rebound. Underneath that, we have the 100-EMA, which now sits at approximately $8,900.
The Technicals
On the daily RSI, we can see the indicator line is now extremely close to printing its first higher high since May 7.
Coupling that with the first monthly MACD convergence since January, it certainly seems that bitcoin’s longer-term trend is now bullish.
To further support this idea of a bullish reversal, we just need to see the increasing volume on the BTC/USD chart to strengthen the uptrend.
Total Market Cap: $280.1 billion
Bitcoin Market Cap: $173.5 billion
Bitcoin Dominance Index: 62%
BTC/USD Bitstamp Daily Chart

BTC/USD Bitstamp 4-Hour Chart

