Bitcoin bulls look pretty tired right now. The leading cryptocurrency has printed the first lower high since July 21 and is currently stalling around the 0.786 Fibonacci level (white lines) at ,743.We’ve also seen billion exit the market in the last ten hours, which seems to suggest that some traders are cashing out of the bull run.Is this an early warning that the bull run is ending?Bitcoin Price Levels to Watch in the Short-termOn the daily BTC/USD chart, we can see that the whale manipulation pattern, which was outlined in a previous analysis, has now been completed. We often see the price push sideways after this type of pattern emerges, as traders wait for more certainty in the market.We could likely see BTC prices hover in between the aforementioned 0.786 fib level and the
Topics:
Ollie Leech considers the following as important: Bitcoin (BTC) Price, BTC Analysis, BTCEUR, BTCGBP, btcusd, btcusdt
This could be interesting, too:
Chayanika Deka writes XRP, SOL, and ADA Inclusion in US Crypto Reserve Pushes Traders on Edge
Chayanika Deka writes Why Arthur Hayes Is Bullish on Bitcoin Under Trump’s Economic Strategy
Mandy Williams writes Why the Bitcoin Market Is Stuck—and the Key Metric That Could Change It: CryptoQuant CEO
Wayne Jones writes Metaplanet Acquires 156 BTC, Bringing Total Holdings to 2,391
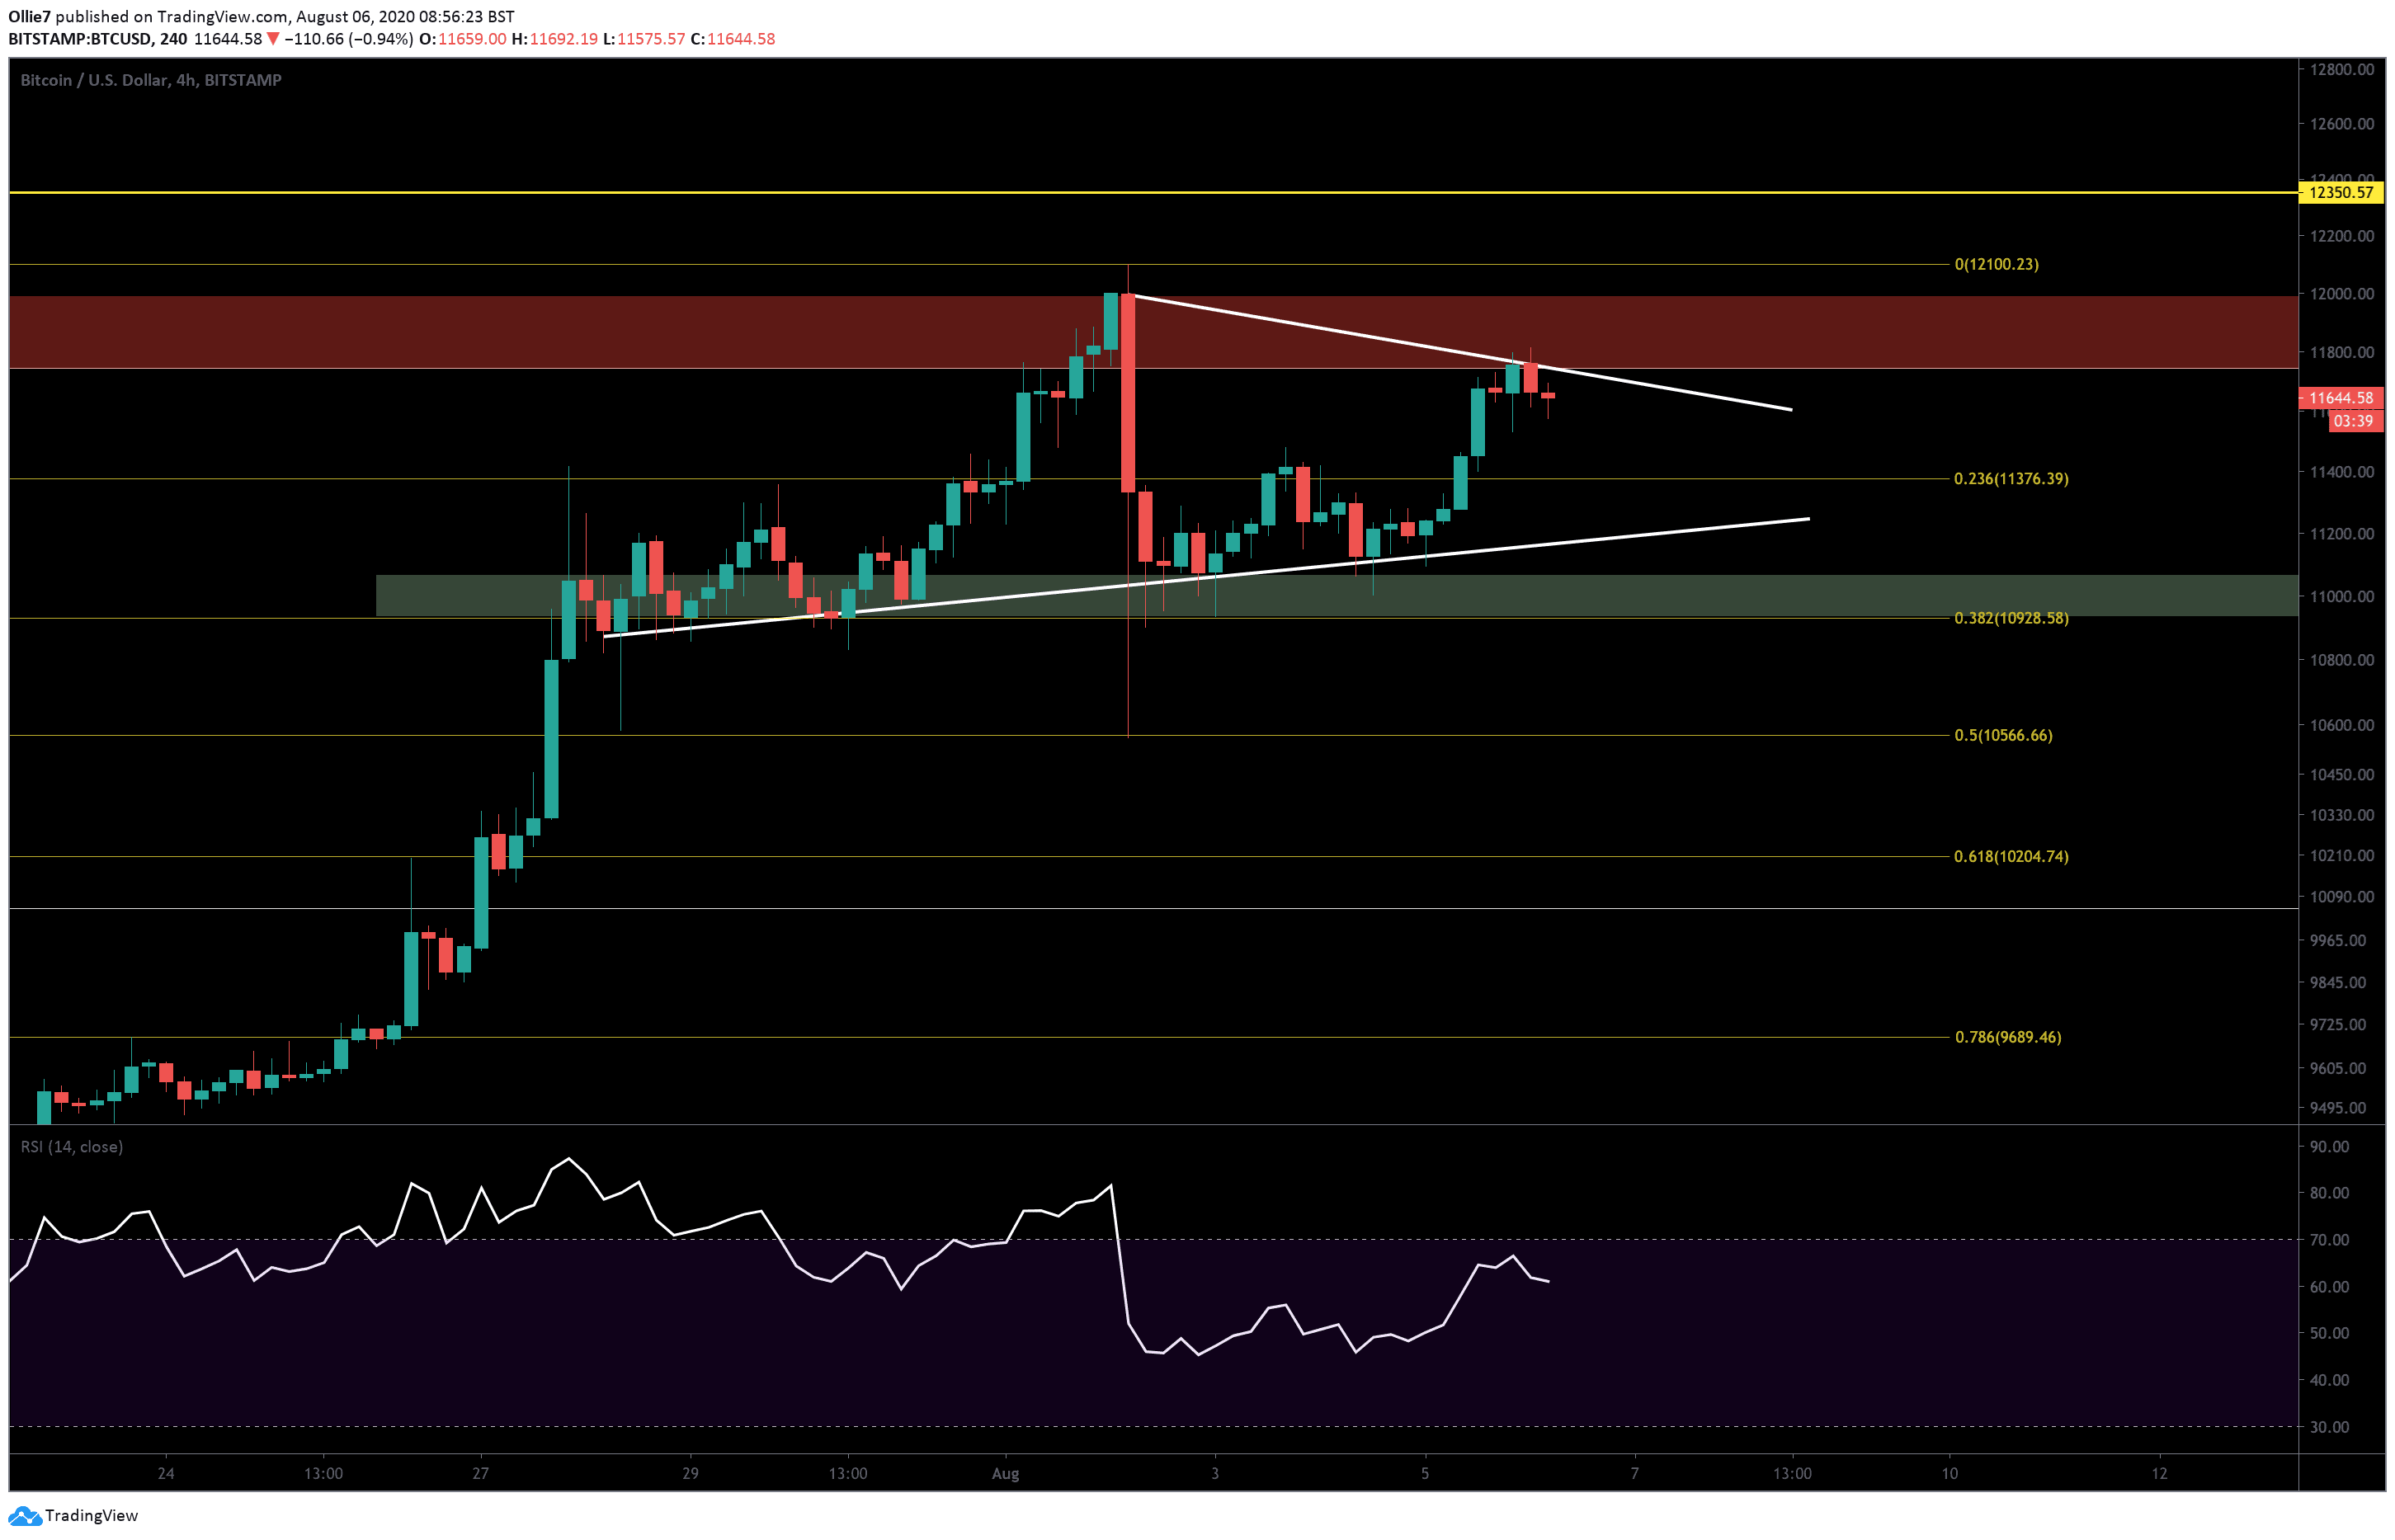
Bitcoin bulls look pretty tired right now. The leading cryptocurrency has printed the first lower high since July 21 and is currently stalling around the 0.786 Fibonacci level (white lines) at $11,743.
We’ve also seen $4 billion exit the market in the last ten hours, which seems to suggest that some traders are cashing out of the bull run.
Is this an early warning that the bull run is ending?
Bitcoin Price Levels to Watch in the Short-term
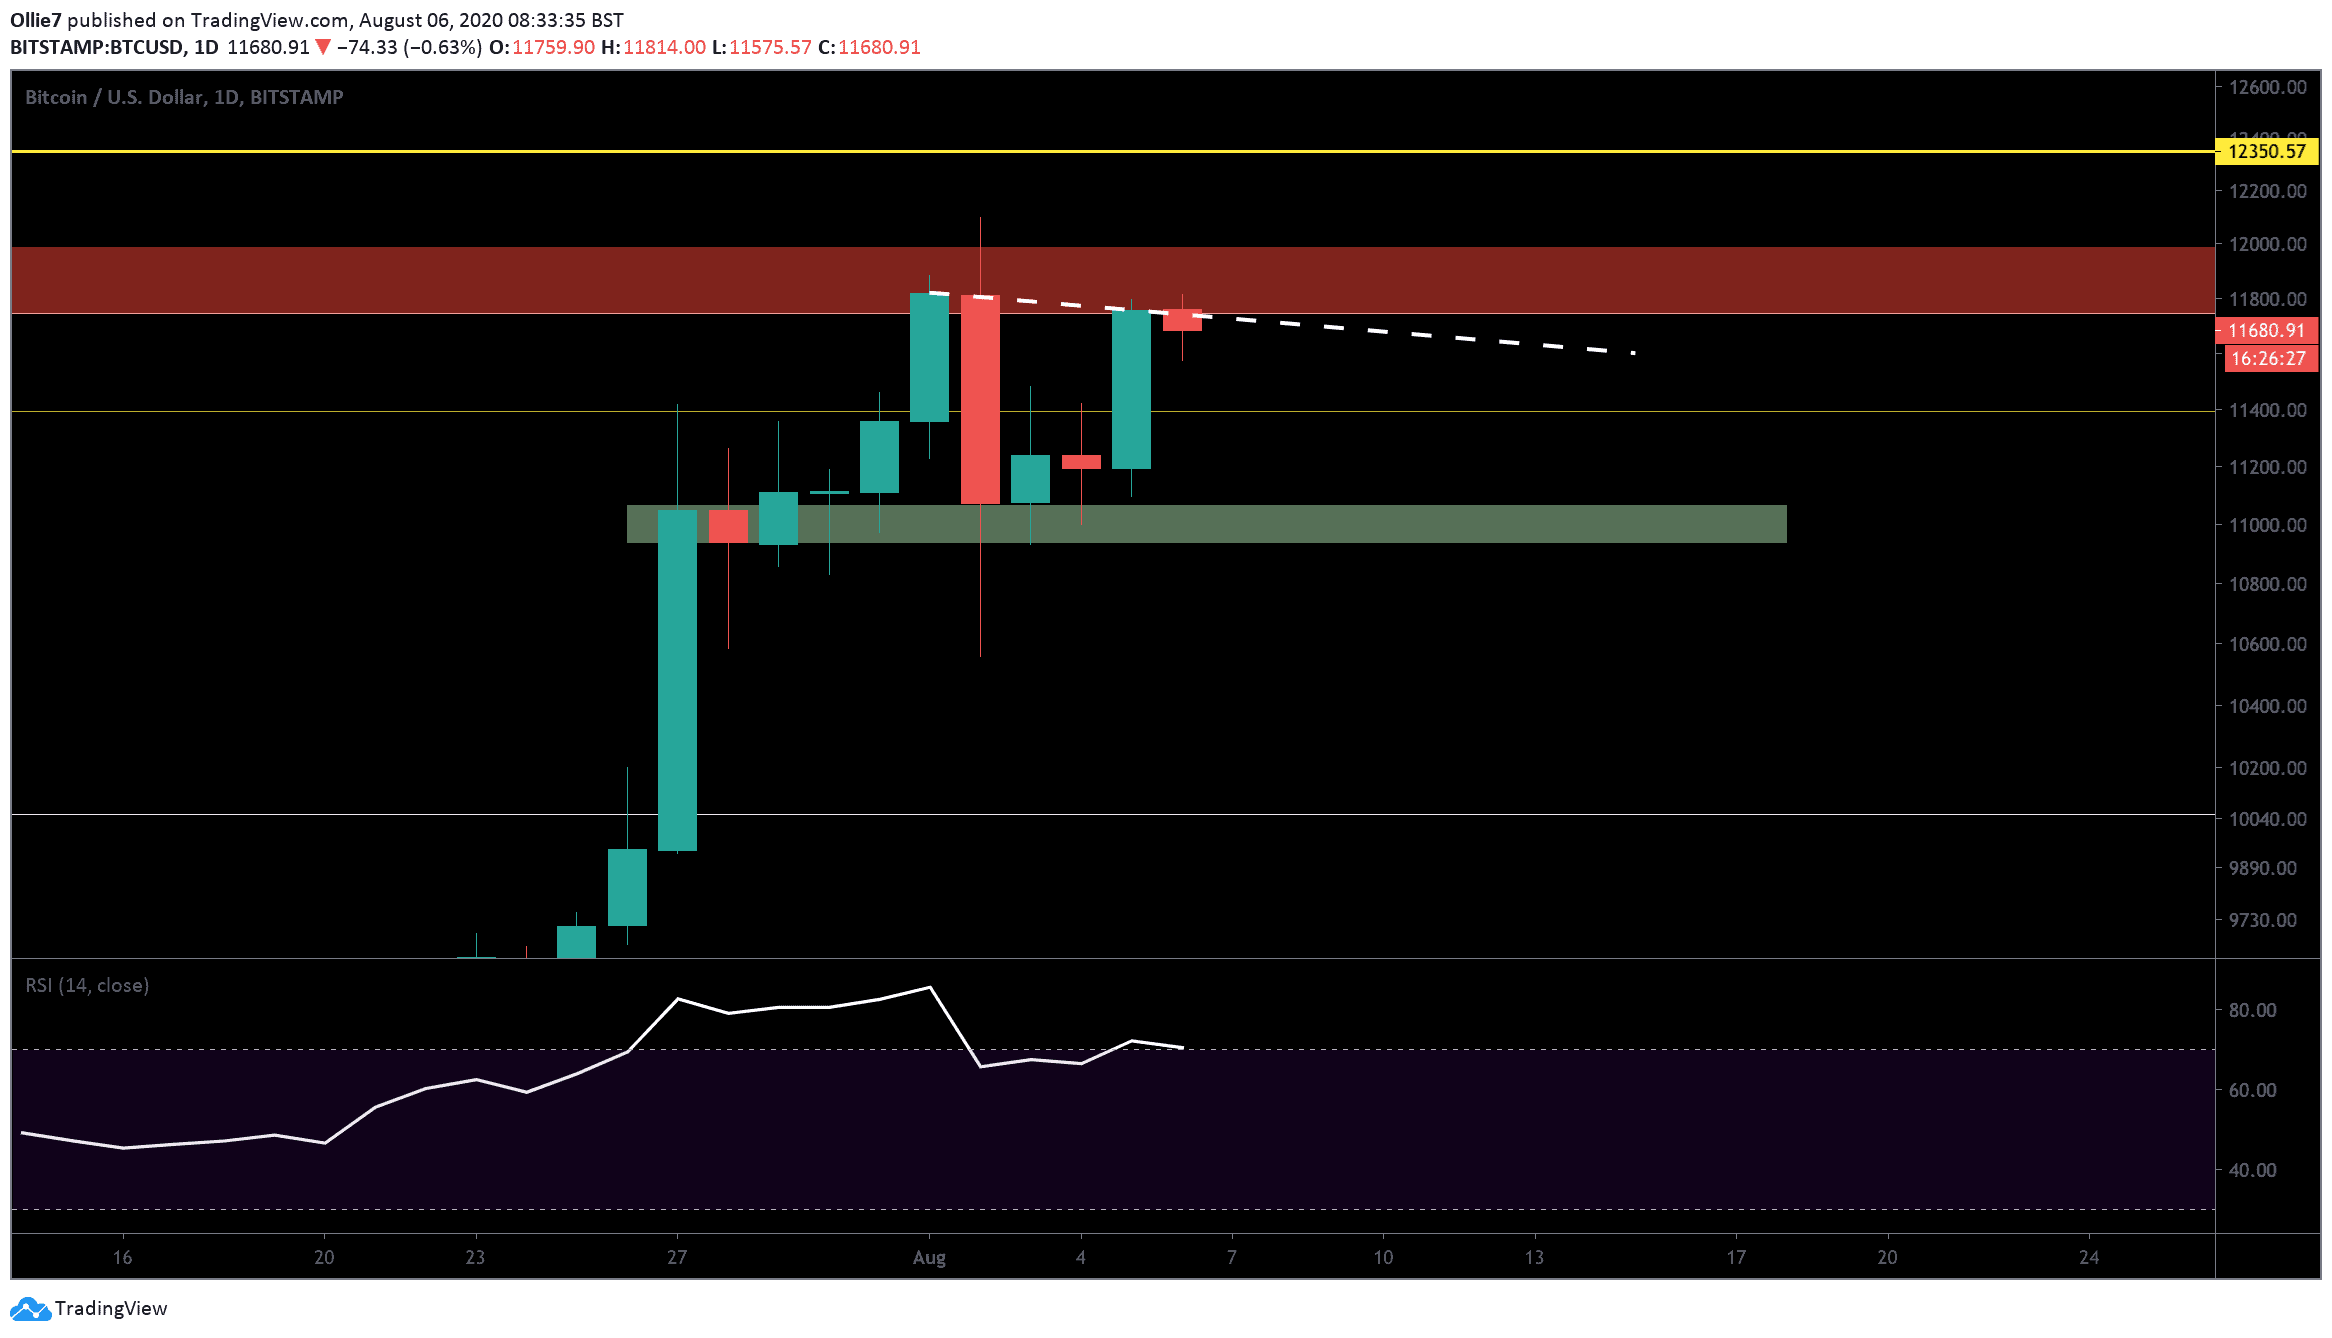
On the daily BTC/USD chart, we can see that the whale manipulation pattern, which was outlined in a previous analysis, has now been completed. We often see the price push sideways after this type of pattern emerges, as traders wait for more certainty in the market.
We could likely see BTC prices hover in between the aforementioned 0.786 fib level and the 0.236 Fibonacci level (yellow second set of fib levels) at $11,376 in the short-term.
To continue the uptrend, we need to see bullish traders break the current resistance (white down-trending line) and, ideally, close above the red area between $11,736 and the $12,000.
If bears take back control, the aforementioned 0.236 fib level will be the first likely support against a breakdown. From there, the up-trending support (white line) approximately around the $11,175 mark could create a foothold for bulls.
A major support area (green) for Bitcoin currently sits at $11,070 and the 0.382 fib level (yellow) at $10,928. This area has propped up the price a number of times since August 2 and should create some buying pressure if retested.
The Technicals
There are some positive signs on the 4-hour chart. Volume has turned bullish again on the MACD indicator, and there are Parabolic SAR dots beneath the price action. This suggests that the short-term trend is still favorably bullish.
We would now like to see a new higher high appear on the RSI, or for buying volume to show a marked increase.
BTC/USD Bitstamp Daily Chart
BTC/USD Bitstamp 4-Hour Chart