Bitcoin is looking a bit worse for wear right now.Bearish traders have finally succeeded in overcoming the long-standing up-trending support (yellow line) that was first established on May 11, and we now have three red candles in a row on the daily BTC/USD chart for the first time since late June.During today’s trading session, we can see that bullish traders are now fighting desperately to keep the ,100 level in play. However, the up-trending support is currently acting as a strong resistance, and we can see on the 4-hour chart (below) that the price action has already thrown back on to this level and ricocheted downward.The TechnicalsOn the daily BTC/USD chart, the volume is still dropping on the 20-day MA. On July 15, bears succeeded in driving the price action below the 50-day
Topics:
Ollie Leech considers the following as important: Bitcoin (BTC) Price, BTC Analysis, btcusd, btcusdt
This could be interesting, too:
Chayanika Deka writes XRP, SOL, and ADA Inclusion in US Crypto Reserve Pushes Traders on Edge
Chayanika Deka writes Why Arthur Hayes Is Bullish on Bitcoin Under Trump’s Economic Strategy
Mandy Williams writes Why the Bitcoin Market Is Stuck—and the Key Metric That Could Change It: CryptoQuant CEO
Wayne Jones writes Metaplanet Acquires 156 BTC, Bringing Total Holdings to 2,391
Bitcoin is looking a bit worse for wear right now.
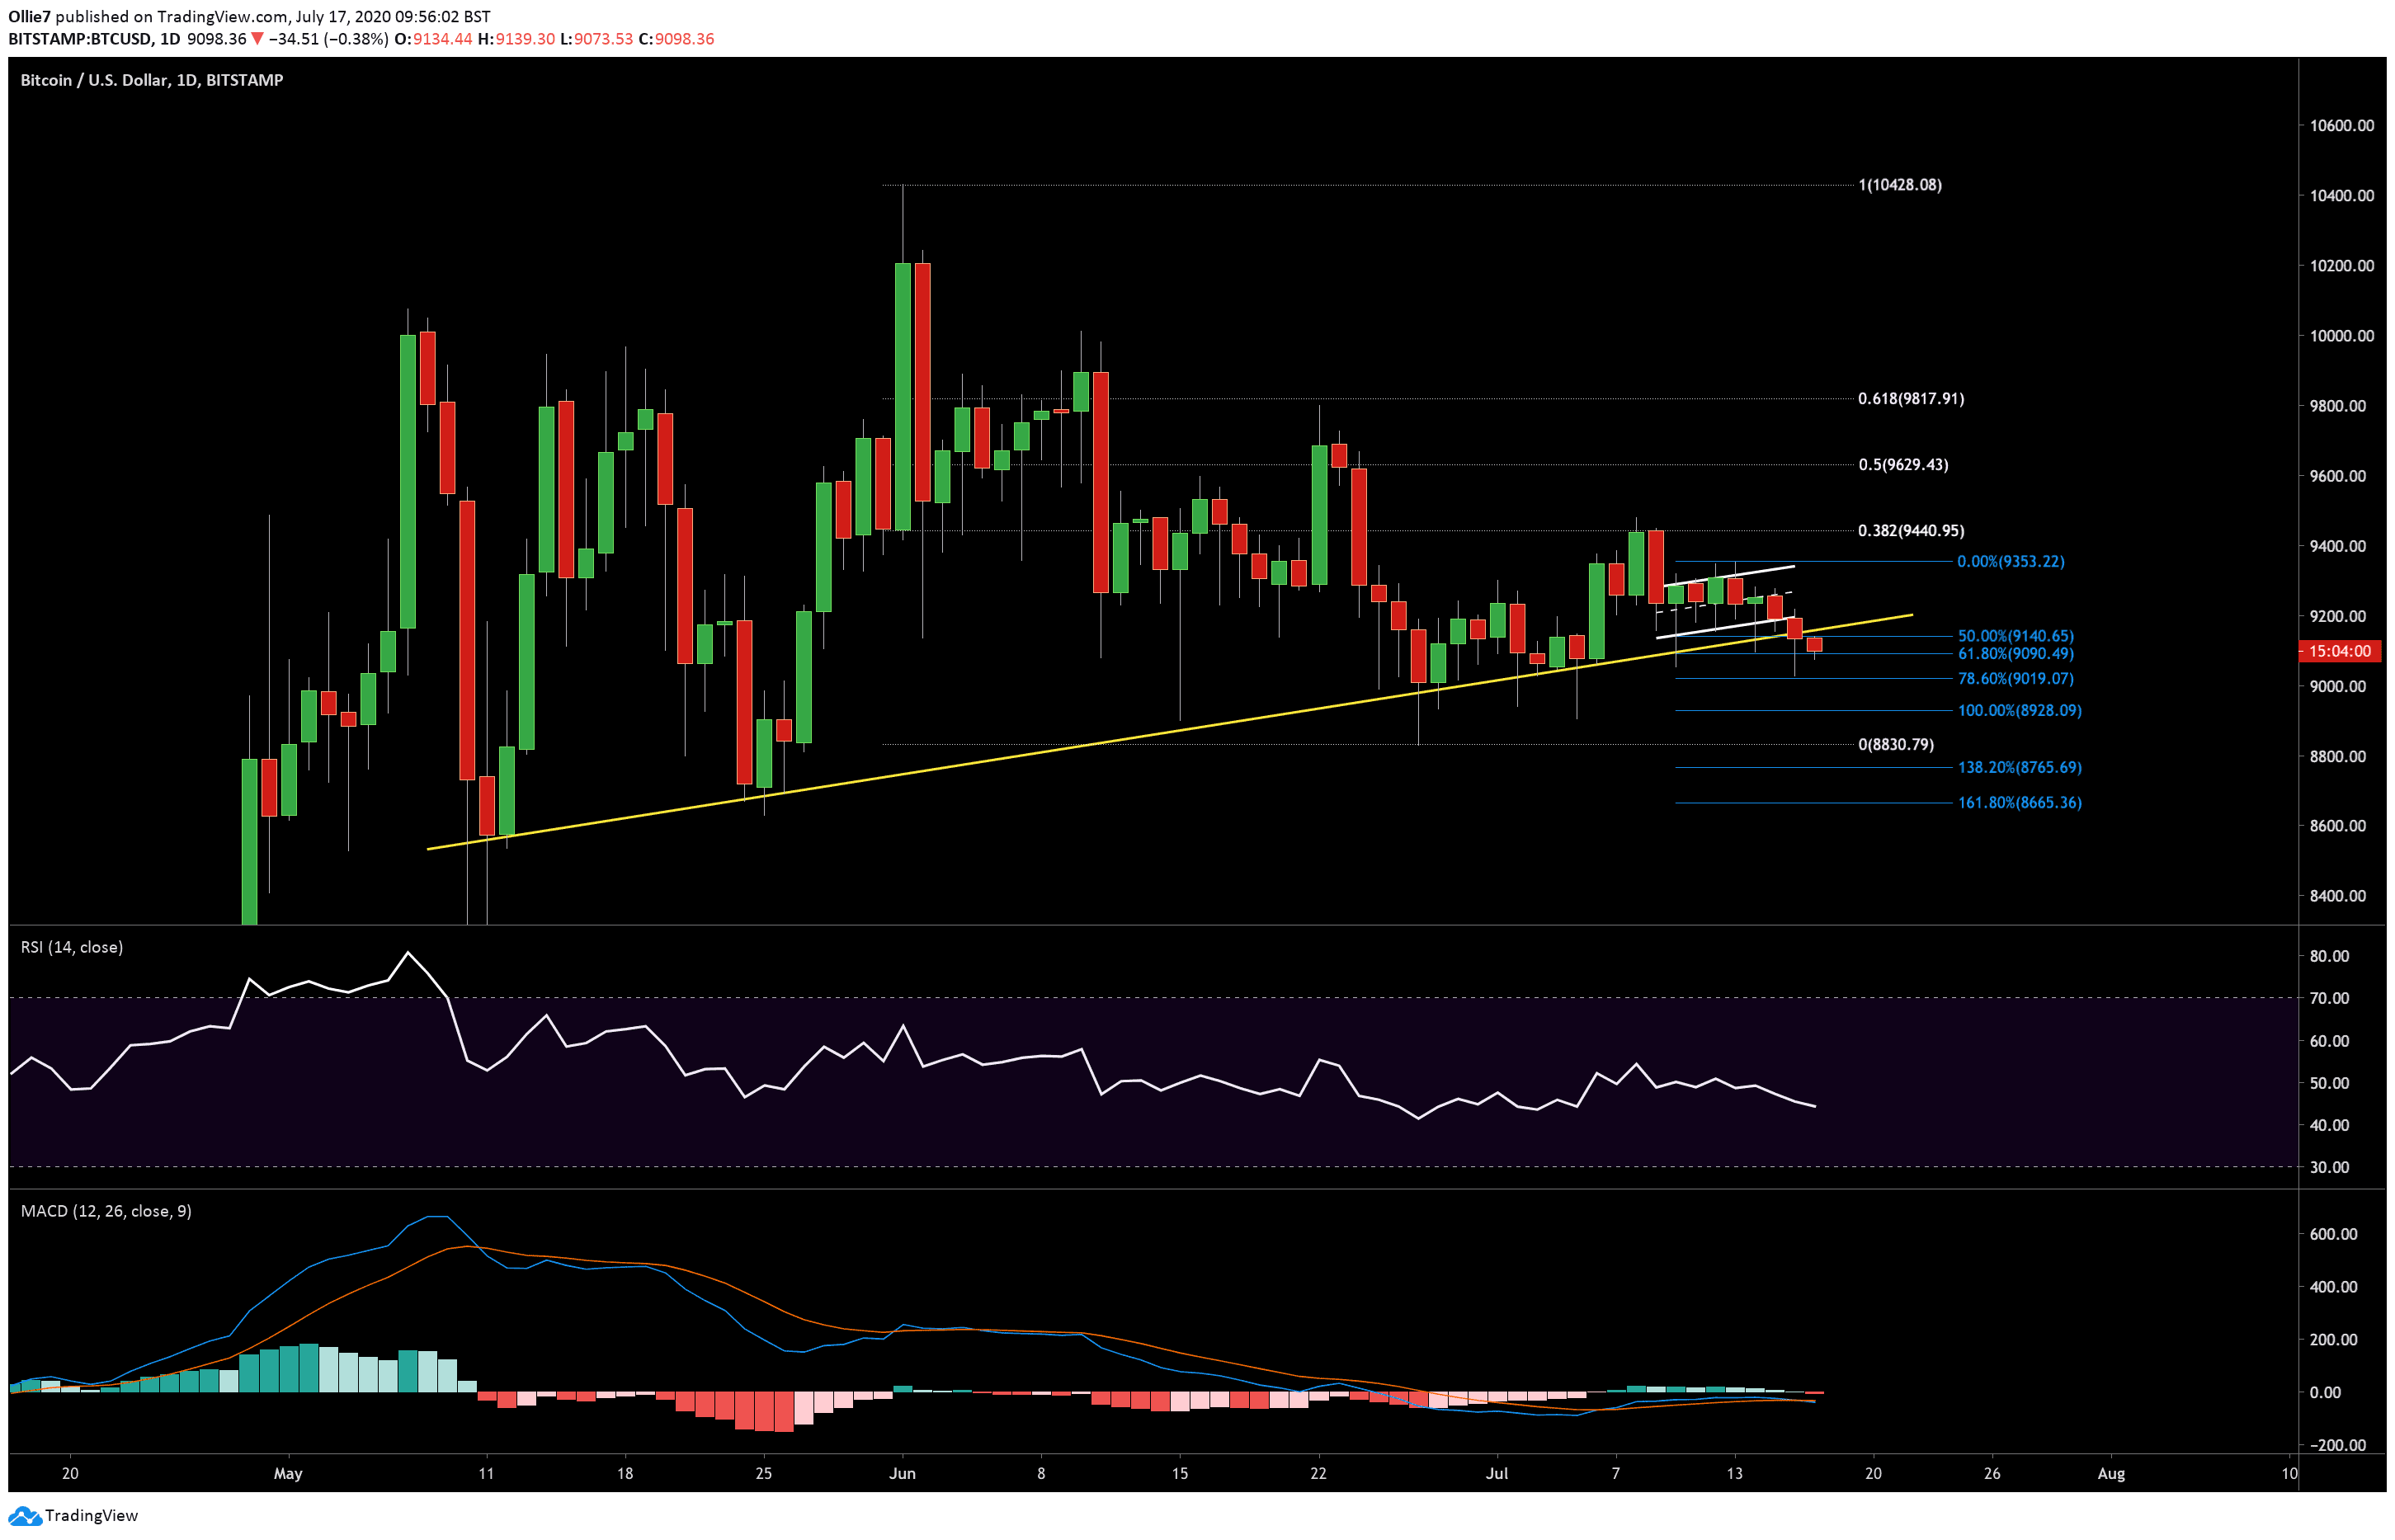
Bearish traders have finally succeeded in overcoming the long-standing up-trending support (yellow line) that was first established on May 11, and we now have three red candles in a row on the daily BTC/USD chart for the first time since late June.
During today’s trading session, we can see that bullish traders are now fighting desperately to keep the $9,100 level in play. However, the up-trending support is currently acting as a strong resistance, and we can see on the 4-hour chart (below) that the price action has already thrown back on to this level and ricocheted downward.
The Technicals
On the daily BTC/USD chart, the volume is still dropping on the 20-day MA. On July 15, bears succeeded in driving the price action below the 50-day Exponential Moving Average (EMA).
The RSI continues to print lower highs, with BTC now in the lower quartile of the index channel, at a value of 40.
On the MACD indicator, over the same time frame, we can also see a new bearish divergence between the 12 and 24 moving averages, with increasing selling volume appearing on the histogram.
Price Levels to Watch in the Short-term
If bulls can keep the price above $9,100 after today’s close, then it’s likely that we will see the asset to push sideways over the weekend.
If bears continue their assault over Bitcoin and break the $9.1K support, then we will once again look to the psychological $9,000 level as the first support. This also sits around the 0.786 Fibonacci extension level (blue lines), which helped to prop up the price during yesterday’s $190 crash.
Looking down further, we have other potential supports at the 1.0, 1.382, and 1.618 fib extension levels ($8,926, $8,763, and $8,663 respectively.)
Total Market Capital: $274 billion
Bitcoin Market Capital: $168 billion
Bitcoin Dominance Index: 61.2%
*Data by Coingecko
BTC/USD Bitstamp Daily Chart
BTC/USD Bitstamp 4-Hour Chart
