Bitcoin price has been oscillating within a narrow 0 range for the past 3 days now as bulls struggle to break over the 0.5 Fibonacci Extension level at ,480. This area between ,044 and ,480 is the same spot that BTC was stuck inside of during December 5 – 8, right before prices tanked by ,560.According to Bitcoin’s volatility chart (BVOL24H), the leading crypto has fallen by almost 43% since December 9th, and the global crypto market capital has also started pushing sideways. This could be construed as a sign of accumulation before another big move or that traders are simply winding down in the run-up to Christmas.Despite these factors, Bitcoin dominance is now up at 64.7%, and testing levels not seen in over 22 days.BTC.D chart via Tradingview.Price Levels to Watch in the
Topics:
Ollie Leech considers the following as important: Bitcoin (BTC) Price, BTC Analysis, BTCEUR, BTCGBP, btcusd, btcusdt
This could be interesting, too:
Chayanika Deka writes XRP, SOL, and ADA Inclusion in US Crypto Reserve Pushes Traders on Edge
Chayanika Deka writes Why Arthur Hayes Is Bullish on Bitcoin Under Trump’s Economic Strategy
Mandy Williams writes Why the Bitcoin Market Is Stuck—and the Key Metric That Could Change It: CryptoQuant CEO
Wayne Jones writes Metaplanet Acquires 156 BTC, Bringing Total Holdings to 2,391
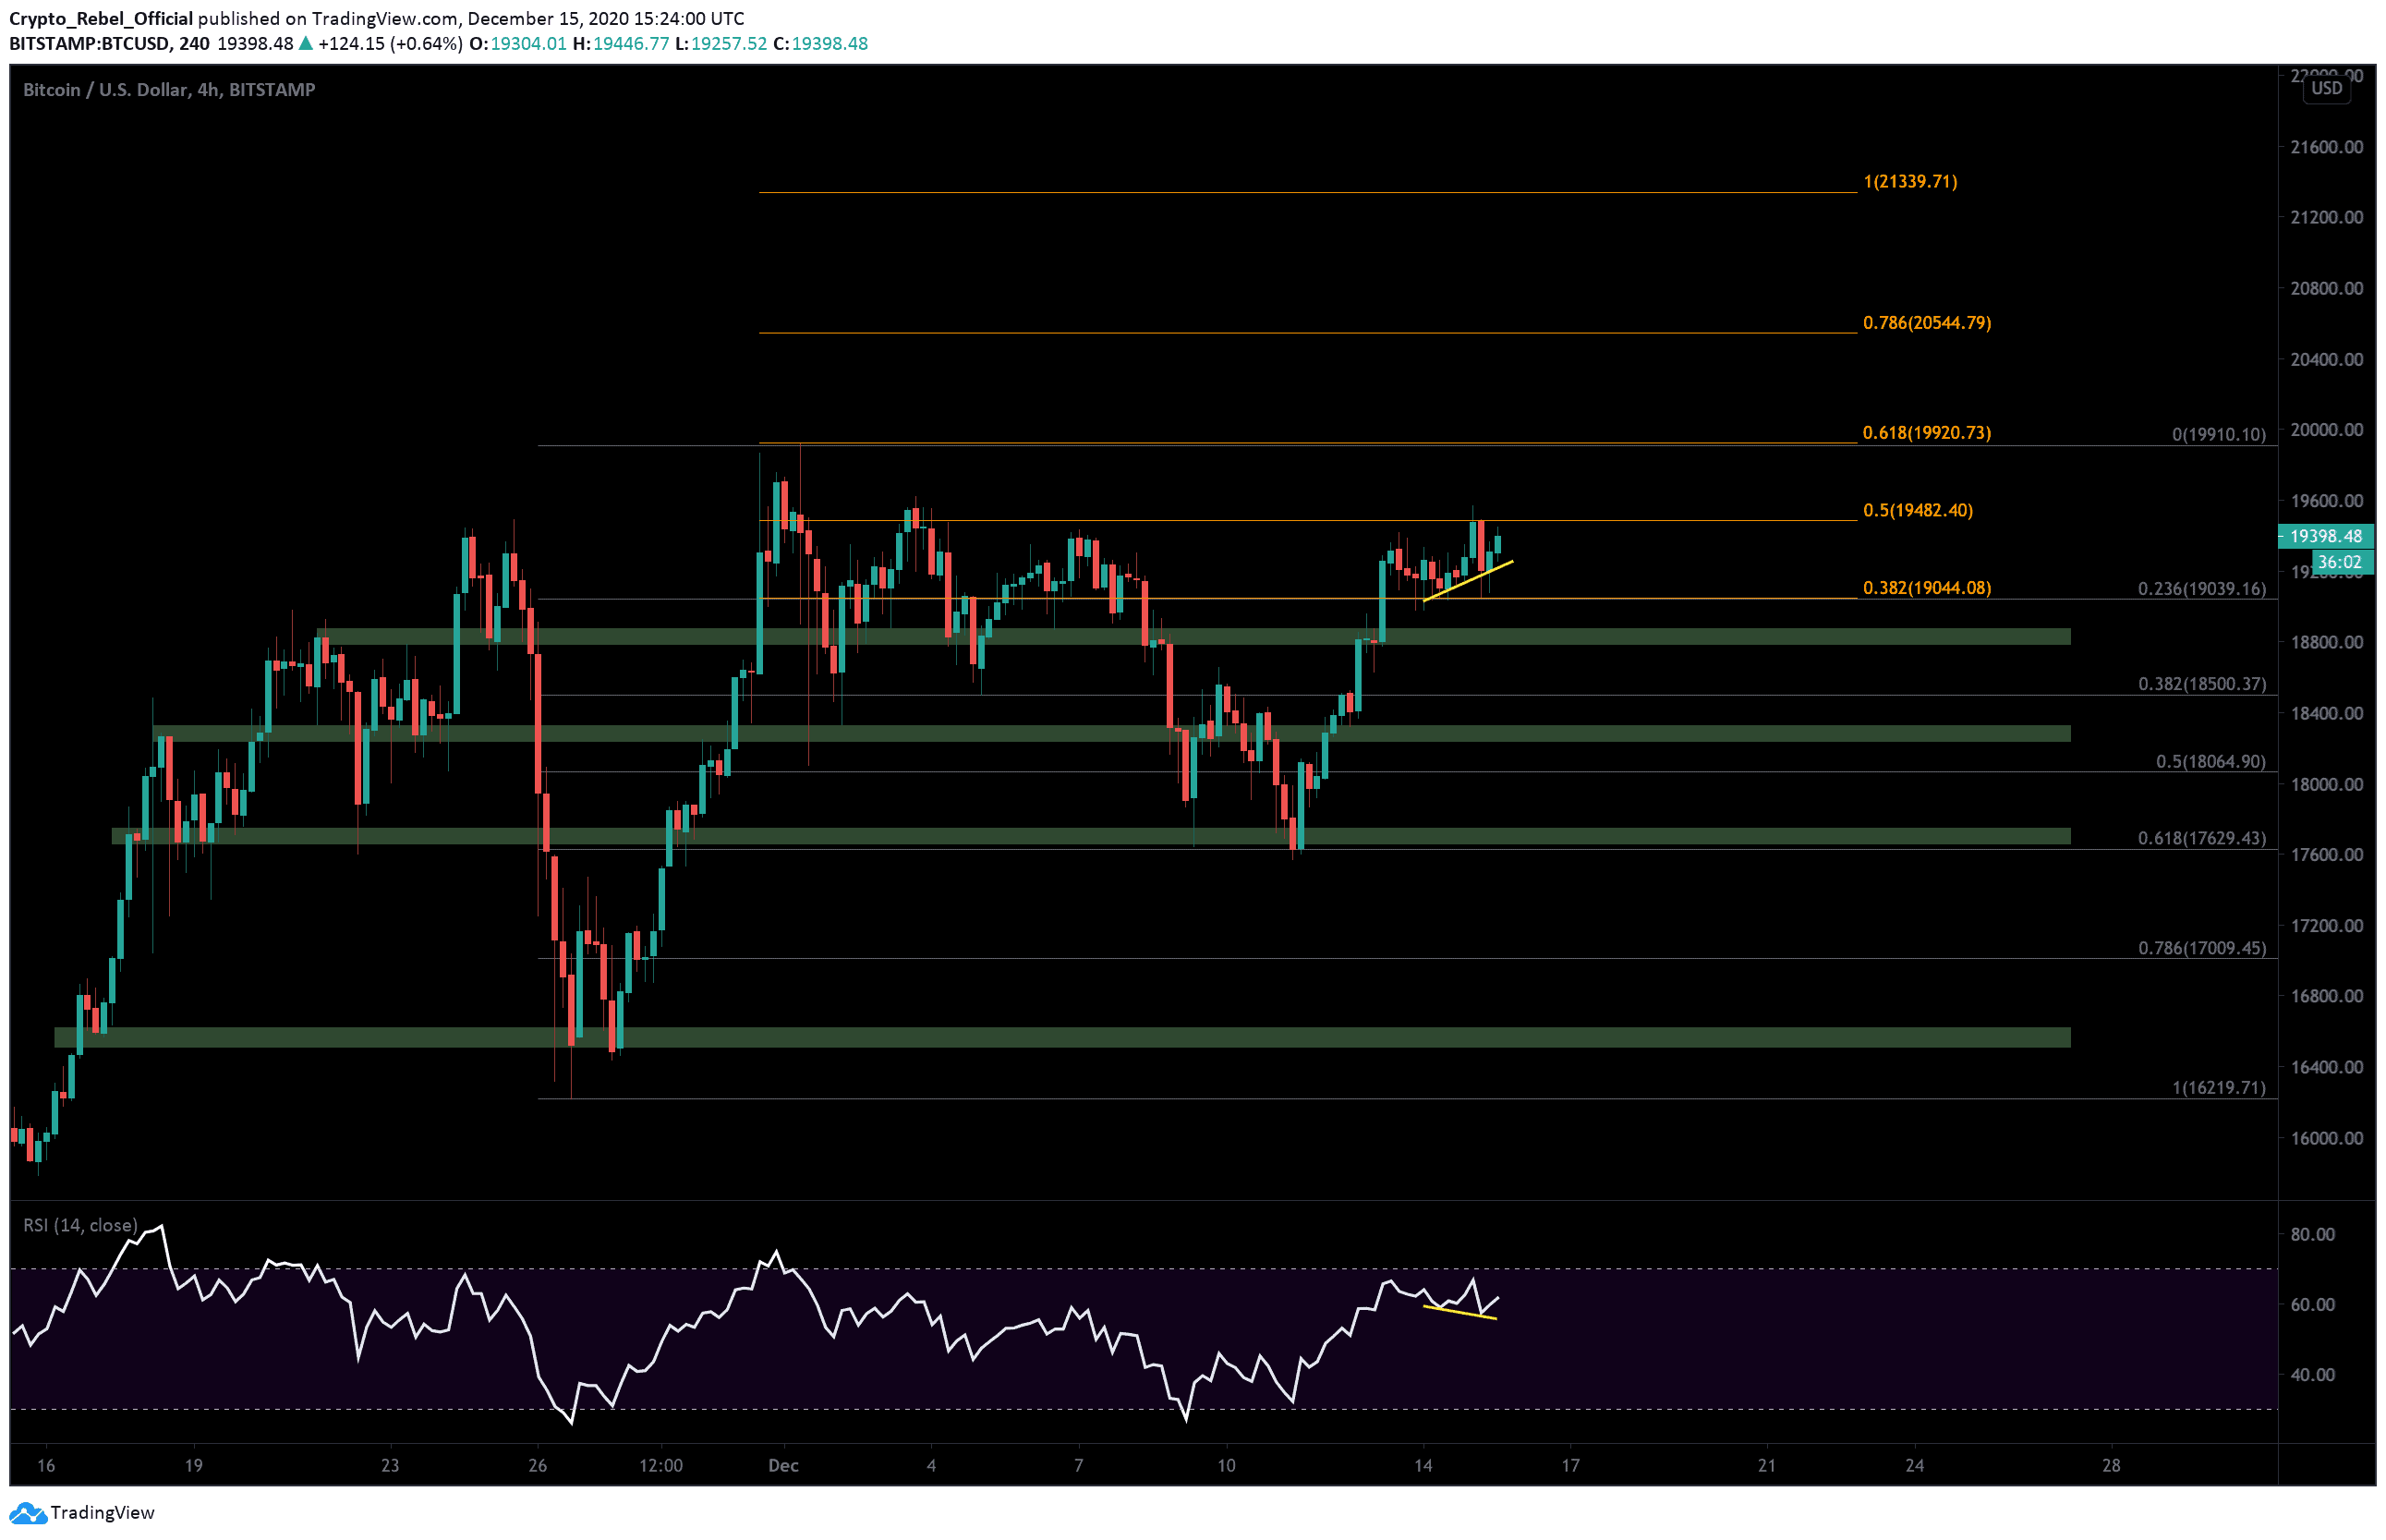
Bitcoin price has been oscillating within a narrow $450 range for the past 3 days now as bulls struggle to break over the 0.5 Fibonacci Extension level at $19,480. This area between $19,044 and $19,480 is the same spot that BTC was stuck inside of during December 5 – 8, right before prices tanked by $1,560.
According to Bitcoin’s volatility chart (BVOL24H), the leading crypto has fallen by almost 43% since December 9th, and the global crypto market capital has also started pushing sideways. This could be construed as a sign of accumulation before another big move or that traders are simply winding down in the run-up to Christmas.
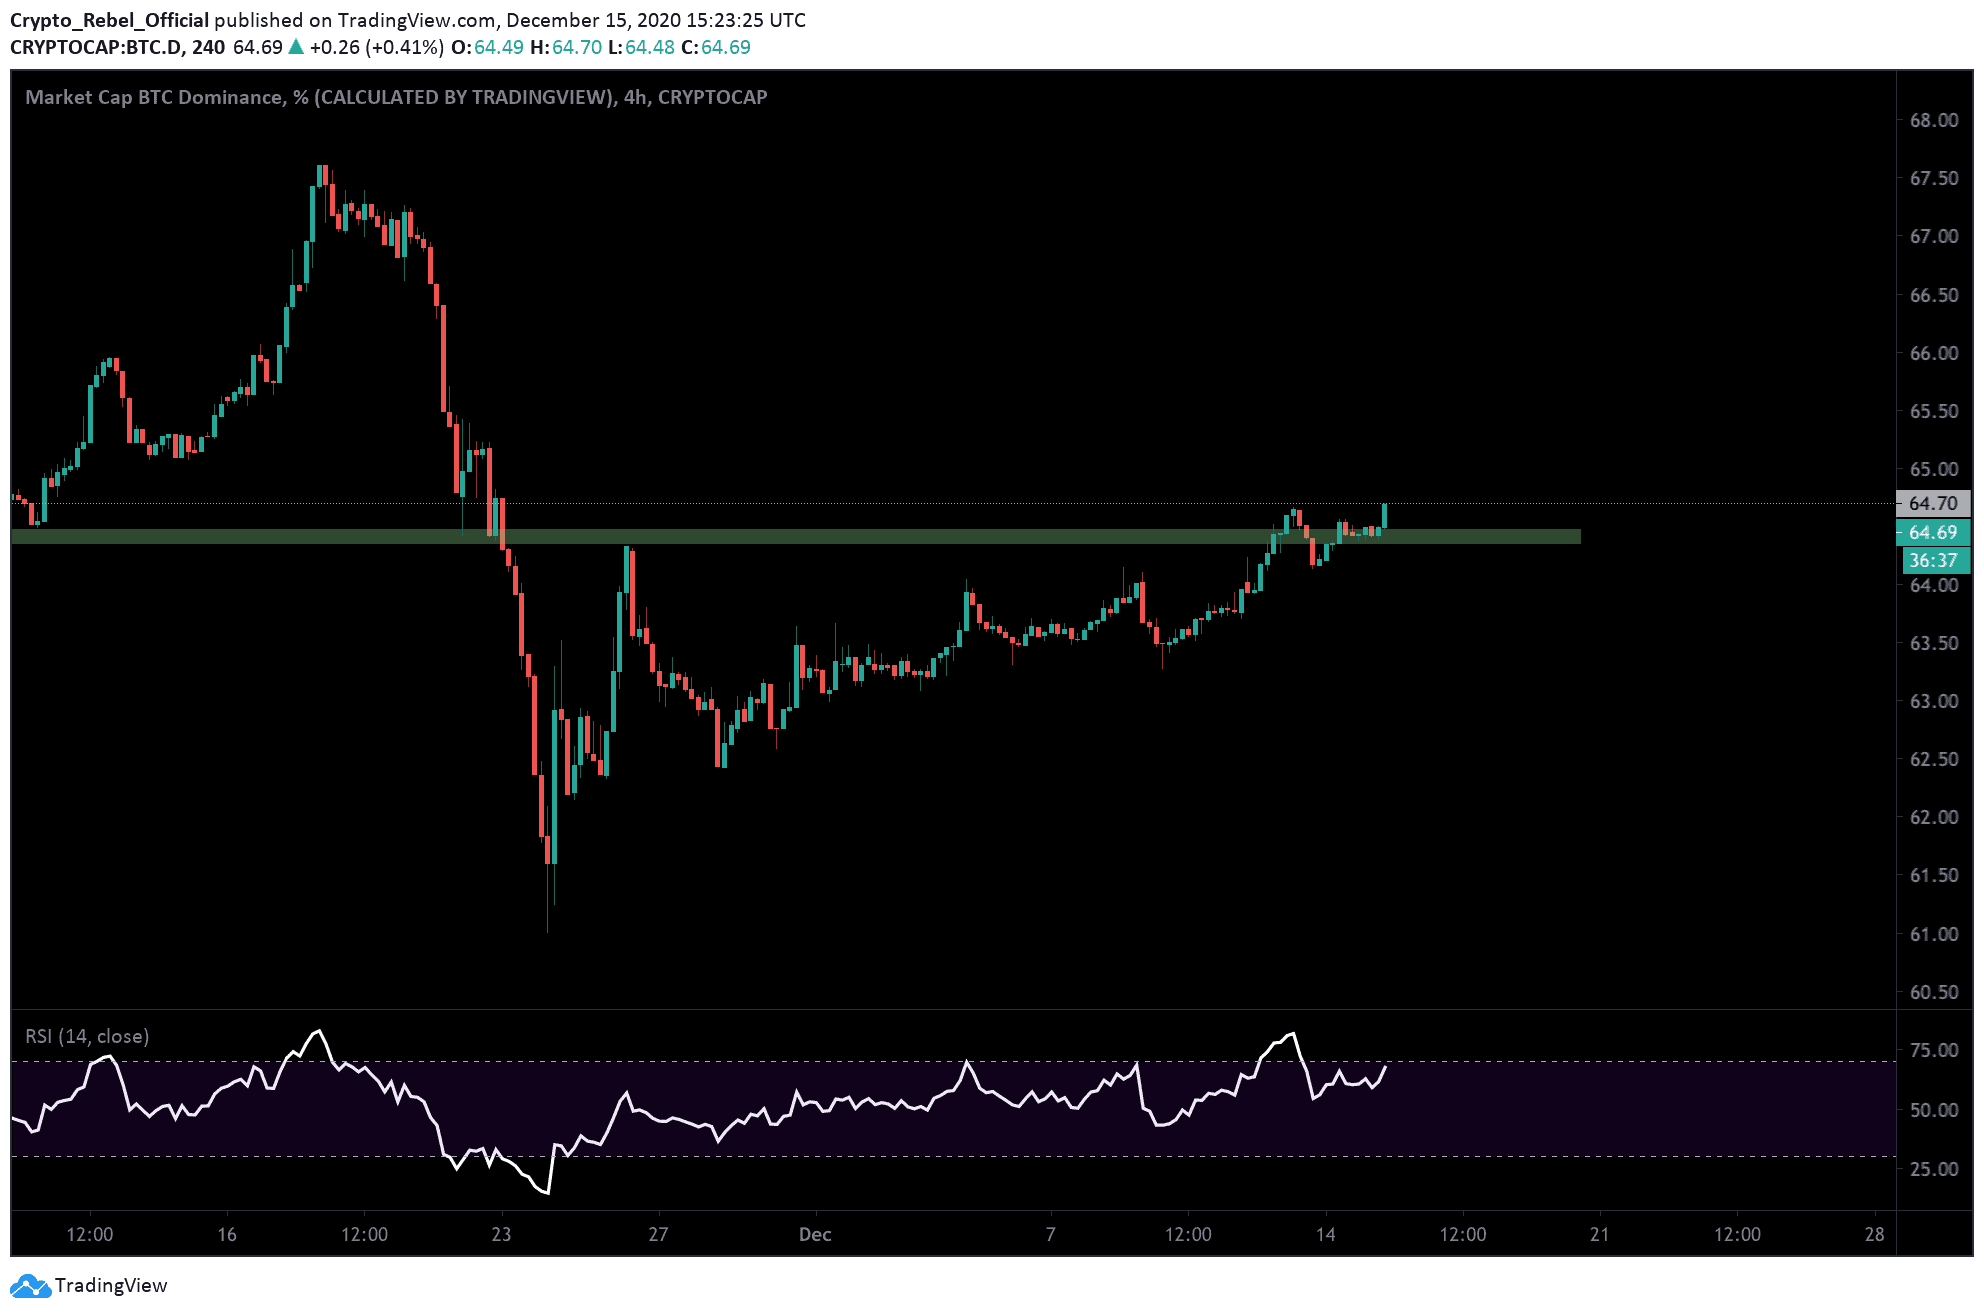
Despite these factors, Bitcoin dominance is now up at 64.7%, and testing levels not seen in over 22 days.
Price Levels to Watch in the Short-term
On the 4-hour BTC/USD chart, we will continue to watch the aforementioned range levels for any breakouts above or below.
It’s worth noting that there is a very subtle RSI divergence (yellow lines) in the current trend, with the indicator line printing a lower low while the price action sets a higher low. This seems to suggest that intraday momentum is favoring bearish traders despite BTC testing the $19.4K resistance at the moment.
If we see a breakout to the downside any time soon, then the $18,800 level will likely present our first area of support. From there, we have the key S/R level at $18,630, another support zone at $18,500, $18,300, and the psychological support at $18,000.
Above the current range resistance, the highest 4-hour close at $19,700 will likely be a key target for bulls to test in the short-term. The 0.618 Fibonacci extension level at $19,920 and the 0.786 Fibonacci extension level at $20,544 will also be critical levels to break above.
Total market capital: $574 billion.
Bitcoin market capital: $359 billion.
Bitcoin dominance: 62.7%
*Data by Coingecko.
Bitstamp BTC/USD 4-Hour Chart