Bitcoin has dramatically extended its losses today, as prices slide a further ,000 in under 24 hours. Yesterday, we observed how the leading asset was recovering along with the ,400 and expected it would push sideways before another big move arrived.Looking at the 4-Hour chart, we can see it did exactly that. Until the early hours of today, BTC was hugging tightly along the prior support zone (green) until another huge wave of selling pressure arrived and drove prices down to ,225 (0.618 Fibonacci extension level).During the second leg of the crash, panic selling managed to drive BTC prices through the psychological ,000, and down as far as the ,450 level, before correcting.According to data by Coinmarketcap, an additional billion has been removed from the global crypto
Topics:
Ollie Leech considers the following as important: Bitcoin (BTC) Price, BTC Analysis, BTCEUR, BTCGBP, btcusd, btcusdt
This could be interesting, too:
Chayanika Deka writes XRP, SOL, and ADA Inclusion in US Crypto Reserve Pushes Traders on Edge
Chayanika Deka writes Why Arthur Hayes Is Bullish on Bitcoin Under Trump’s Economic Strategy
Mandy Williams writes Why the Bitcoin Market Is Stuck—and the Key Metric That Could Change It: CryptoQuant CEO
Wayne Jones writes Metaplanet Acquires 156 BTC, Bringing Total Holdings to 2,391
Bitcoin has dramatically extended its losses today, as prices slide a further $1,000 in under 24 hours. Yesterday, we observed how the leading asset was recovering along with the $11,400 and expected it would push sideways before another big move arrived.
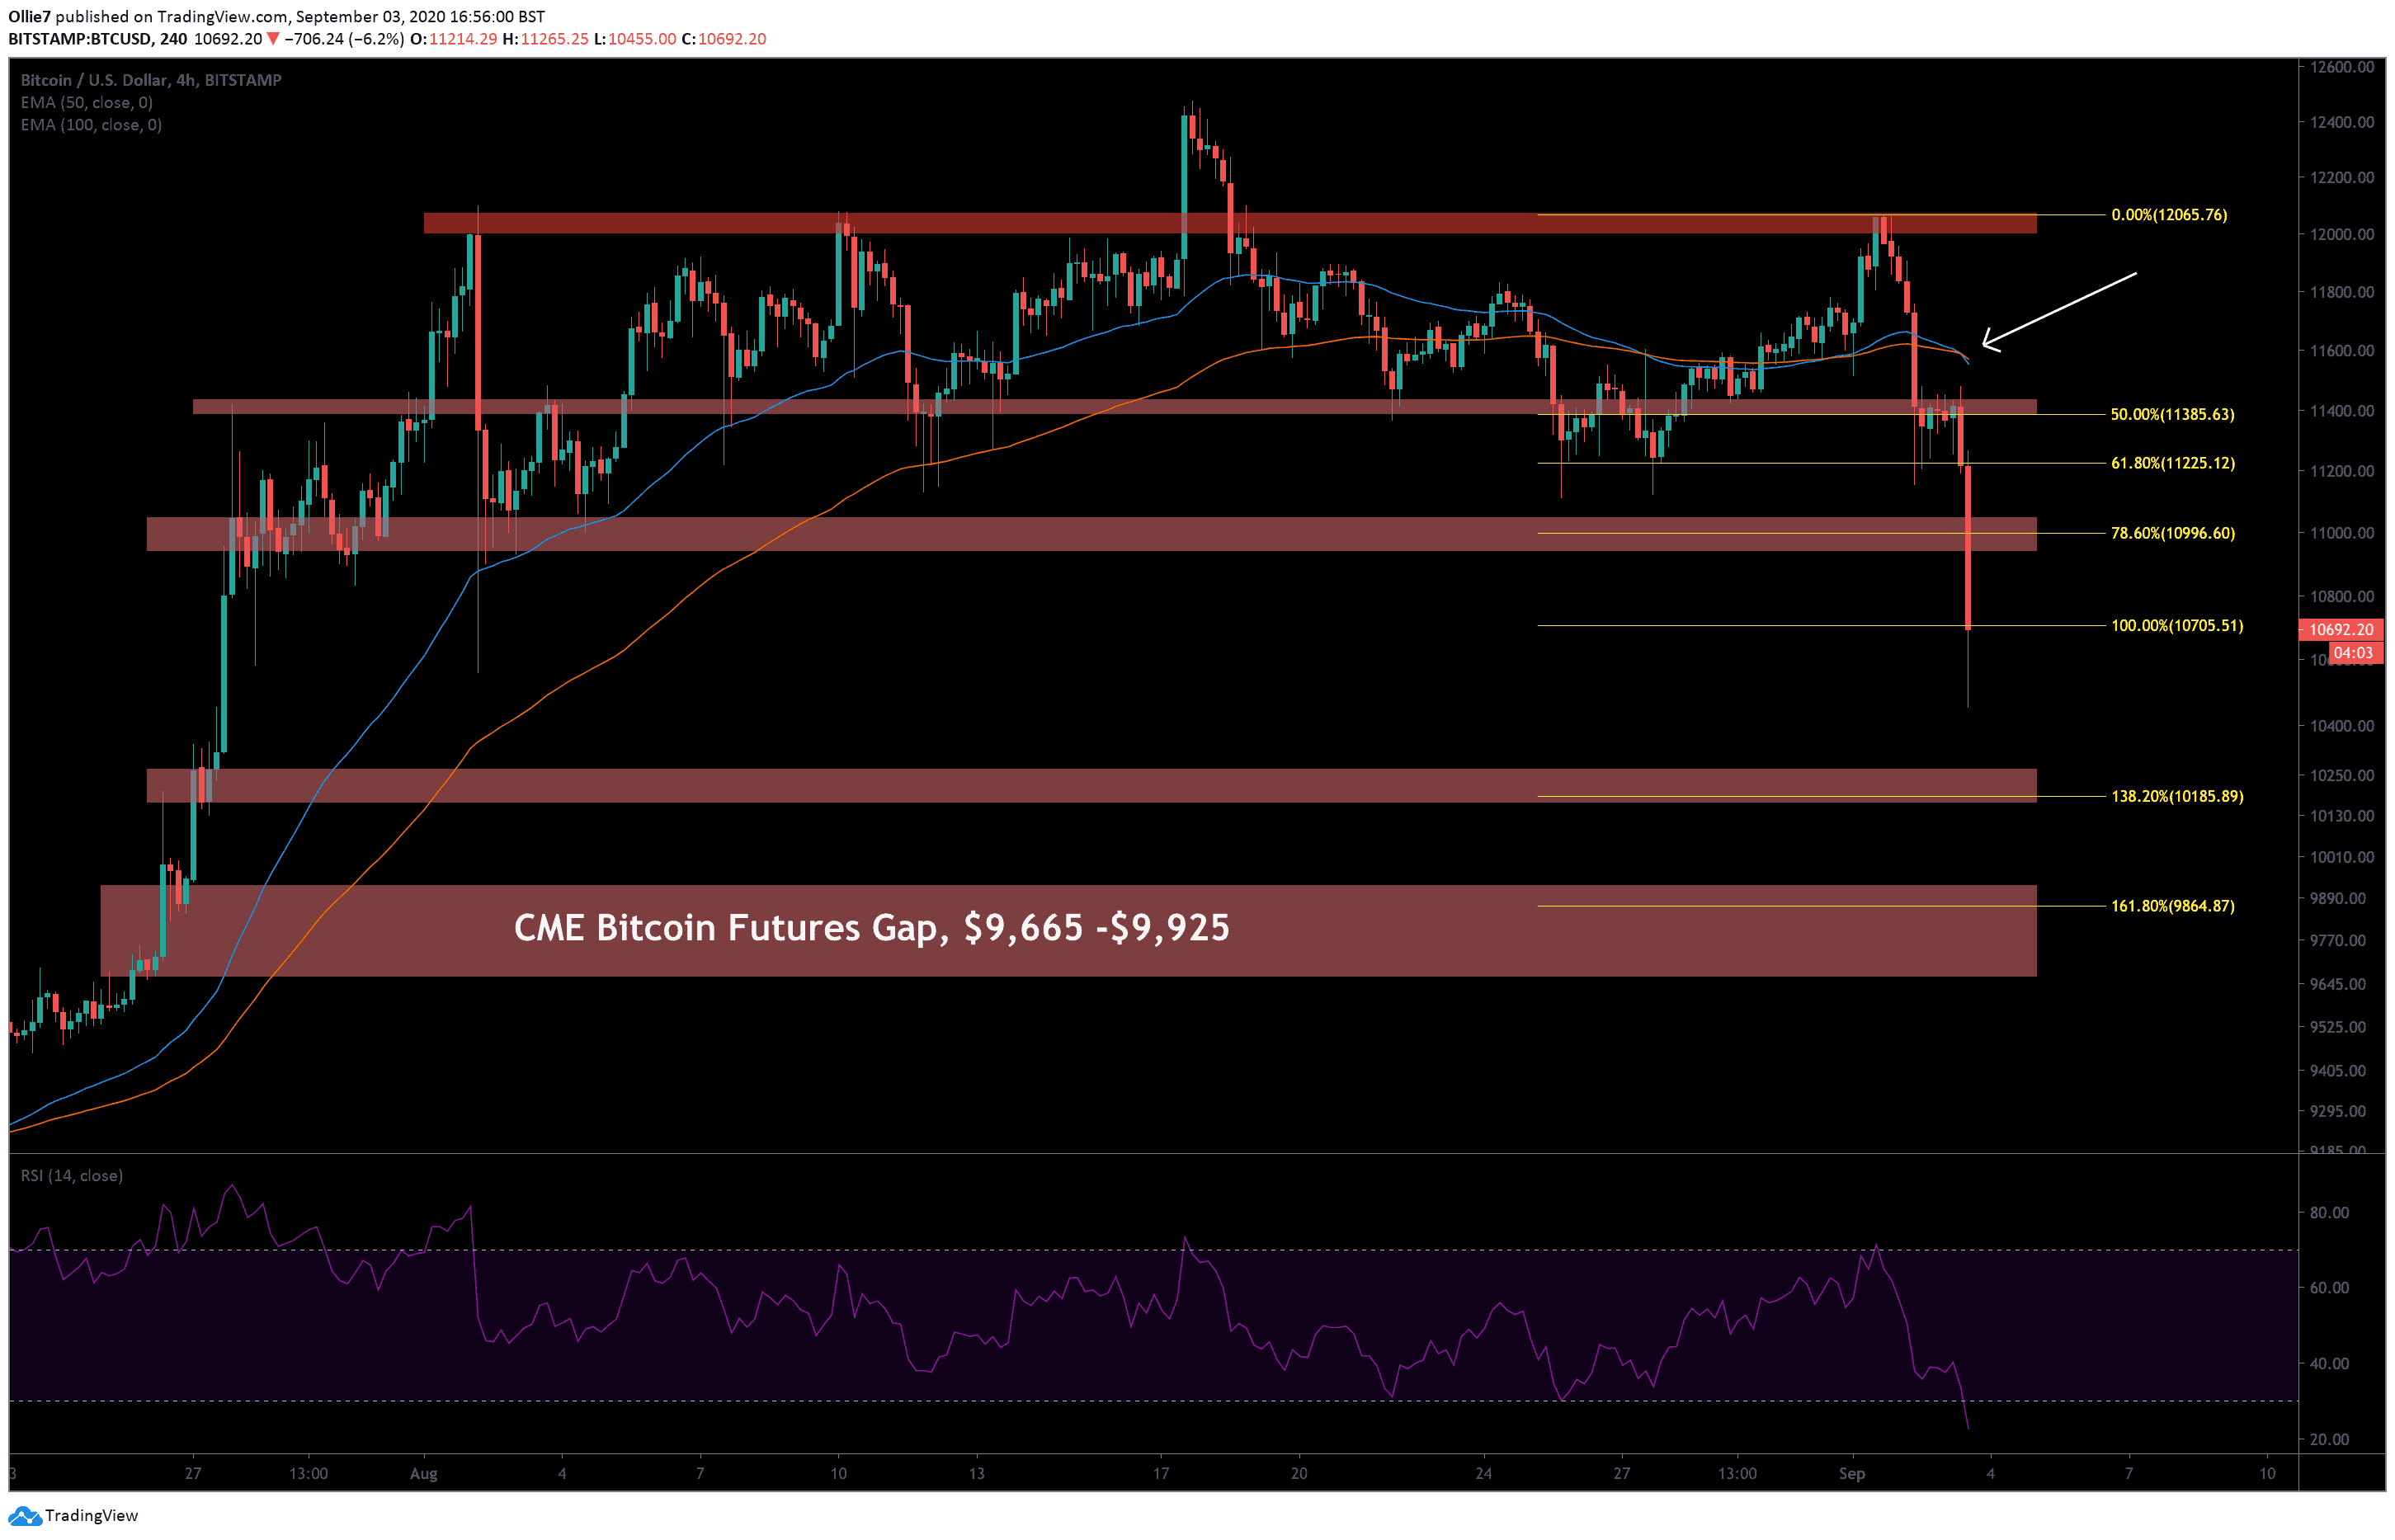
Looking at the 4-Hour chart, we can see it did exactly that. Until the early hours of today, BTC was hugging tightly along the prior support zone (green) until another huge wave of selling pressure arrived and drove prices down to $11,225 (0.618 Fibonacci extension level).
During the second leg of the crash, panic selling managed to drive BTC prices through the psychological $11,000, and down as far as the $10,450 level, before correcting.
According to data by Coinmarketcap, an additional $28 billion has been removed from the global crypto market today – down $45 billion in total from the latest peak of $394 billion on September 1.

BTC Price Levels to Watch in the Short-term
On the 4-Hour BTC/USD chart, we can see that the leading crypto asset is currently perching along the 1.0 Fibonacci extension level. A huge amount of indecision is driving the market right now, which makes it difficult to predict where Bitcoin will head next.
The next logical support is the order block zone around $10,200 – $10,175, which also lines up with the 1.382 Fibonacci extension level. But if prices land here, then it’s very likely that we’ll see a break back under 5 figures as more traders sell in anticipation of the CME Bitcoin futures gap filling.
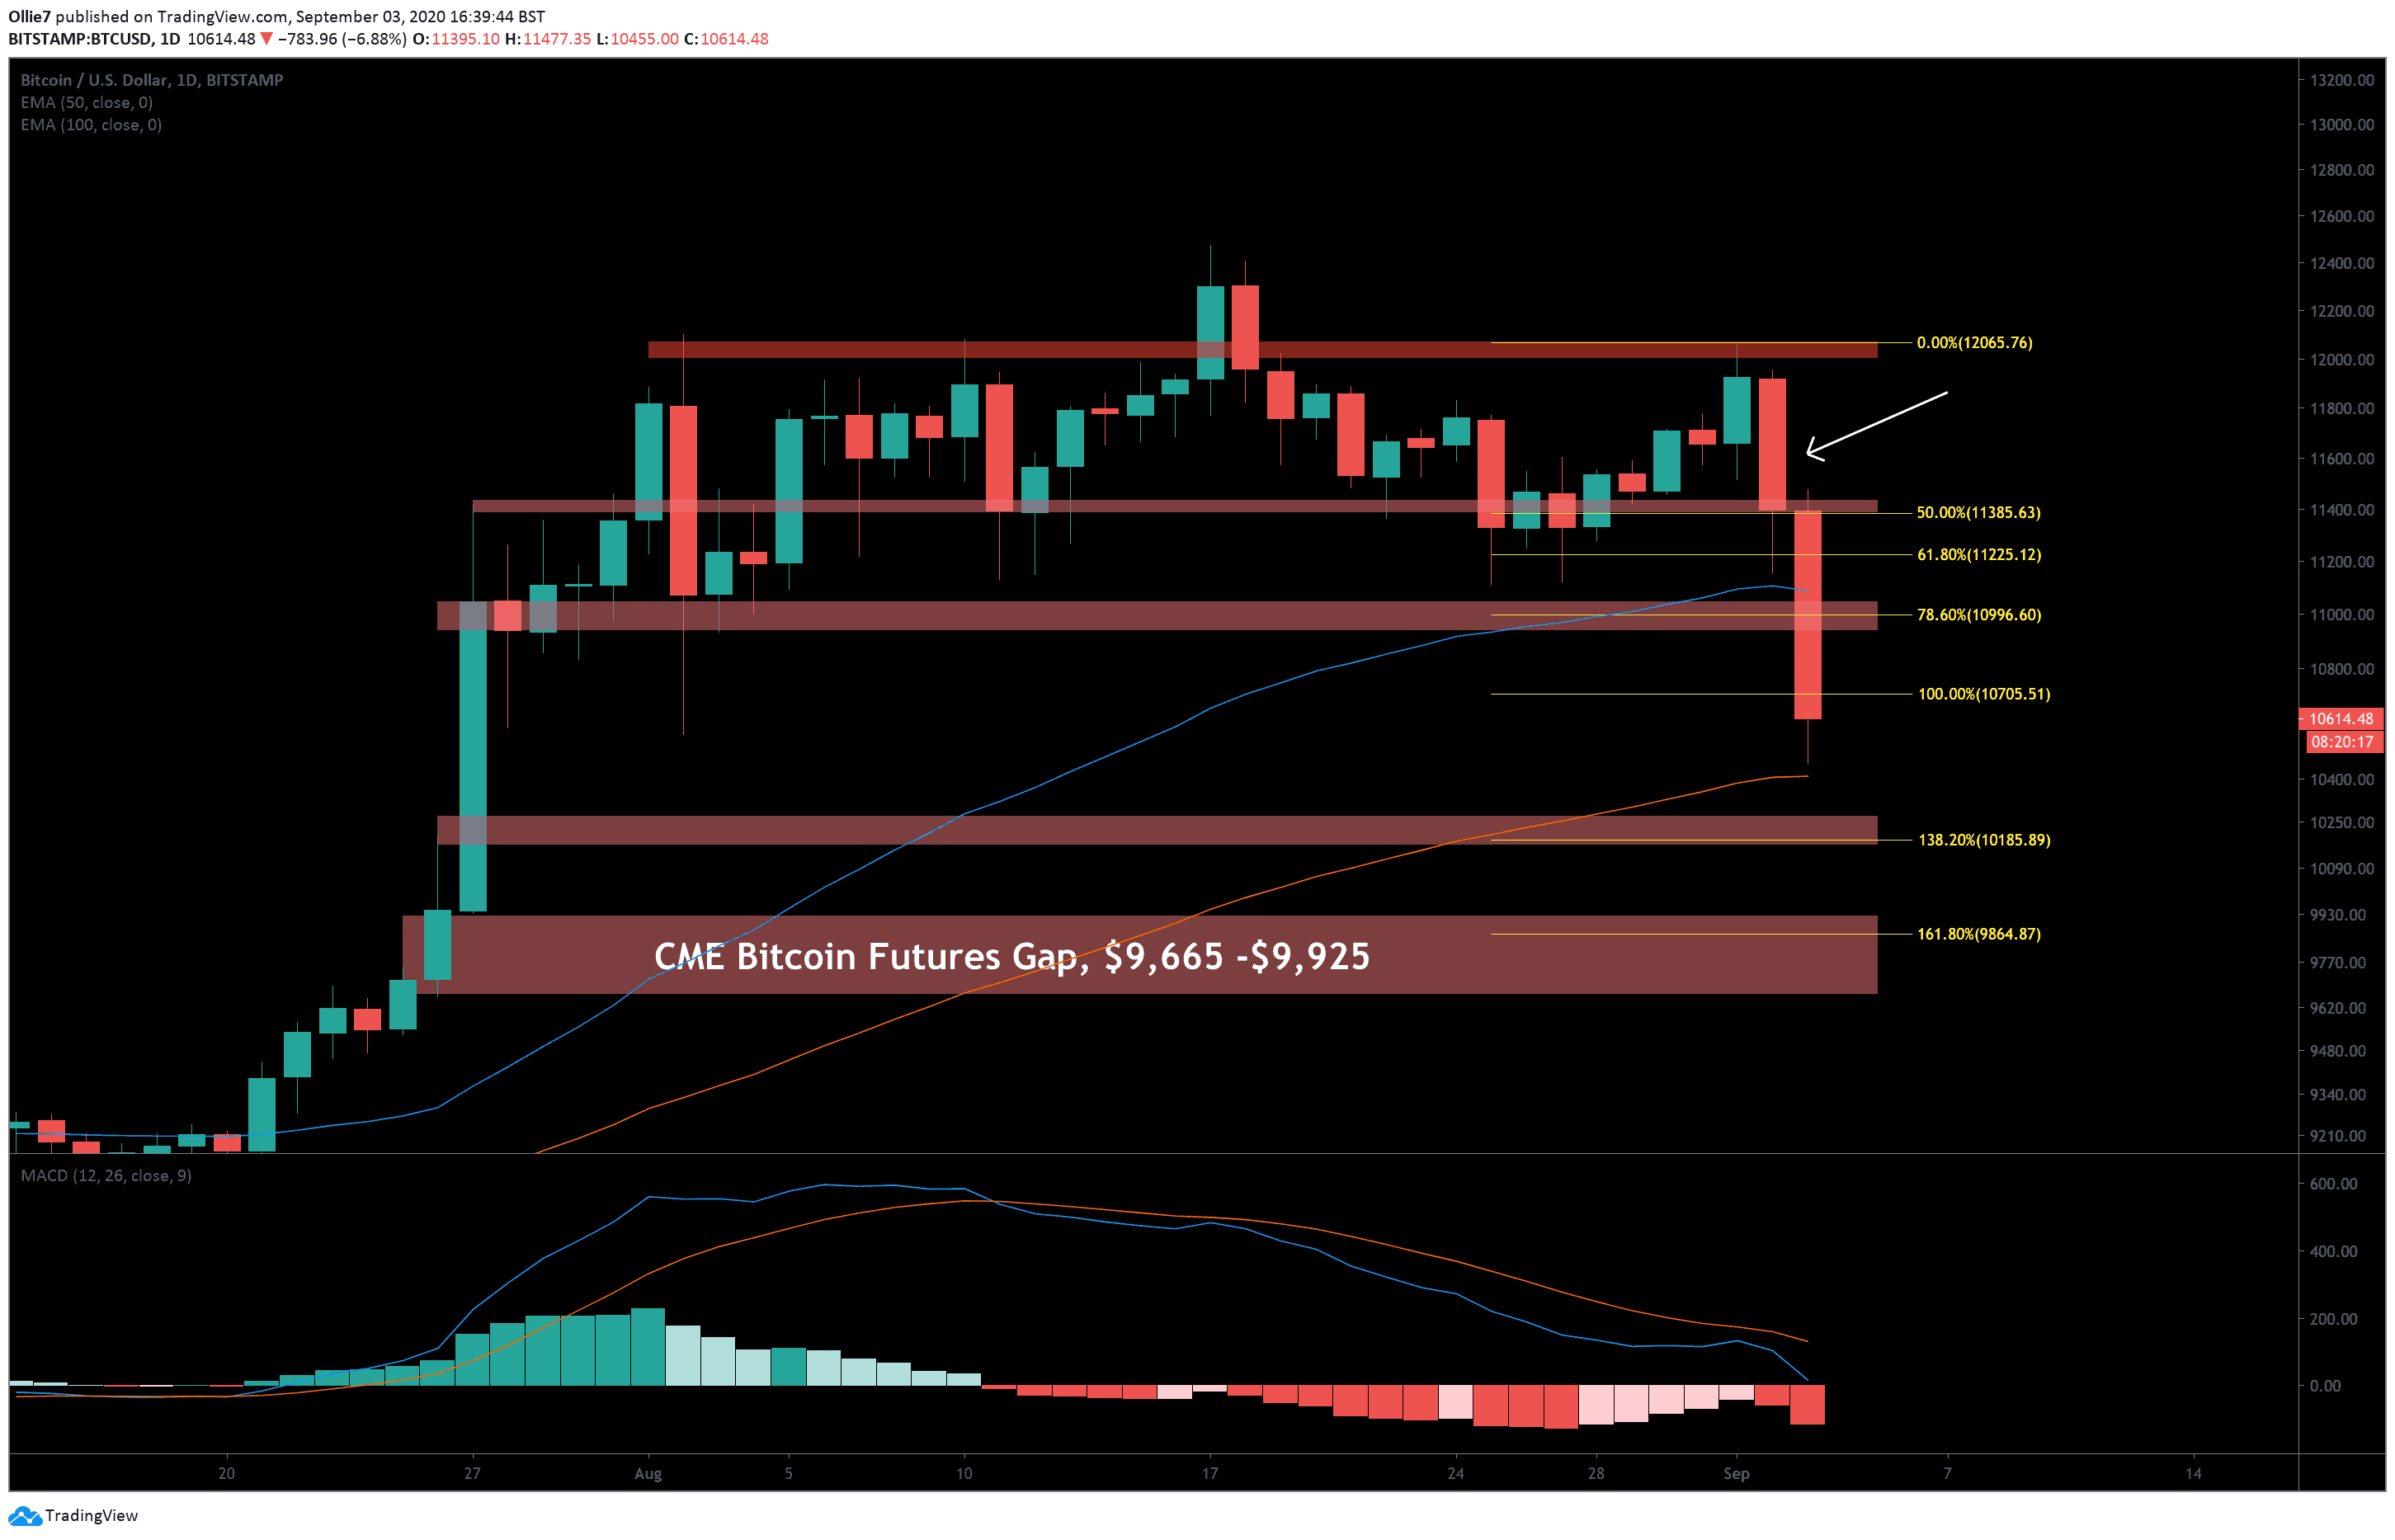
On the daily chart, we can see that the 100 EMA line (red) was able to catch the wick of the most recent downtrend leg and assist bulls in launching a recovery, as of writing these lines. This will continue to be one of the main supports that should be observed as Bitcoin attempts to stabilize.
If the $10,000 level is broken, we should expect the gap to fill, followed by a possible strong rebound back towards $10,600 and $11,000.
A decline as low as $10K would most likely send Bitcoin into the oversold region of the daily RSI for the first time since the huge Coronavirus-fuelled crash in March. This would send a huge buy signal to Bitcoin traders and undoubtedly trigger a vast number of trading bots, which would help initiate the trend reversal.
Looking above, if the 1.0 Fibonacci extension level holds, the $11,000 could create the first area of resistance, followed by the daily 50 EMA (blue), and the $11,400 level.
Total market capital: $358 billion
Bitcoin market capital: $197 billion
Bitcoin dominance: 55.2%
Bitstamp BTC/USD Daily Chart

