After a freefall that led to an almost 00 drop, Bitcoin’s price is showing signs of stability. From a March vs. September BTC price action comparison chart, however, it’s possible that the pain is just beginning.Why Did Bitcoin Price Crash Last Week?Several possible reasons can be attributed to Bitcoin’s near 20 percent crash. Miner selloff is one of the strongest possibilities, as suggested by CryptoQuant. After the price drop, the on-chain/data provider shared statistics that pointed to big Bitcoin miners like Poolin, Slush, etc. offloading their BTC stash for cash on exchanges:Miners are moving unusually large amounts of #BTC since yesterday. #Poolin, #Slush, #HaoBTC have taken the bitcoins out of the mining wallets and sent some to the exchange.https://t.co/NcLmXvZmOD
Topics:
Himadri Saha considers the following as important: AA News, Bitcoin (BTC) Price, BTCEUR, BTCGBP, btcusd, btcusdt
This could be interesting, too:
Chayanika Deka writes Yuga Labs Secures Major Win as SEC Closes Investigation Without Charges
Andrew Throuvalas writes Bitcoin Soars Back To ,000 After BlackRock CEO Says “Buy The Dip”
Chayanika Deka writes XRP, SOL, and ADA Inclusion in US Crypto Reserve Pushes Traders on Edge
Chayanika Deka writes Why Arthur Hayes Is Bullish on Bitcoin Under Trump’s Economic Strategy
After a freefall that led to an almost $2000 drop, Bitcoin’s price is showing signs of stability. From a March vs. September BTC price action comparison chart, however, it’s possible that the pain is just beginning.
Why Did Bitcoin Price Crash Last Week?
Several possible reasons can be attributed to Bitcoin’s near 20 percent crash. Miner selloff is one of the strongest possibilities, as suggested by CryptoQuant. After the price drop, the on-chain/data provider shared statistics that pointed to big Bitcoin miners like Poolin, Slush, etc. offloading their BTC stash for cash on exchanges:
Miners are moving unusually large amounts of #BTC since yesterday. #Poolin, #Slush, #HaoBTC have taken the bitcoins out of the mining wallets and sent some to the exchange.https://t.co/NcLmXvZmOD pic.twitter.com/N3E3mX4QKn
— CryptoQuant (@cryptoquant_com) September 3, 2020
The Wall Street crash may have also triggered last week’s Bitcoin market selloff. Major US stock indices like the S&P 500, Nasdaq, and the Dow Jones Industrial Average nosedived significantly. Since BTC is closely correlated to stocks, the effect inadvertently trickled into crypto markets.
Traders and investors supposedly switched positions to cash from equities and BTC/crypto, following the US Dollar’s epic rally.
Comparison Chart Casts Signs of Trouble
A chart comparing the price action of Bitcoin during the Black Thursday crash in mid-March 2020 and the latest one reveals some worrying signs.
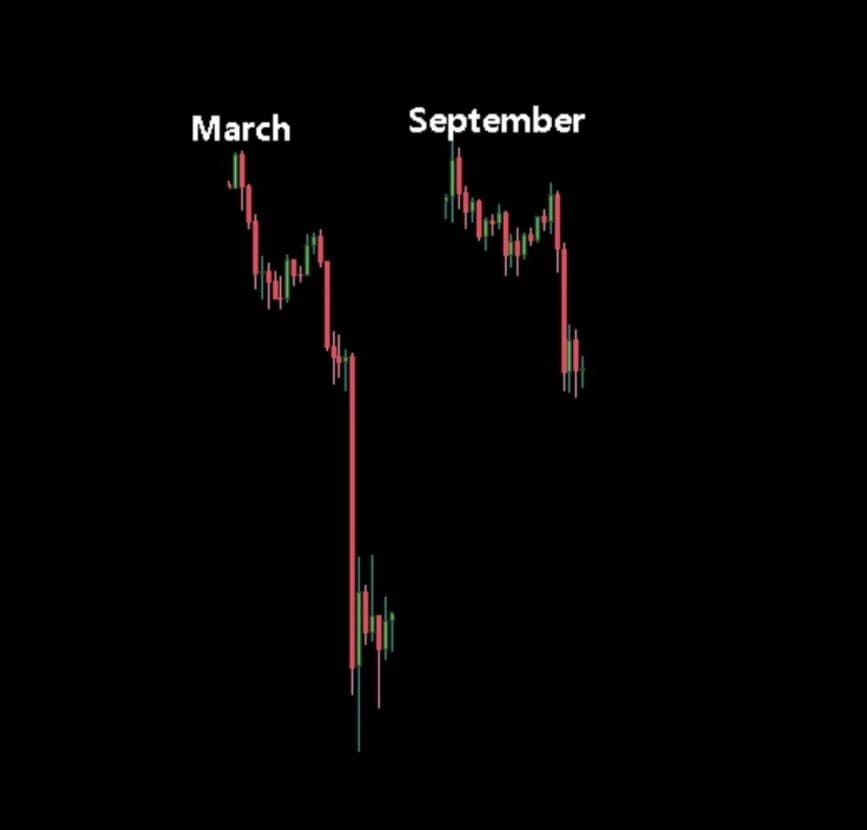
Back in March, the cryptocurrency market collapsed, as Bitcoin was reduced down to $3,600. Of course, it recovered fairly quickly alongside global stock markets. Yet, the sharp declines left many investors liquidated as no one imagined a steep decline of this magnitude.
Bitcoin is looking rather shaky and, at the time of this writing, it has dropped below the critical support of $10,000. There’s a CME gap below that’s waiting to be filled and many believe that this is where its price is headed.
Bullish Bias Also Exists
Although BTC price action does seem choppy at the time of writing, some crypto analysts think that the worst is behind us. Reputed analyst Josh Rager said that the latest crash was the biggest since March, something that was much required.
However, commenting on the possibility of Bitcoin’s dip to the $8500 level (around a 30 percent drop), Josh said it doesn’t look like that. Agreeing with the presence of strong support around the $10,000 mark, he said that BTC has fewer chances of closing down below $10k.
Yeah it would have to be a wick, I cant see price closing down there on teh weekly, intrada wick makes sense
— Josh Rager ? (@Josh_Rager) September 6, 2020