XRP fell by a steep 16.8% over the past week as the coin reached %excerpt%.234 today.XRP continued its decline as it broke beneath the strong support at %excerpt%.237.Against Bitcoin, XRP dropped below the 100-days EMA today.XRP/USD – Bears Push Toward .618 Fib SupportKey Support Levels: %excerpt%.228, %excerpt%.22, %excerpt%.216.Key Resistance Levels: %excerpt%.24, %excerpt%.246, %excerpt%.25XRP had a disastrous first week in September as it rolled over from above %excerpt%.3 to reach the current %excerpt%.233 level. During the decline, it initially managed to find support at the 100-day EMA at around %excerpt%.24. However, this level was penetrated over the weekend as the bears pushed into the %excerpt%.237 level (downside 1.618 Fib Extension).The bulls managed to defend %excerpt%.237 during the weekend as they closed each daily candle above it. Today, however, the sellers
Topics:
Yaz Sheikh considers the following as important: Ripple (XRP) Analysis, XRP Analysis, xrpbtc, xrpusd
This could be interesting, too:
Jordan Lyanchev writes Ripple’s (XRP) Surge to Triggers Over Million in Short Liquidations
Jordan Lyanchev writes Trump Confirms Work on Strategic Crypto Reserve: XRP, ADA, SOL Included
Dimitar Dzhondzhorov writes Is a Major Ripple v. SEC Lawsuit Development Expected This Week? Here’s Why
Dimitar Dzhondzhorov writes Ripple Whales Go on a Selling Spree: Is XRP Headed for a Further Correction?
- XRP fell by a steep 16.8% over the past week as the coin reached $0.234 today.
- XRP continued its decline as it broke beneath the strong support at $0.237.
- Against Bitcoin, XRP dropped below the 100-days EMA today.
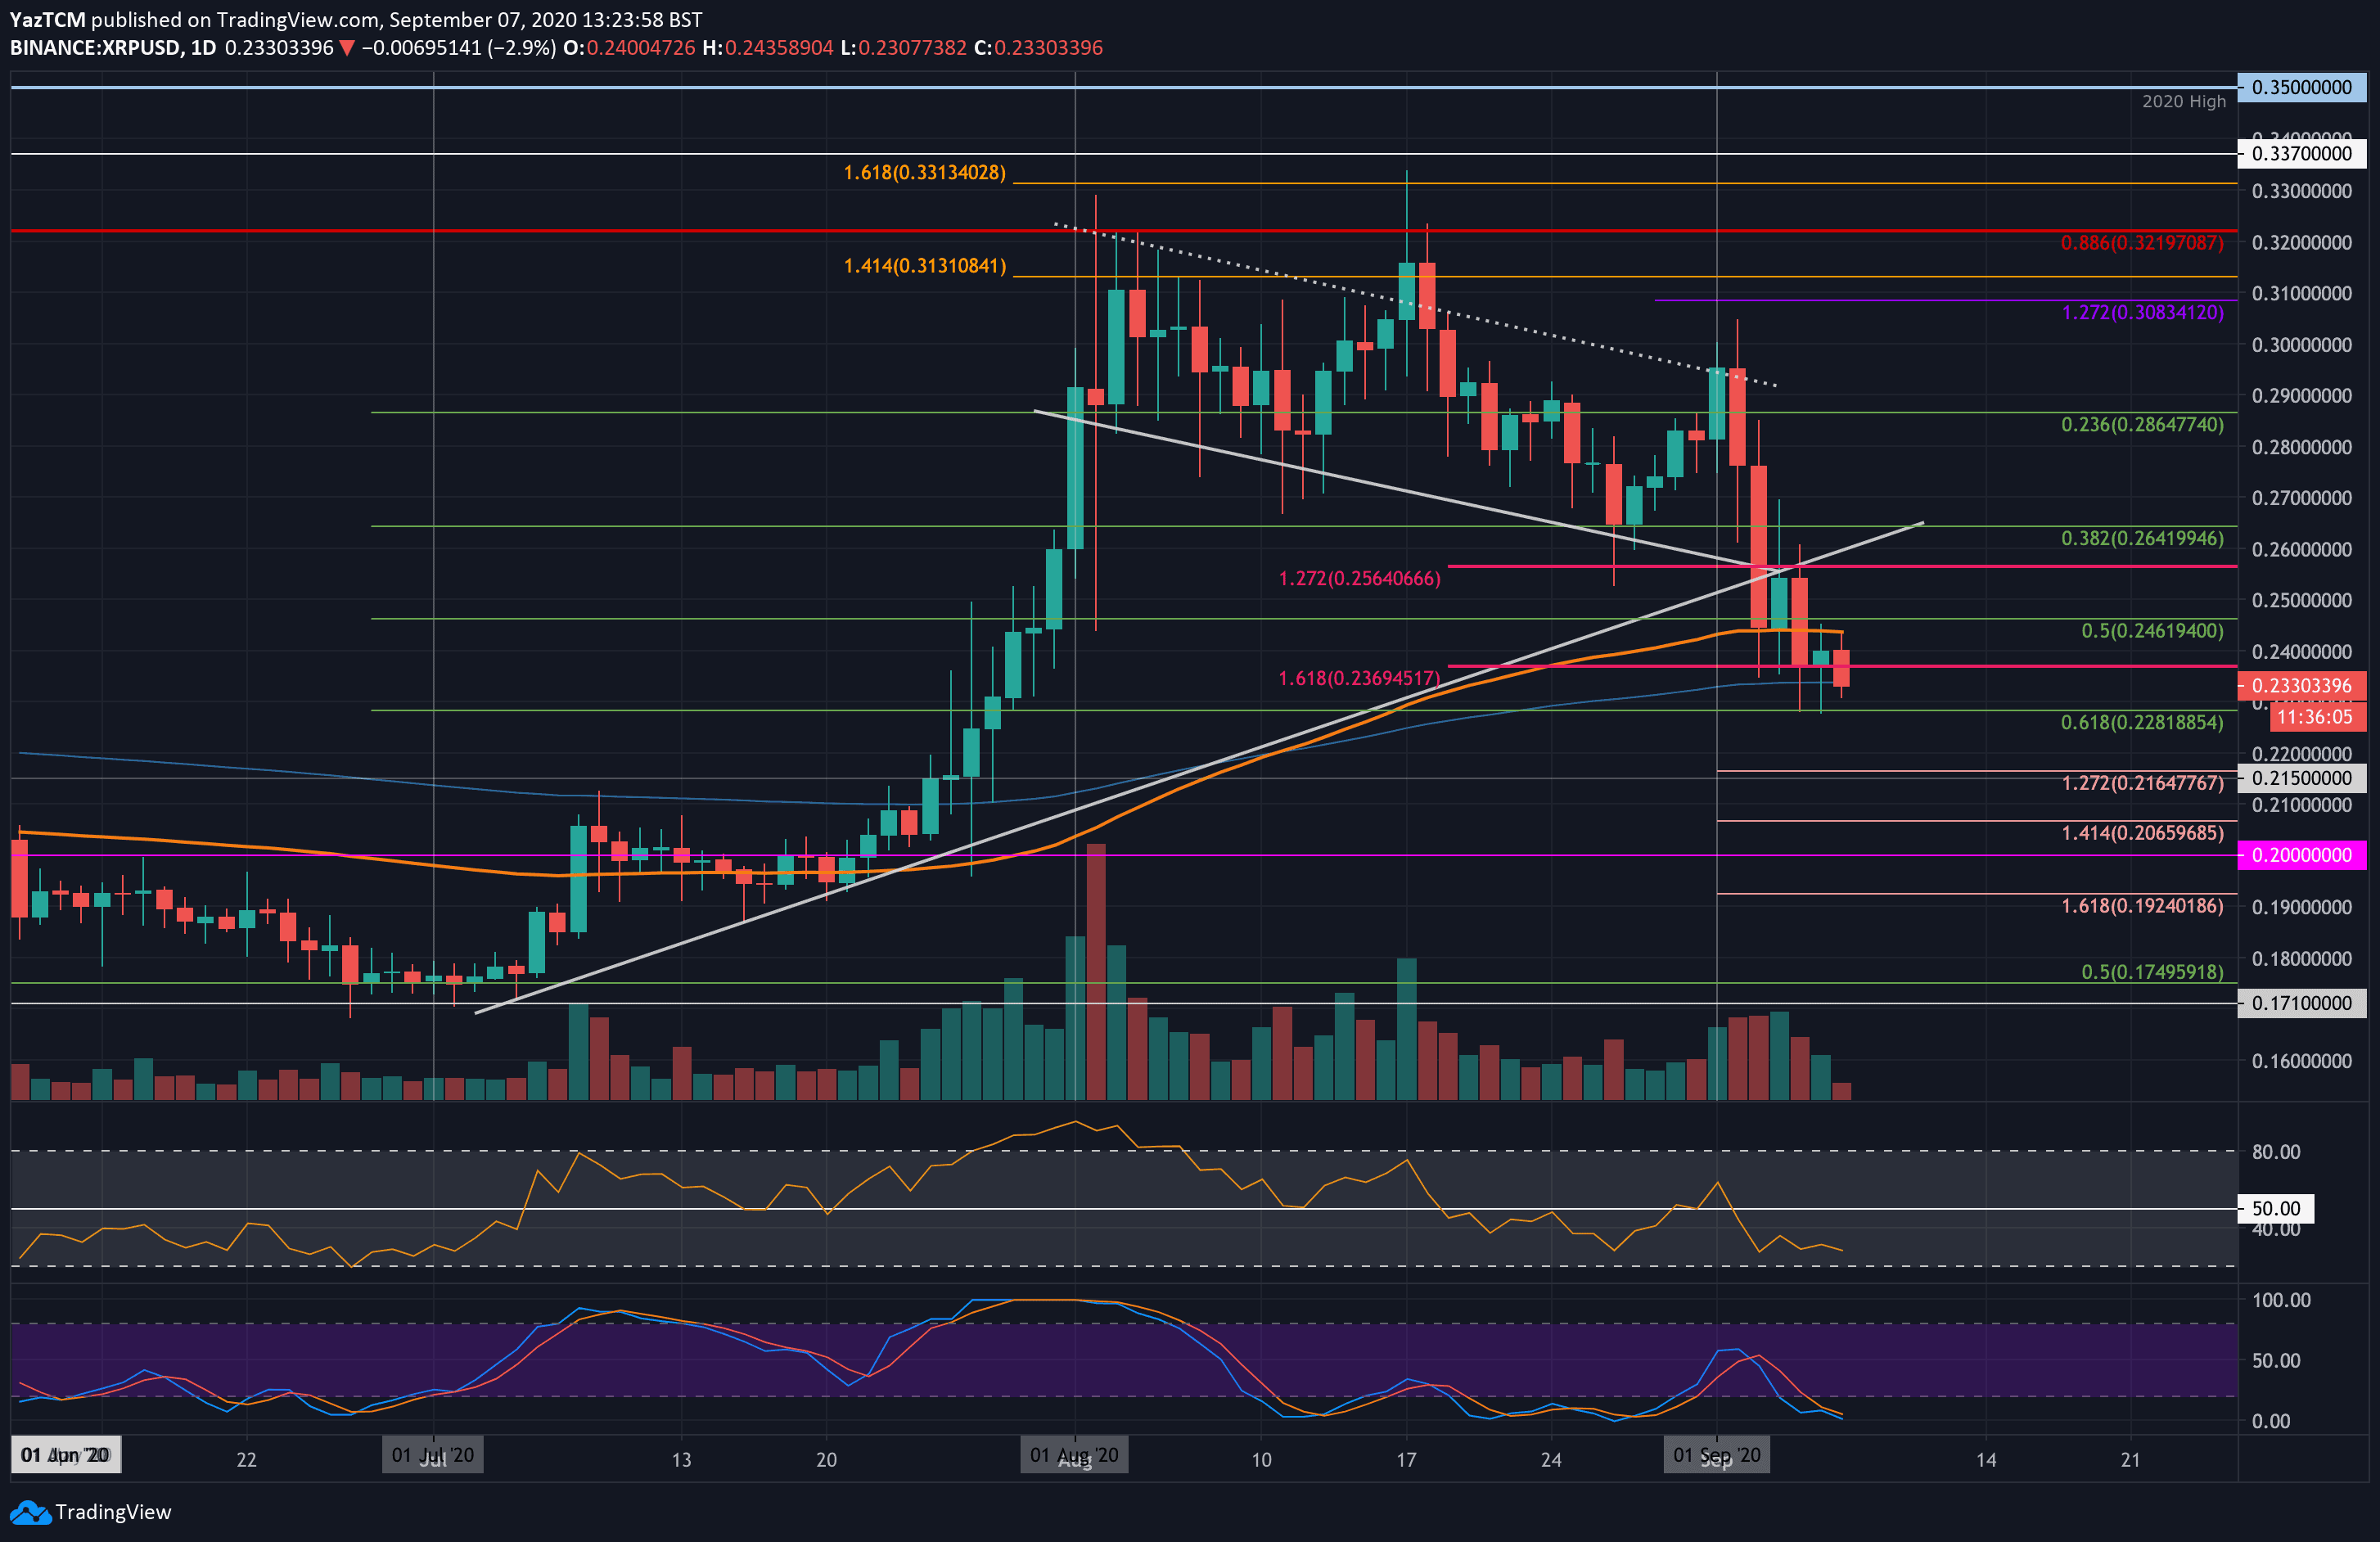
XRP/USD – Bears Push Toward .618 Fib Support
Key Support Levels: $0.228, $0.22, $0.216.
Key Resistance Levels: $0.24, $0.246, $0.25
XRP had a disastrous first week in September as it rolled over from above $0.3 to reach the current $0.233 level. During the decline, it initially managed to find support at the 100-day EMA at around $0.24. However, this level was penetrated over the weekend as the bears pushed into the $0.237 level (downside 1.618 Fib Extension).
The bulls managed to defend $0.237 during the weekend as they closed each daily candle above it. Today, however, the sellers broke beneath this support as they head lower toward the .618 Fib Retracement at $0.228.
XRP-USD Short Term Price Prediction
The first level of support lies at $0.228 (.618 Fib Retracement). Beneath this, support lies at $0.22, $0.216 (downside 1.272 Fib Extension), $0.207 (downside 1.414 Fib Extension), and $0.2.
On the other side, resistance lies at $0.24 (100-days EMA), $0.246, and $0.25.
The RSI is reaching extreme oversold conditions as the selling momentum mounts. The Stochastic RSI is in oversold conditions as we wait for a bullish crossover signal to indicate a potential rebound.
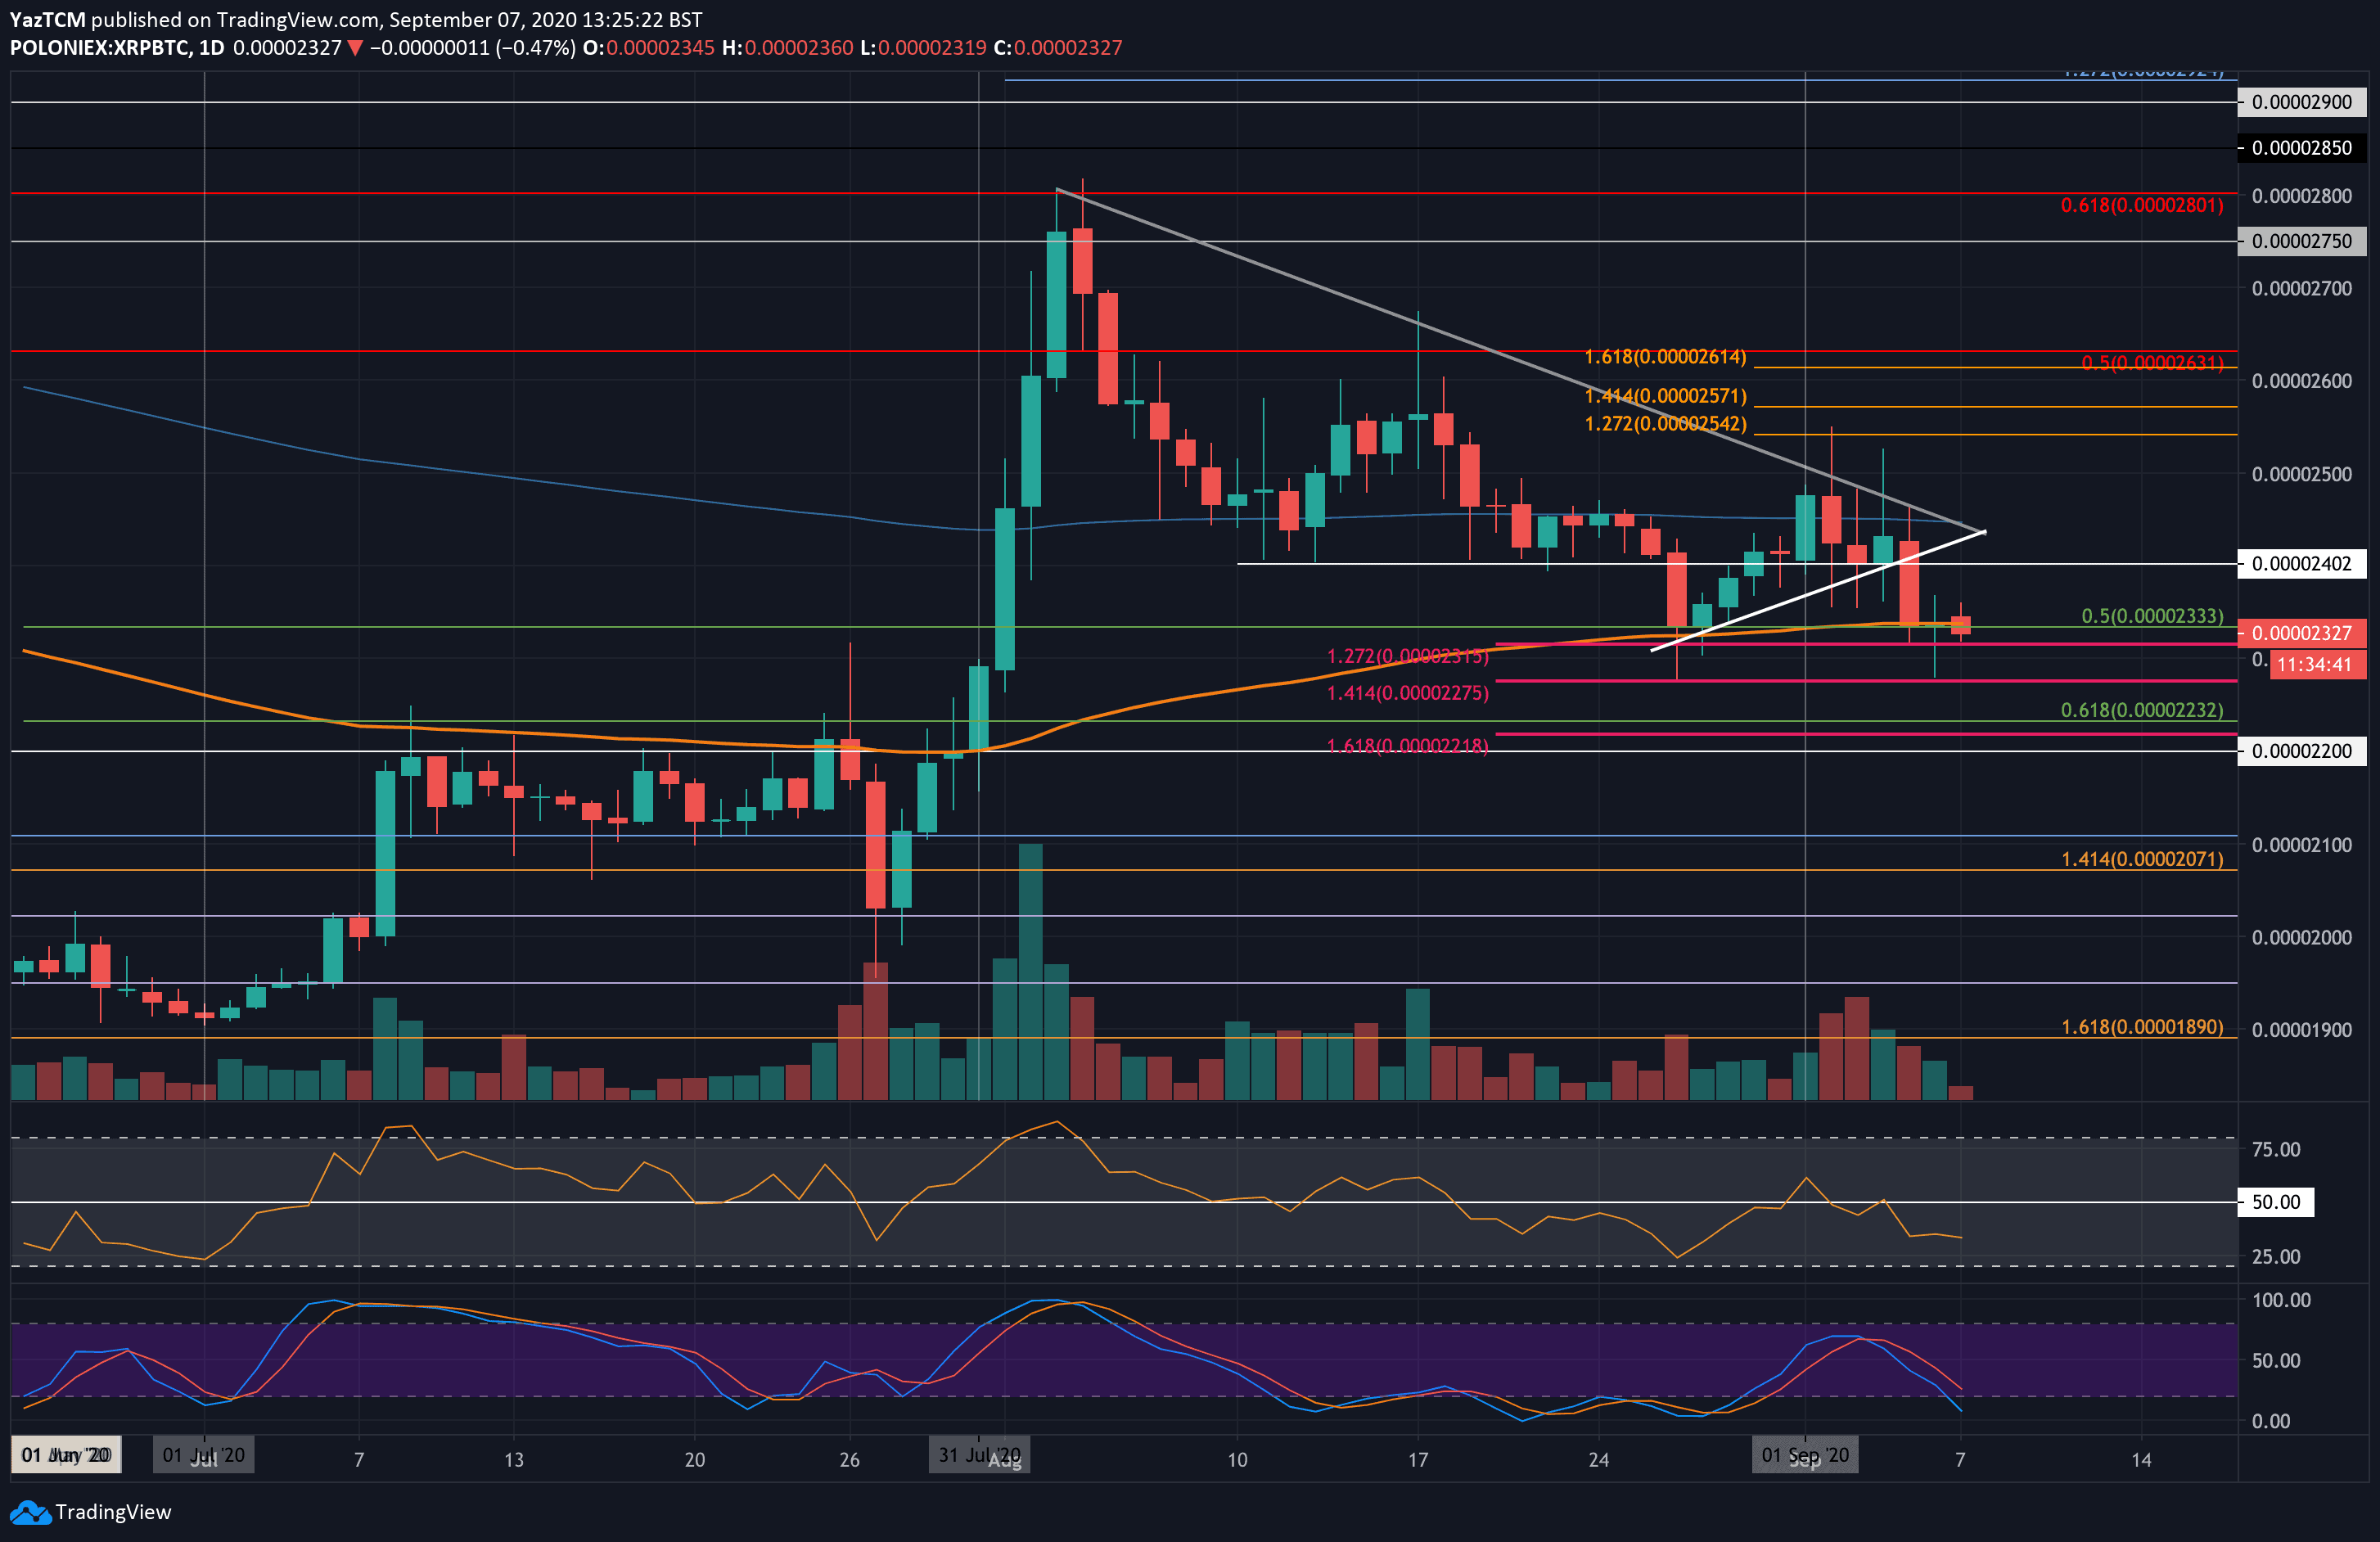
XRP/BTC – XRP Falls Beneath 100-days EMA
Key Support Levels: 2315 SAT, 2275 SAT, 2230 SAT.
Key Resistance Levels: 2333 SAT, 2400 SAT, 2450 SAT.
XRP has also been suffering against Bitcoin, although not as heavily. During the weekend, the coin fell beneath a rising trend line as it crashed into the support at 2333 SAT (.5 Fib Retracement & 100-days EMA).
Yesterday, XRP spiked lower to reach 2275 SAT, but the buyers quickly regrouped to close the candle at the 100-days EMA. Today, it seems that the sellers are attempting to head lower as they break the 100-days EMA to reach the current 2325 SAT level.
XRP-BTC Short Term Price Prediction
If the sellers push lower, the first level of support lies at 2315 SAT. This is followed by support at 2275 SAT (downside 1.414 Fib Extension), 2232 SAT (.618 Fib Retracement), and 2200 SAT. Added support lies at 2100 SAT.
On the other side, the first level of resistance lies at the 100-days EMA. Above this, resistance lies at 2400 SAT, and 2450 SAT (200-days EMA).