LINK has found strong support at the January opening price of .72.The cryptocurrency has dropped by a steep 64% from the March high of .02.It is finding support at 0.000345 BTC against Bitcoin as the buyers try to defend the area.Key Support & Resistance LevelsLINK/USD:Support: .72, .60, .50.Resistance: .00, .20, .40.LINK/BTC:Support:0.000346 BTC, 0.000332 BTC, 0.00032 BTC.Resistance: 0.000367 BTC, 0.00038 BTC, 0.00038 BTC..LINK/USD: Creates Fresh 5-month Low After Market WipeoutLINK dopped by a steep 64% since rolling over at the March high of .02. It found support at .72, which is the January low-day closing price as the buyers attempt to prevent further declines. If .72 breaks, the cryptocurrency is likely to head beneath .50.Chainlink had found support at .00
Topics:
Yaz Sheikh considers the following as important: Chainlink (LINK) Price, Price Analysis
This could be interesting, too:
Chayanika Deka writes Chainlink’s MVRV Ratio Signals Selling Exhaustion: What’s Next for LINK?
Chayanika Deka writes Whale and Shark Activity Pushes Chainlink (LINK) Past For the First Time in 37 Months
Mandy Williams writes Reasons Behind Chainlink’s (LINK) Recent Price Breakout, Can it Go Higher?
CryptoVizArt writes ETH’s Path to K Involves Maintaining This Critical Support (Ethereum Price Analysis)
- LINK has found strong support at the January opening price of $1.72.
- The cryptocurrency has dropped by a steep 64% from the March high of $5.02.
- It is finding support at 0.000345 BTC against Bitcoin as the buyers try to defend the area.
Key Support & Resistance Levels
LINK/USD:
Support: $1.72, $1.60, $1.50.
Resistance: $2.00, $2.20, $2.40.
LINK/BTC:
Support:0.000346 BTC, 0.000332 BTC, 0.00032 BTC.
Resistance: 0.000367 BTC, 0.00038 BTC, 0.00038 BTC..
LINK/USD: Creates Fresh 5-month Low After Market Wipeout
LINK dopped by a steep 64% since rolling over at the March high of $5.02. It found support at $1.72, which is the January low-day closing price as the buyers attempt to prevent further declines. If $1.72 breaks, the cryptocurrency is likely to head beneath $1.50.
Chainlink had found support at $2.00 during the cryptocurrency bloodbath last week. However, it broke beneath this 3-days ago to drop into the $1.72 support level.
The cryptocurrency is now ranked in the 16th position as it holds a $636 million market cap.
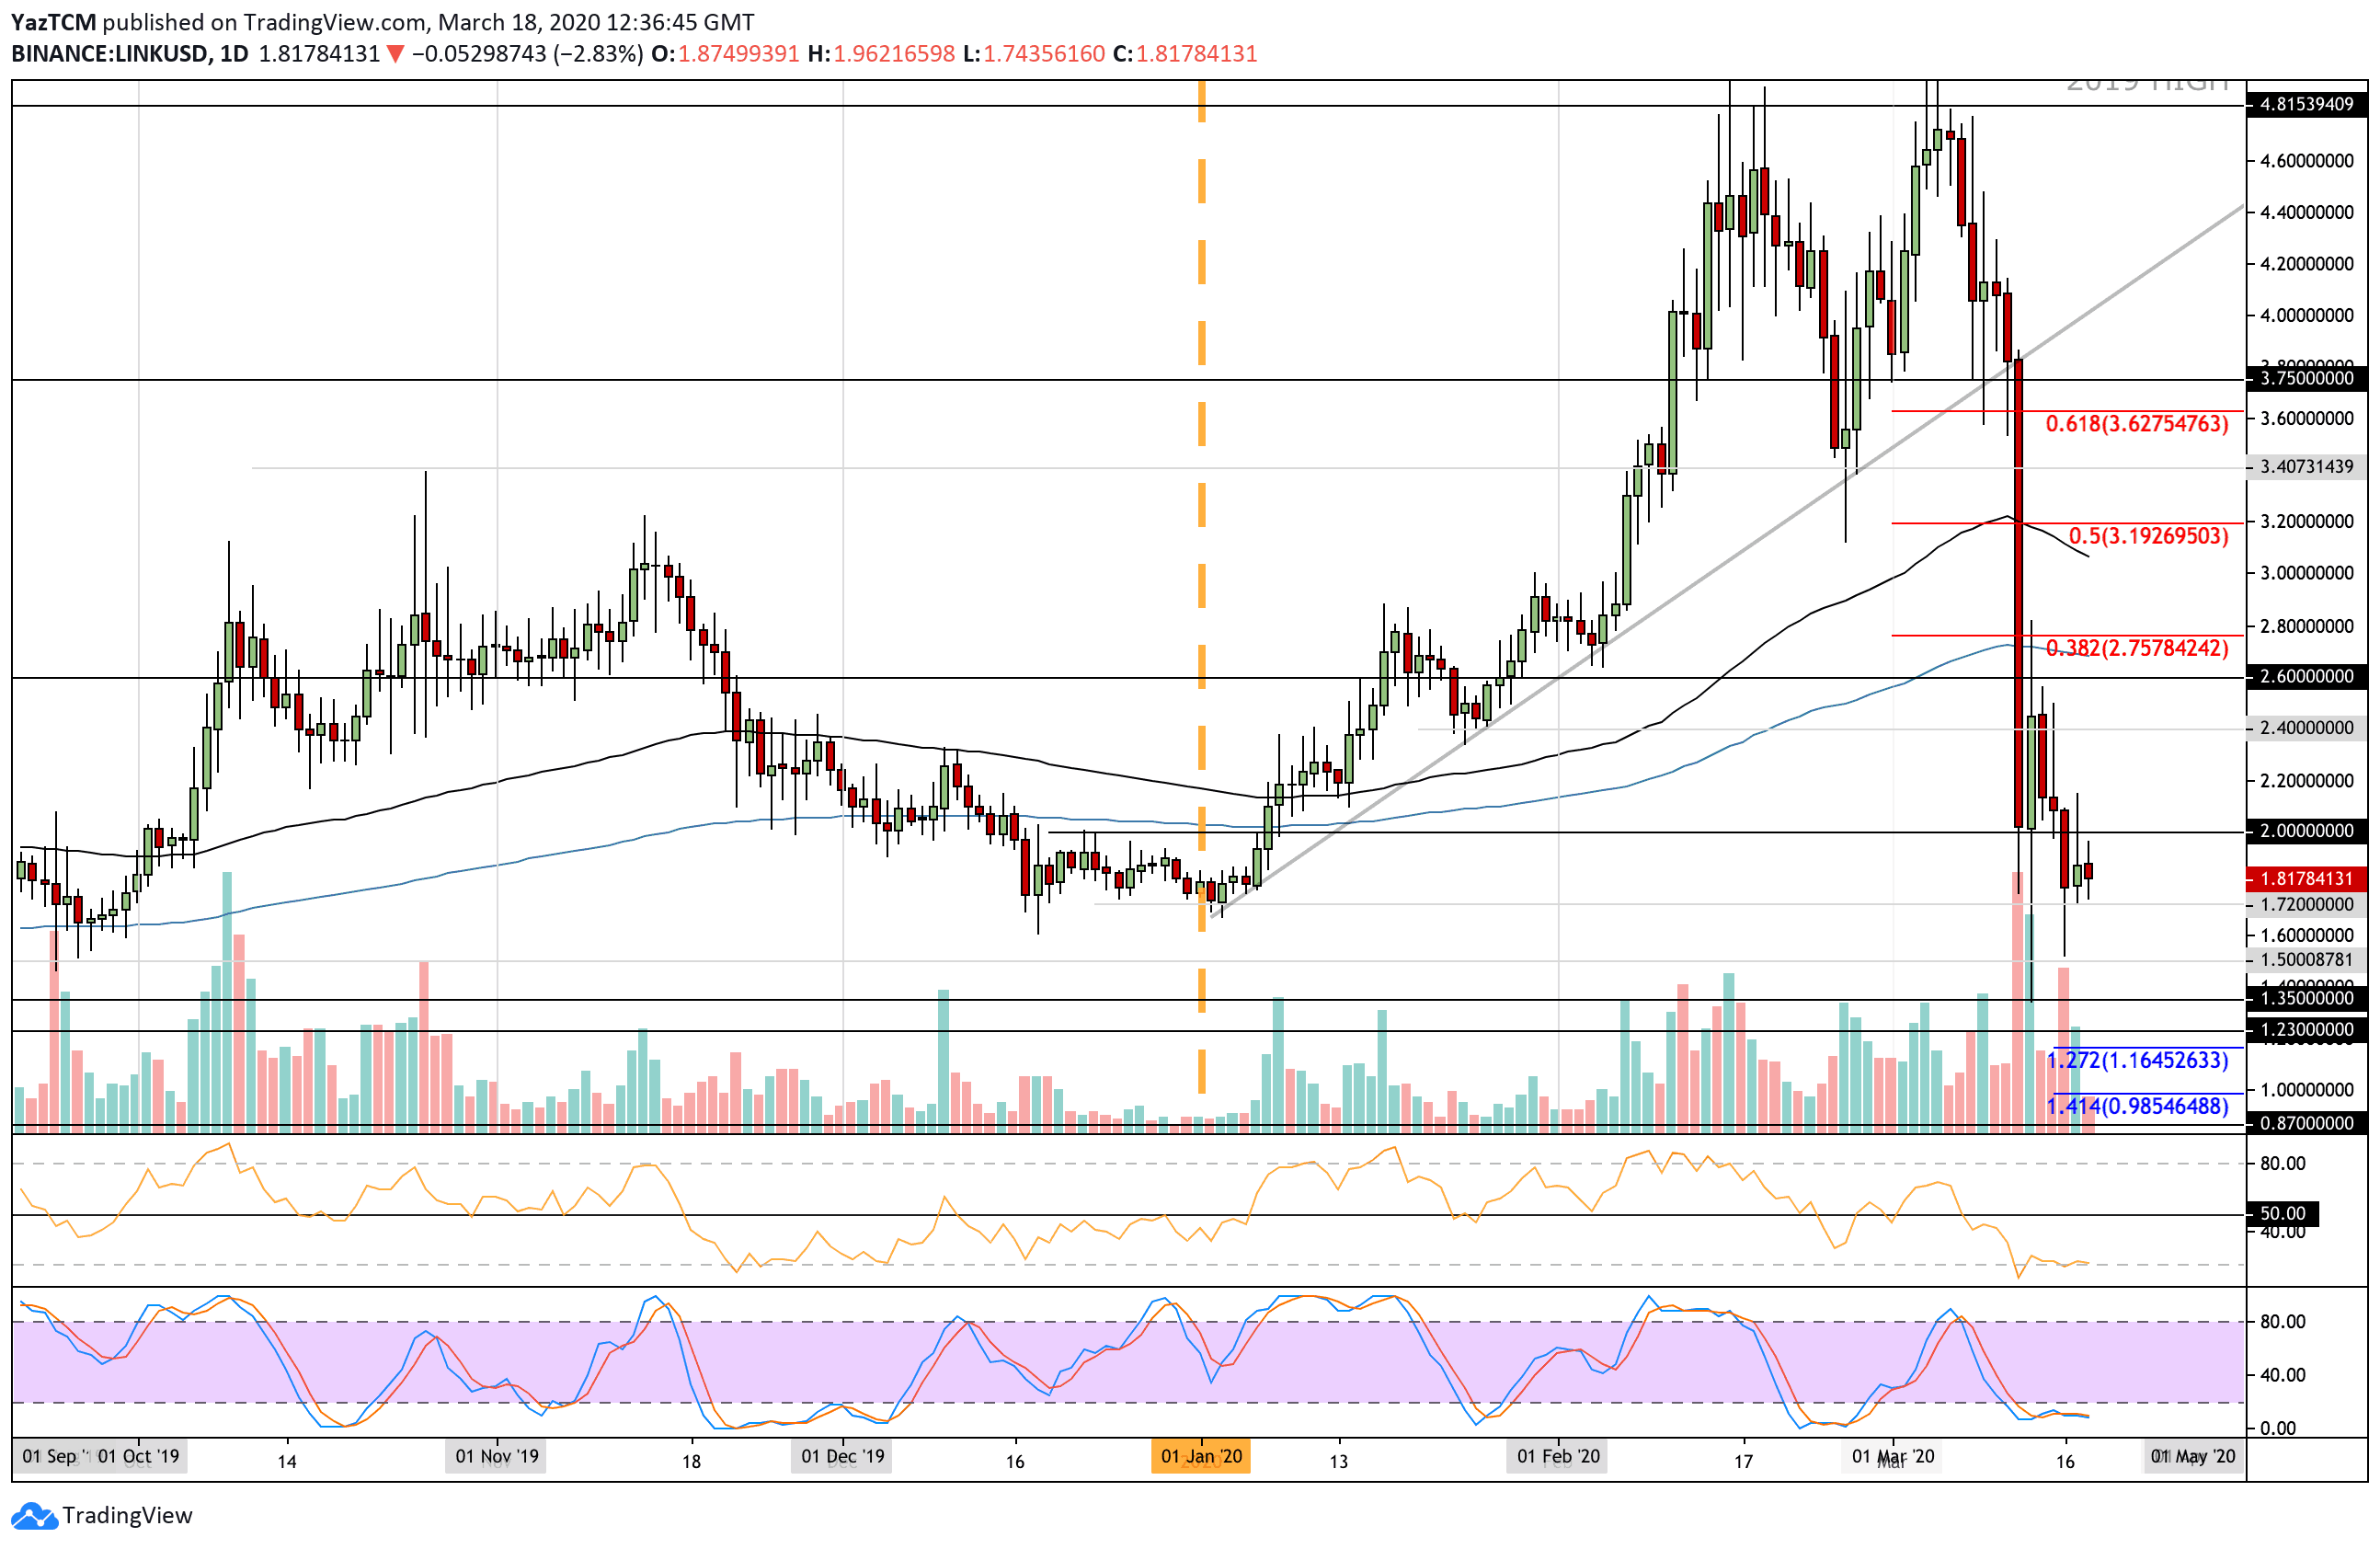
LINK-USD Short Term Price Prediction
From below, support initially lies at $1.72. Beneath this, support can be found at $1.60, $1.50, $1.35, and $1.23.
On the other hand, if the bulls regroup to push higher, resistance is expected at $2.00, $2.20, and $2.40.
The RSI is still in extremely oversold conditions, which shows that the sellers remain in complete control over the market momentum. A strong bullish crossover signal on the Stochastic RSI will likely signal that the selling pressure is starting to decrease.
LINK/BTC: LINK Drops Beneath 100-days EMA And Turns Bearish
Against Bitcoin, LINK has dropped by a total of 37% since rolling over at the March high of around 0.00056 BTC. The cryptocurrency dropped beneath support at 0.00044 BTC, 0.00040 BTC, and 0.00039 BTC to reach the current support at 0.000346 BTC (downside 1.272 Fib Extension).
The latest price drops also caused LINK to fall below the 100-days EMA against BTC to put it in bearish conditions.
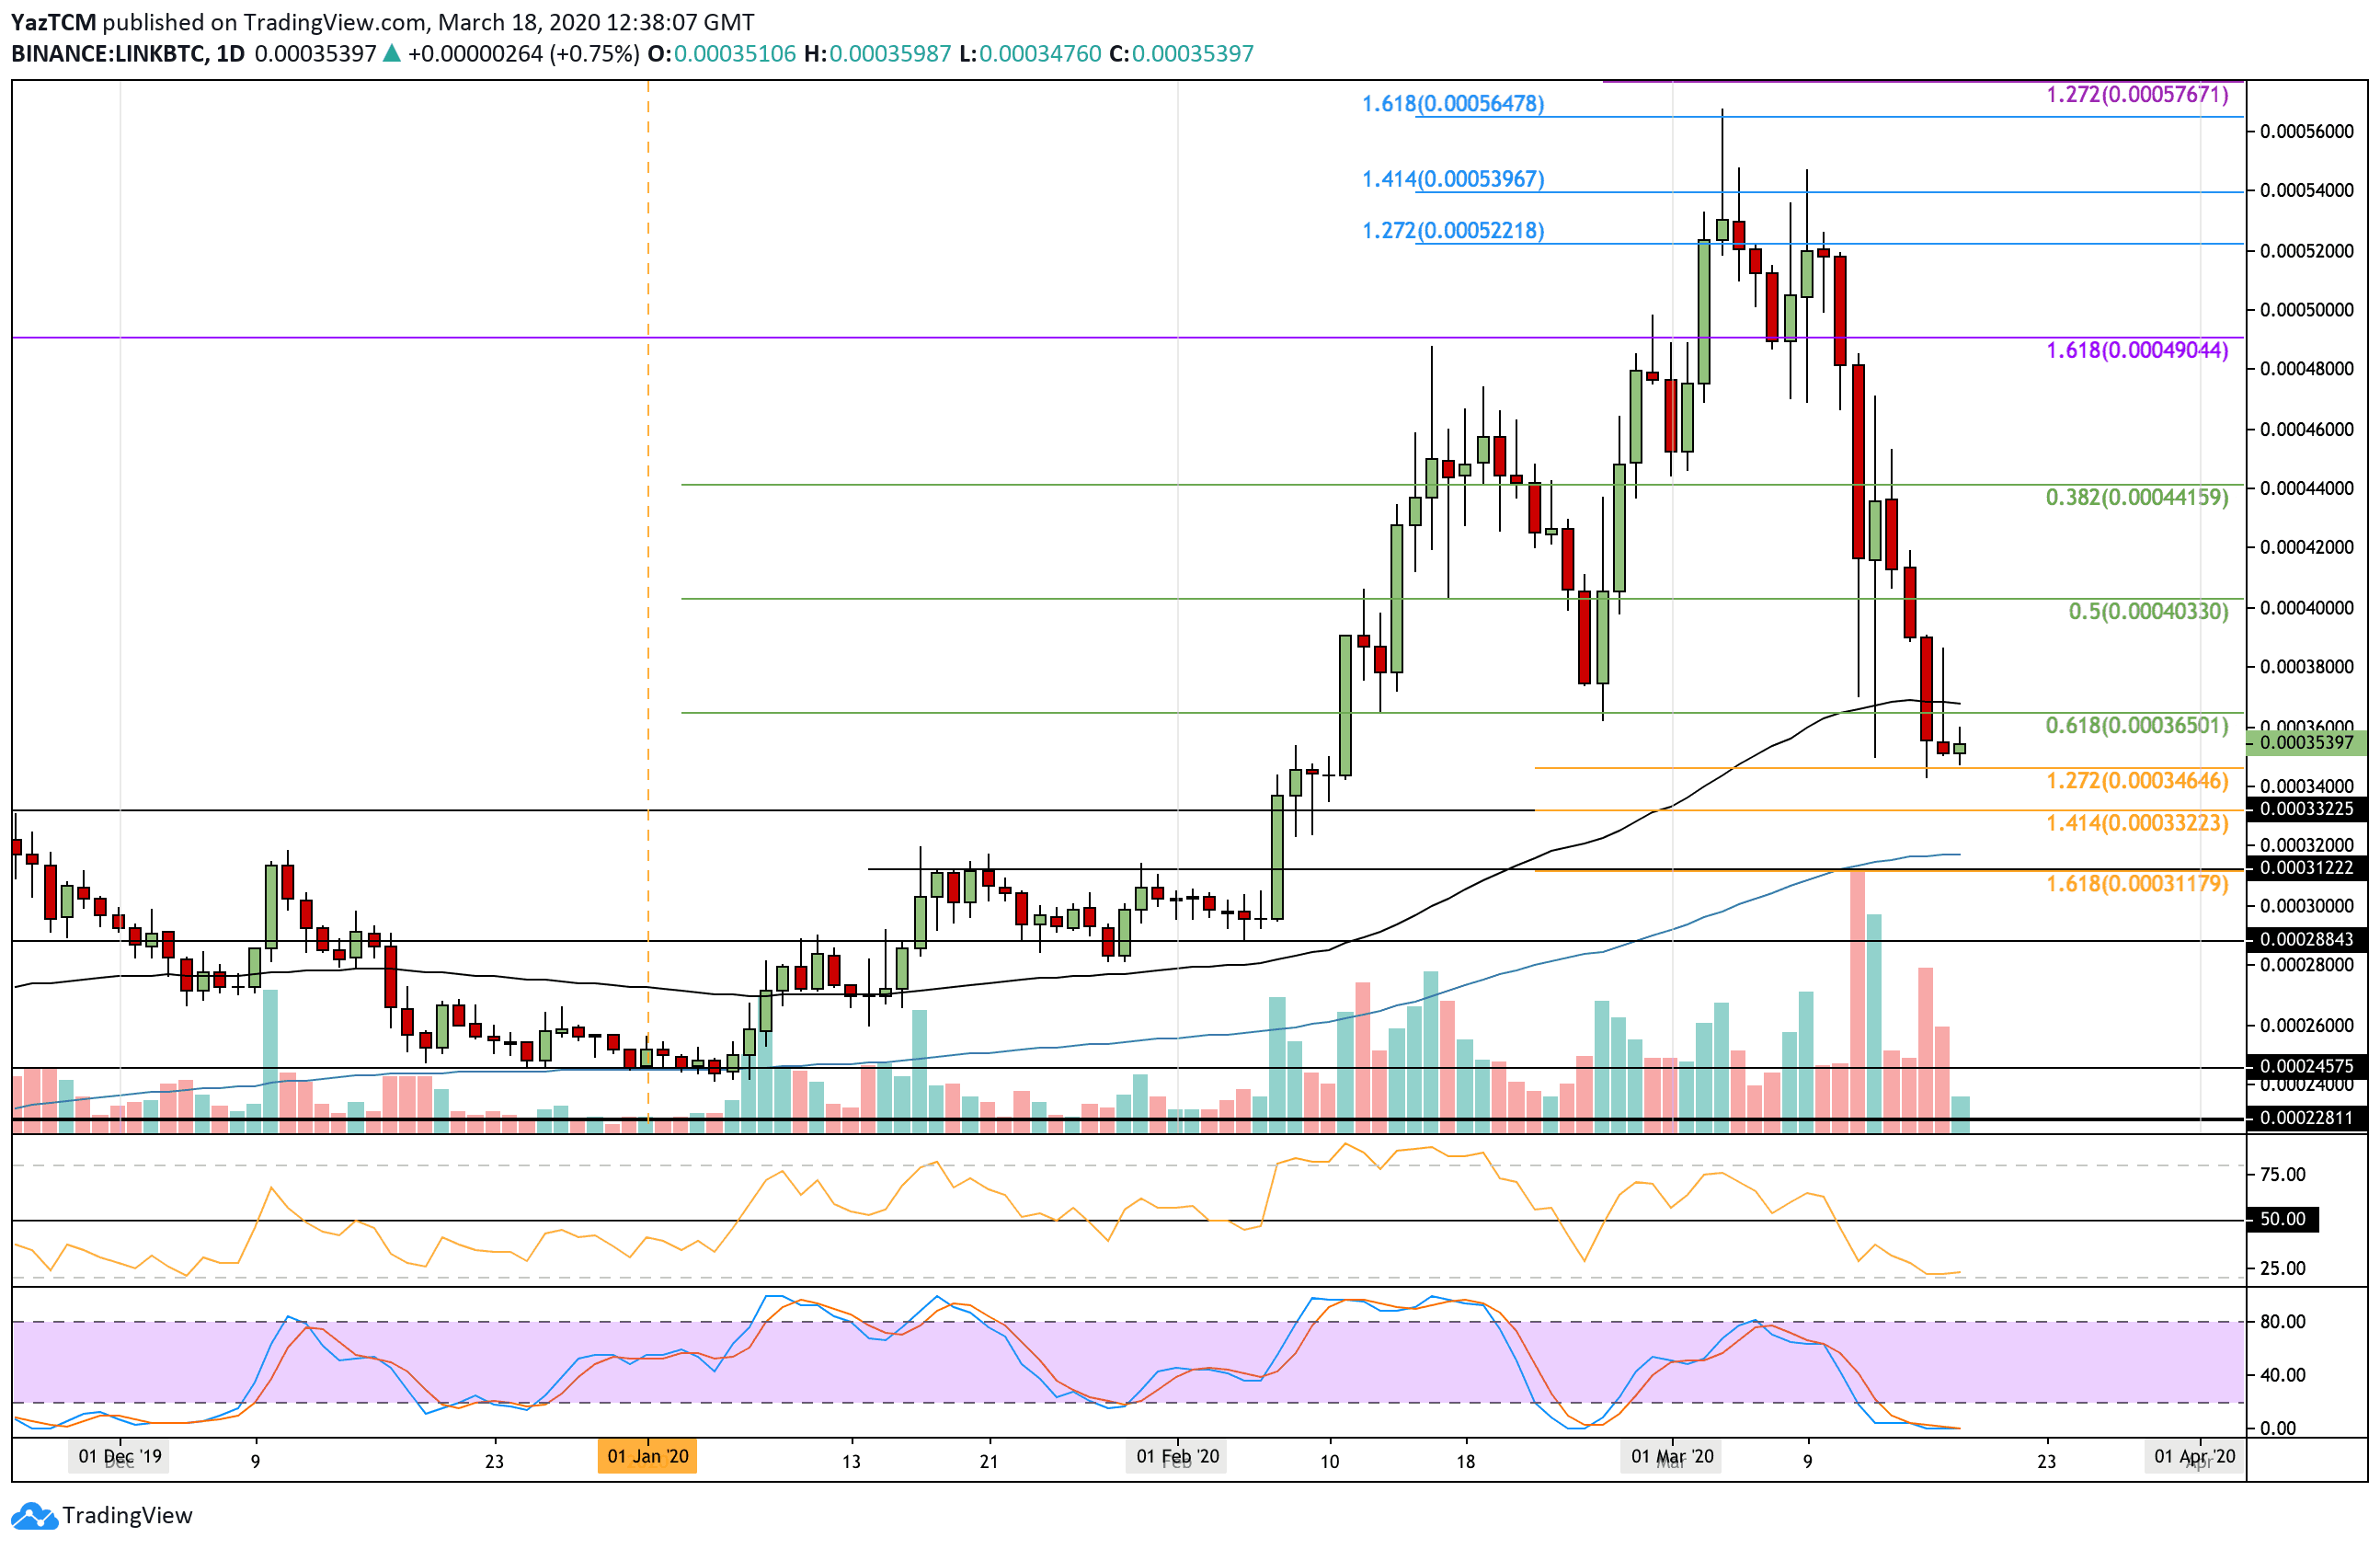
LINK/BTC Short Term Price Prediction
From below, if the sellers break 0.000346, BTC support can be found at 0.000332 BTC. This is followed by support at 0.00032 BTC (200-days EMA), 0.000311 BTC, and 0.00030 BTC.
On the other hand, the first level of resistance lies at 0.000367 BTC (100-days EMA). Additional resistance is found at 0.00038 BTC and 0.00038 BTC.
The RSI hit extremely oversold conditions and is starting to level off, which could be a signal that the sellers are exhausted. If it starts to rise back toward 50, this will signal that the selling pressure is beginning to fade.