Ethereum currently trades around 0.02193 BTC after breaking slightly below a crucial supportThe price is readying for a breakout from a symmetrical triangle as trading reaches a tight range on the 4-hourEthereum is showing a sign of weakness after witnessing a sizeable loss over the past few hoursETH/USD: Ethereum Trades Inside TriangleKey Resistance Levels: 2, 4.6, 1Key Support Levels: 1.2, , ETH/USD. Source: TradingViewAfter trading inside a descending channel for two weeks, Ethereum fell seriously to a monthly low of during last week’s session. Since then, the market has recovered nicely back above 0.At the time of writing, Ethereum is trading around 2, but the price is currently trapped within a symmetrical triangle (a bear flag pattern). As we can see on
Topics:
Michael Fasogbon considers the following as important: ETH Analysis, Ethereum (ETH) Price
This could be interesting, too:
Mandy Williams writes Ethereum Derivatives Metrics Signal Modest Downside Tail Risk Ahead: Nansen
CryptoVizArt writes Will Weak Momentum Drive ETH to .5K? (Ethereum Price Analysis)
Mandy Williams writes Ethereum Key Metrics Point to Persistent Bullish Outlook for ETH: CryptoQuant
CryptoVizArt writes Ethereum Price Analysis: Following a 15% Weekly Crash, What’s Next for ETH?
- Ethereum currently trades around 0.02193 BTC after breaking slightly below a crucial support
- The price is readying for a breakout from a symmetrical triangle as trading reaches a tight range on the 4-hour
- Ethereum is showing a sign of weakness after witnessing a sizeable loss over the past few hours
ETH/USD: Ethereum Trades Inside Triangle
Key Resistance Levels: $122, $134.6, $151
Key Support Levels: $101.2, $86, $83
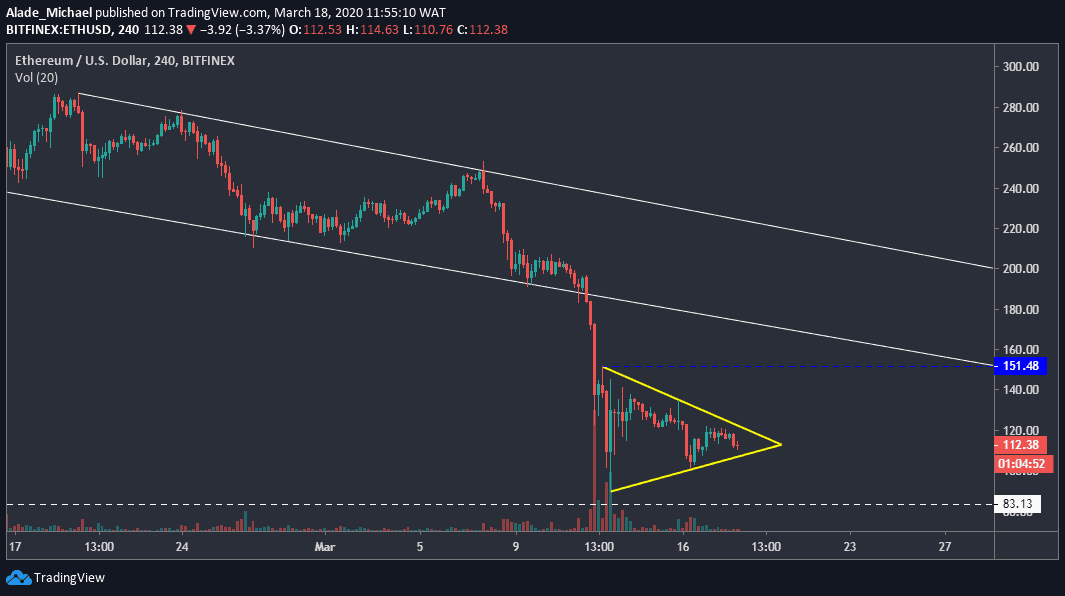
After trading inside a descending channel for two weeks, Ethereum fell seriously to a monthly low of $86 during last week’s session. Since then, the market has recovered nicely back above $100.
At the time of writing, Ethereum is trading around $112, but the price is currently trapped within a symmetrical triangle (a bear flag pattern). As we can see on the 4-hours chart, the price is reaching a tight area on the triangle, which suggests Ethereum is plotting a breakout.
In the next 48-hours, we should expect price actions to both sides. While anticipating, however, it’s important to note that the bear flag pattern still suggests Ethereum be under bearish control, which means that a downward trend could play out.
Notwithstanding, Etherum could reverse the trend if the buyers can gain control of the market. As of now, the second-largest cryptocurrency is down by 3.25% against the US Dollar.
Ethereum Price Analysis
Looking at the 4-hours chart, Ethereum is waiting for a triangle breakout. In case of a break-up, the major price target for the bull is $151 resistance, marked blue on the 4-hours chart.
Though, Ethereum is likely to encounter resistance around $120; where the price is facing rejection for the past three days. The next above this is $134 (March 15 high). If Ethereum surges well above all these mentioned levels, however, the price is likely to trade back in the two weeks channel.
In case Ethereum breaks below this triangle, there’s close support at $101.2 (the weekly low). Below this support lies $86 (last week’s low). If this support breaks, the price may collapse to $83 (the 2018 low), marked white on the price chart.
ETH/BTC: Ethereum Trades Around Mid-Term Support
Key Resistance Levels: 0.022BTC, 0.02444BTC
Key Support Levels: 0.021 BTC, 0.020 BTC

Since our previous analysis, Ethereum has extended its bearishness beneath a key support level of 0.022 BTC, which has now turned resistance. Following this slight break-down, Ethereum is now trading around 0.02193 BTC level against Bitcoin.
Meanwhile, Ethereum is still trading around the mid-term diagonal support – the white line on the 4-hours chart, which suggests that there’s still hope for a rebound. That would happen if Ethereum can make a double-bottom pattern around the current price.
It would be too early to consider the latest breakout as a mid-term bearish confirmation because it might lead to fake move. Regardless of the above, the structure of the market still looks bearish on the price chart.
Ethereum Price Analysis
If Ethereum fails to bounce from the mid-tern trend line (white), we can expect to see more bearish price actions in the next couple of days. In such a case, the key price areas to watch out for are 0.021 BTC and 0.020 BTC support, marked blue on the chart.
A drop below this psychological level would cause serious pressure in the market.
If Ethereum manages to bounce back above the red supply area of 0.022 BTC resistance, the price projection would be 0.027 BTC resistance, which is the monthly high. But the important level for the bulls is 0.02444 BTC, the support-turned-resistance that got broken during last week’s surge.