BitcoinBitcoin is up by a small 2% this week after suffering a major setback when it dropped by 5.5% in today’s trading session. The cryptocurrency had surged from the ,800 level last Friday to reach as high as ,400 at the start of this week.However, in today’s trading, Bitcoin fell by over 5% to drop back into the ,800 support level. It also found added support at the previous rising trend line.If Bitcoin drops back beneath ,800, additional support lies at ,600, ,400, ,200, and ,000.On the other side, if it can rebound from ,800, resistance lies at ,000, ,200 (bearish .5 Fib Retracement), and ,400. Beyond ,400, added resistance lies at ,700 (100-days EMA) and ,000 (200-days EMA & bearish .618 Fib Retracement).BTC/USD. Source: TradingViewEthereumEthereum
Topics:
Yaz Sheikh considers the following as important: Bitcoin (BTC) Price, BTC Analysis, btcusd, ETH Analysis, ETHBTC, Ethereum (ETH) Price, ethusd, matic network, Price Analysis, Ripple (XRP) Price, waves, XRP Analysis, xrpbtc, xrpusd
This could be interesting, too:
Chayanika Deka writes XRP, SOL, and ADA Inclusion in US Crypto Reserve Pushes Traders on Edge
Chayanika Deka writes Why Arthur Hayes Is Bullish on Bitcoin Under Trump’s Economic Strategy
Mandy Williams writes Why the Bitcoin Market Is Stuck—and the Key Metric That Could Change It: CryptoQuant CEO
Wayne Jones writes Metaplanet Acquires 156 BTC, Bringing Total Holdings to 2,391
Bitcoin
Bitcoin is up by a small 2% this week after suffering a major setback when it dropped by 5.5% in today’s trading session. The cryptocurrency had surged from the $6,800 level last Friday to reach as high as $6,400 at the start of this week.
However, in today’s trading, Bitcoin fell by over 5% to drop back into the $6,800 support level. It also found added support at the previous rising trend line.
If Bitcoin drops back beneath $6,800, additional support lies at $6,600, $6,400, $6,200, and $6,000.
On the other side, if it can rebound from $6,800, resistance lies at $7,000, $7,200 (bearish .5 Fib Retracement), and $7,400. Beyond $7,400, added resistance lies at $7,700 (100-days EMA) and $8,000 (200-days EMA & bearish .618 Fib Retracement).

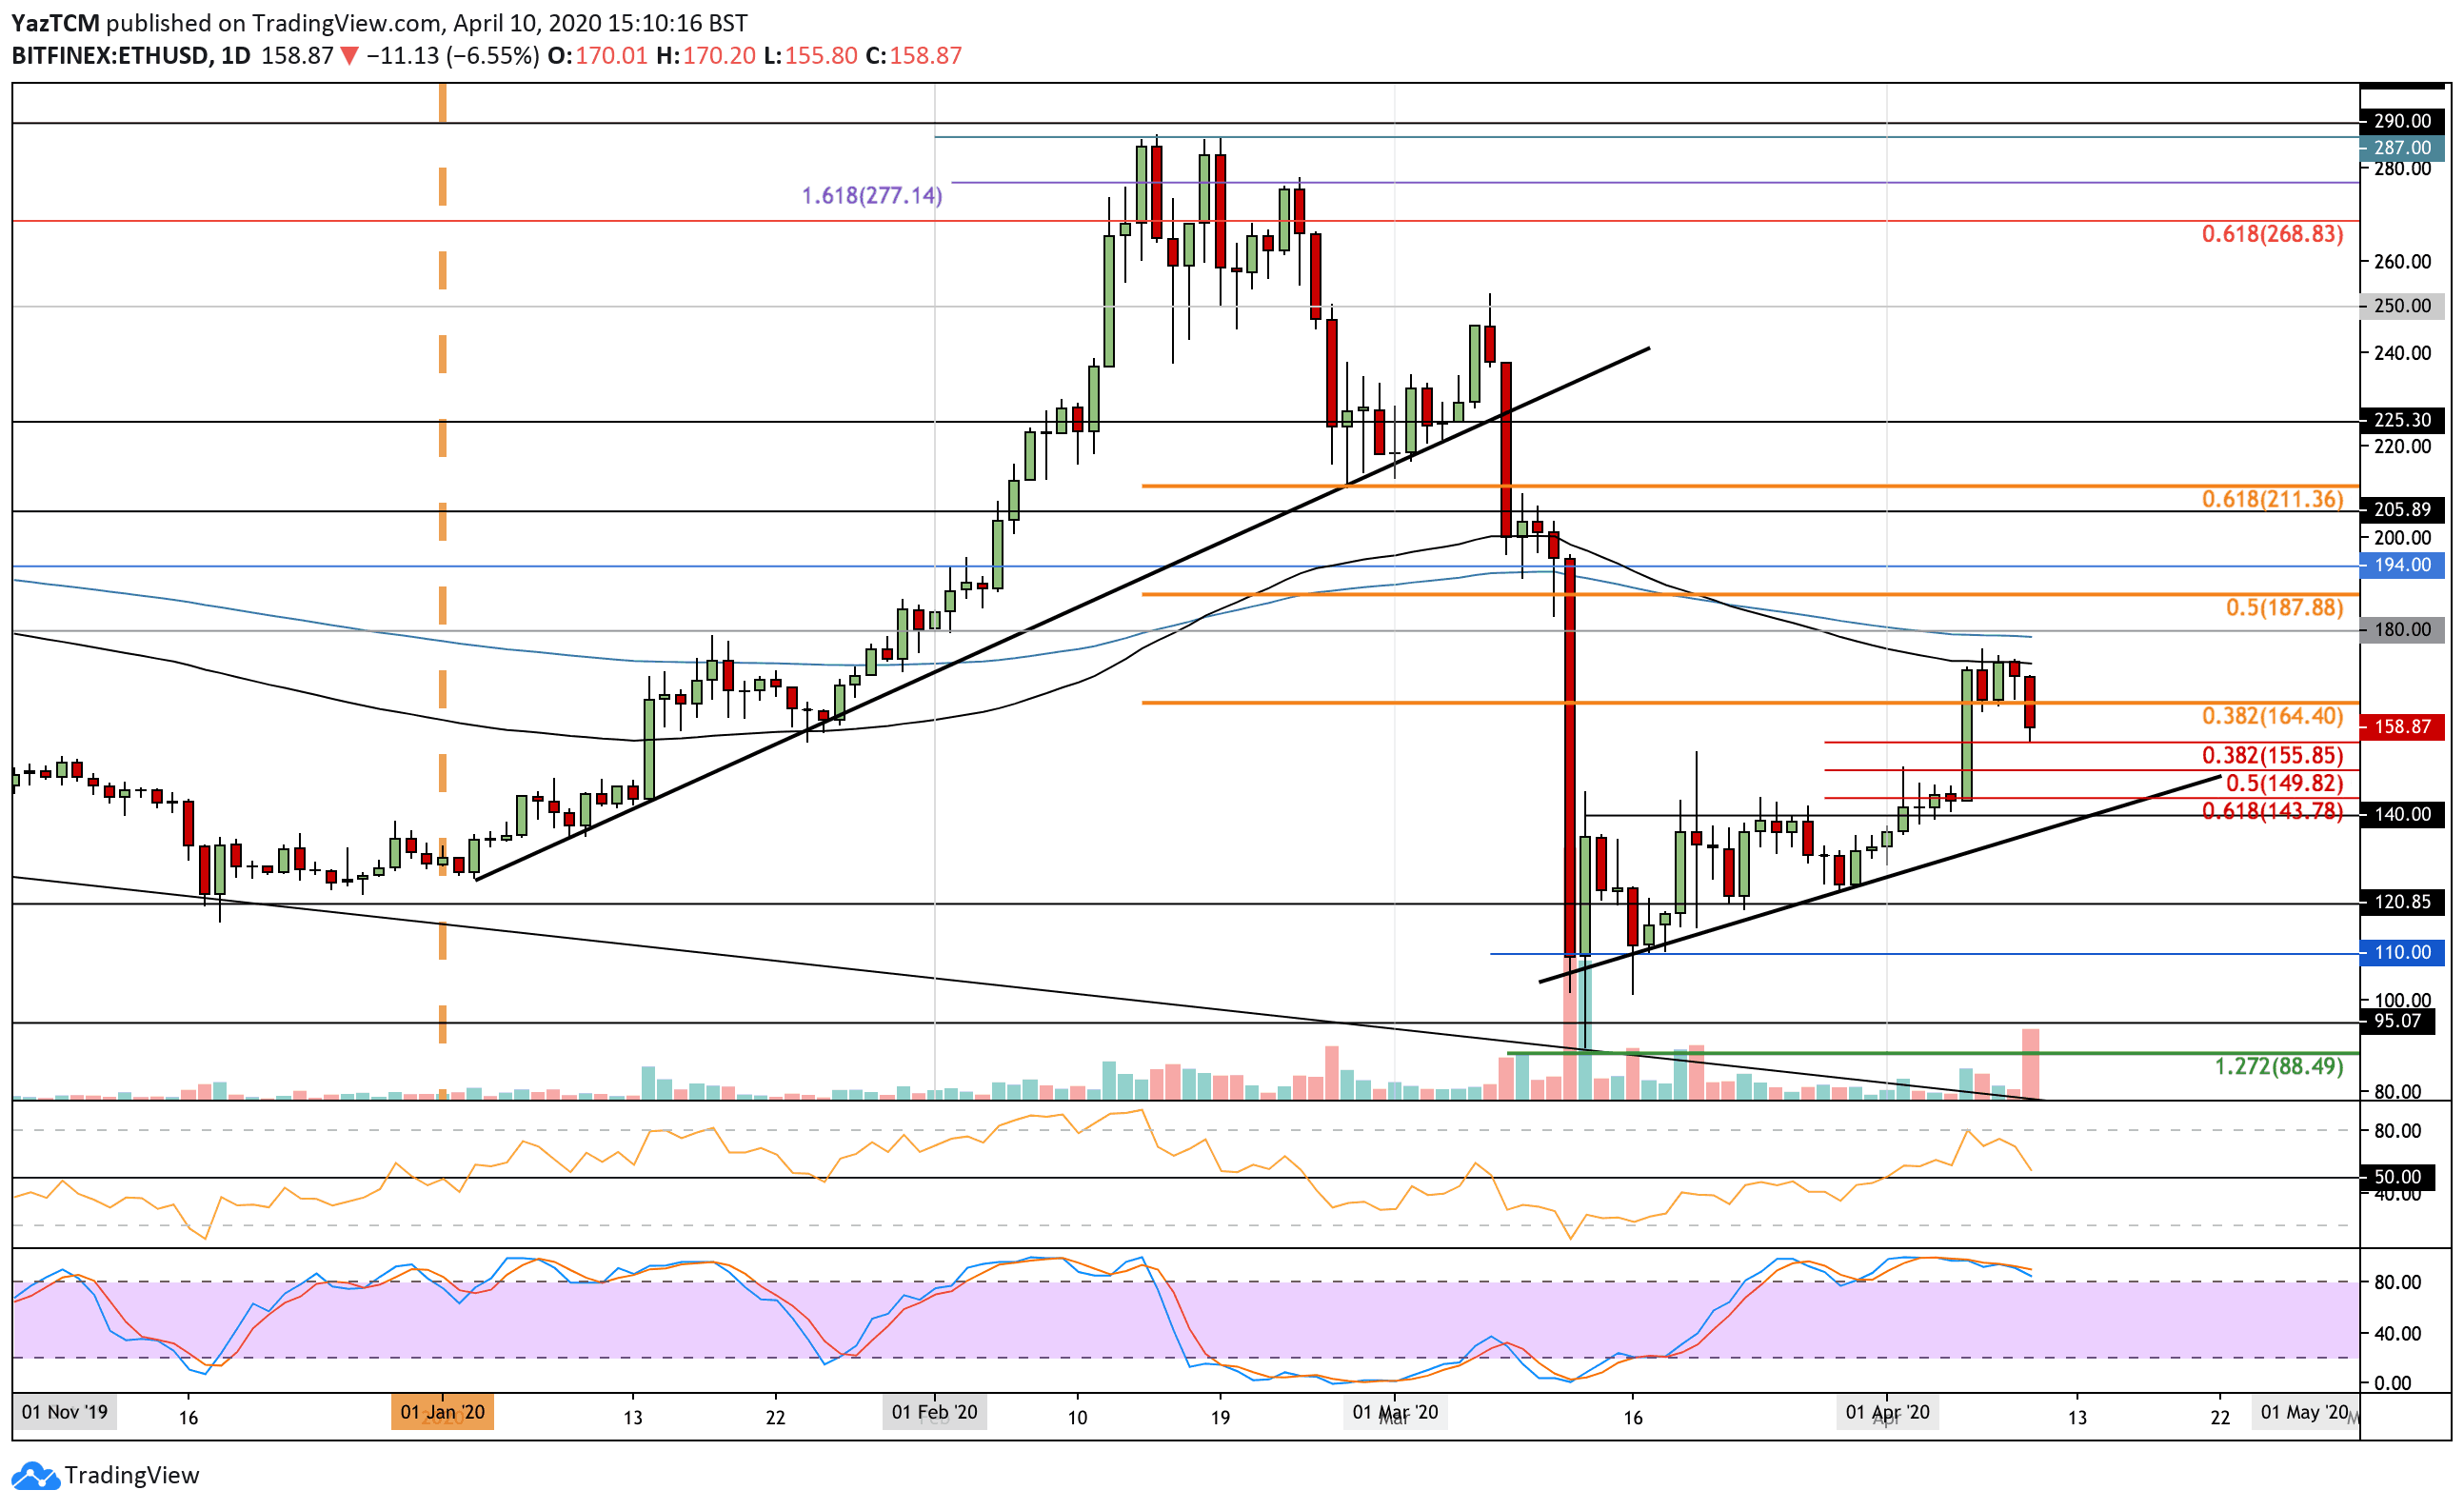
Ethereum
Ethereum managed to break above the previous $145 resistance level this week as it surged by a total of 23% to reach the resistance at $175, which is provided by the 100-days EMA.
It struggled to break this resistance and since dropped by 7.2% today to reach the current trading level at $158. This brings the total 7-day price movement to +10.5%.
From below, the first level of support lies at $155 (short term .382 Fib Retracement). Beneath this, added support is located at $150 (.5 Fib Retracement), $144 (.618 Fib Retracement), and $140. The support at $140 is further bolstered by a rising support trend line.
Alternatively, if the bulls rebound from $155, resistance is located at $165 (bearish .382 Fib Retracement), $175 (100-days EMA), and $180.
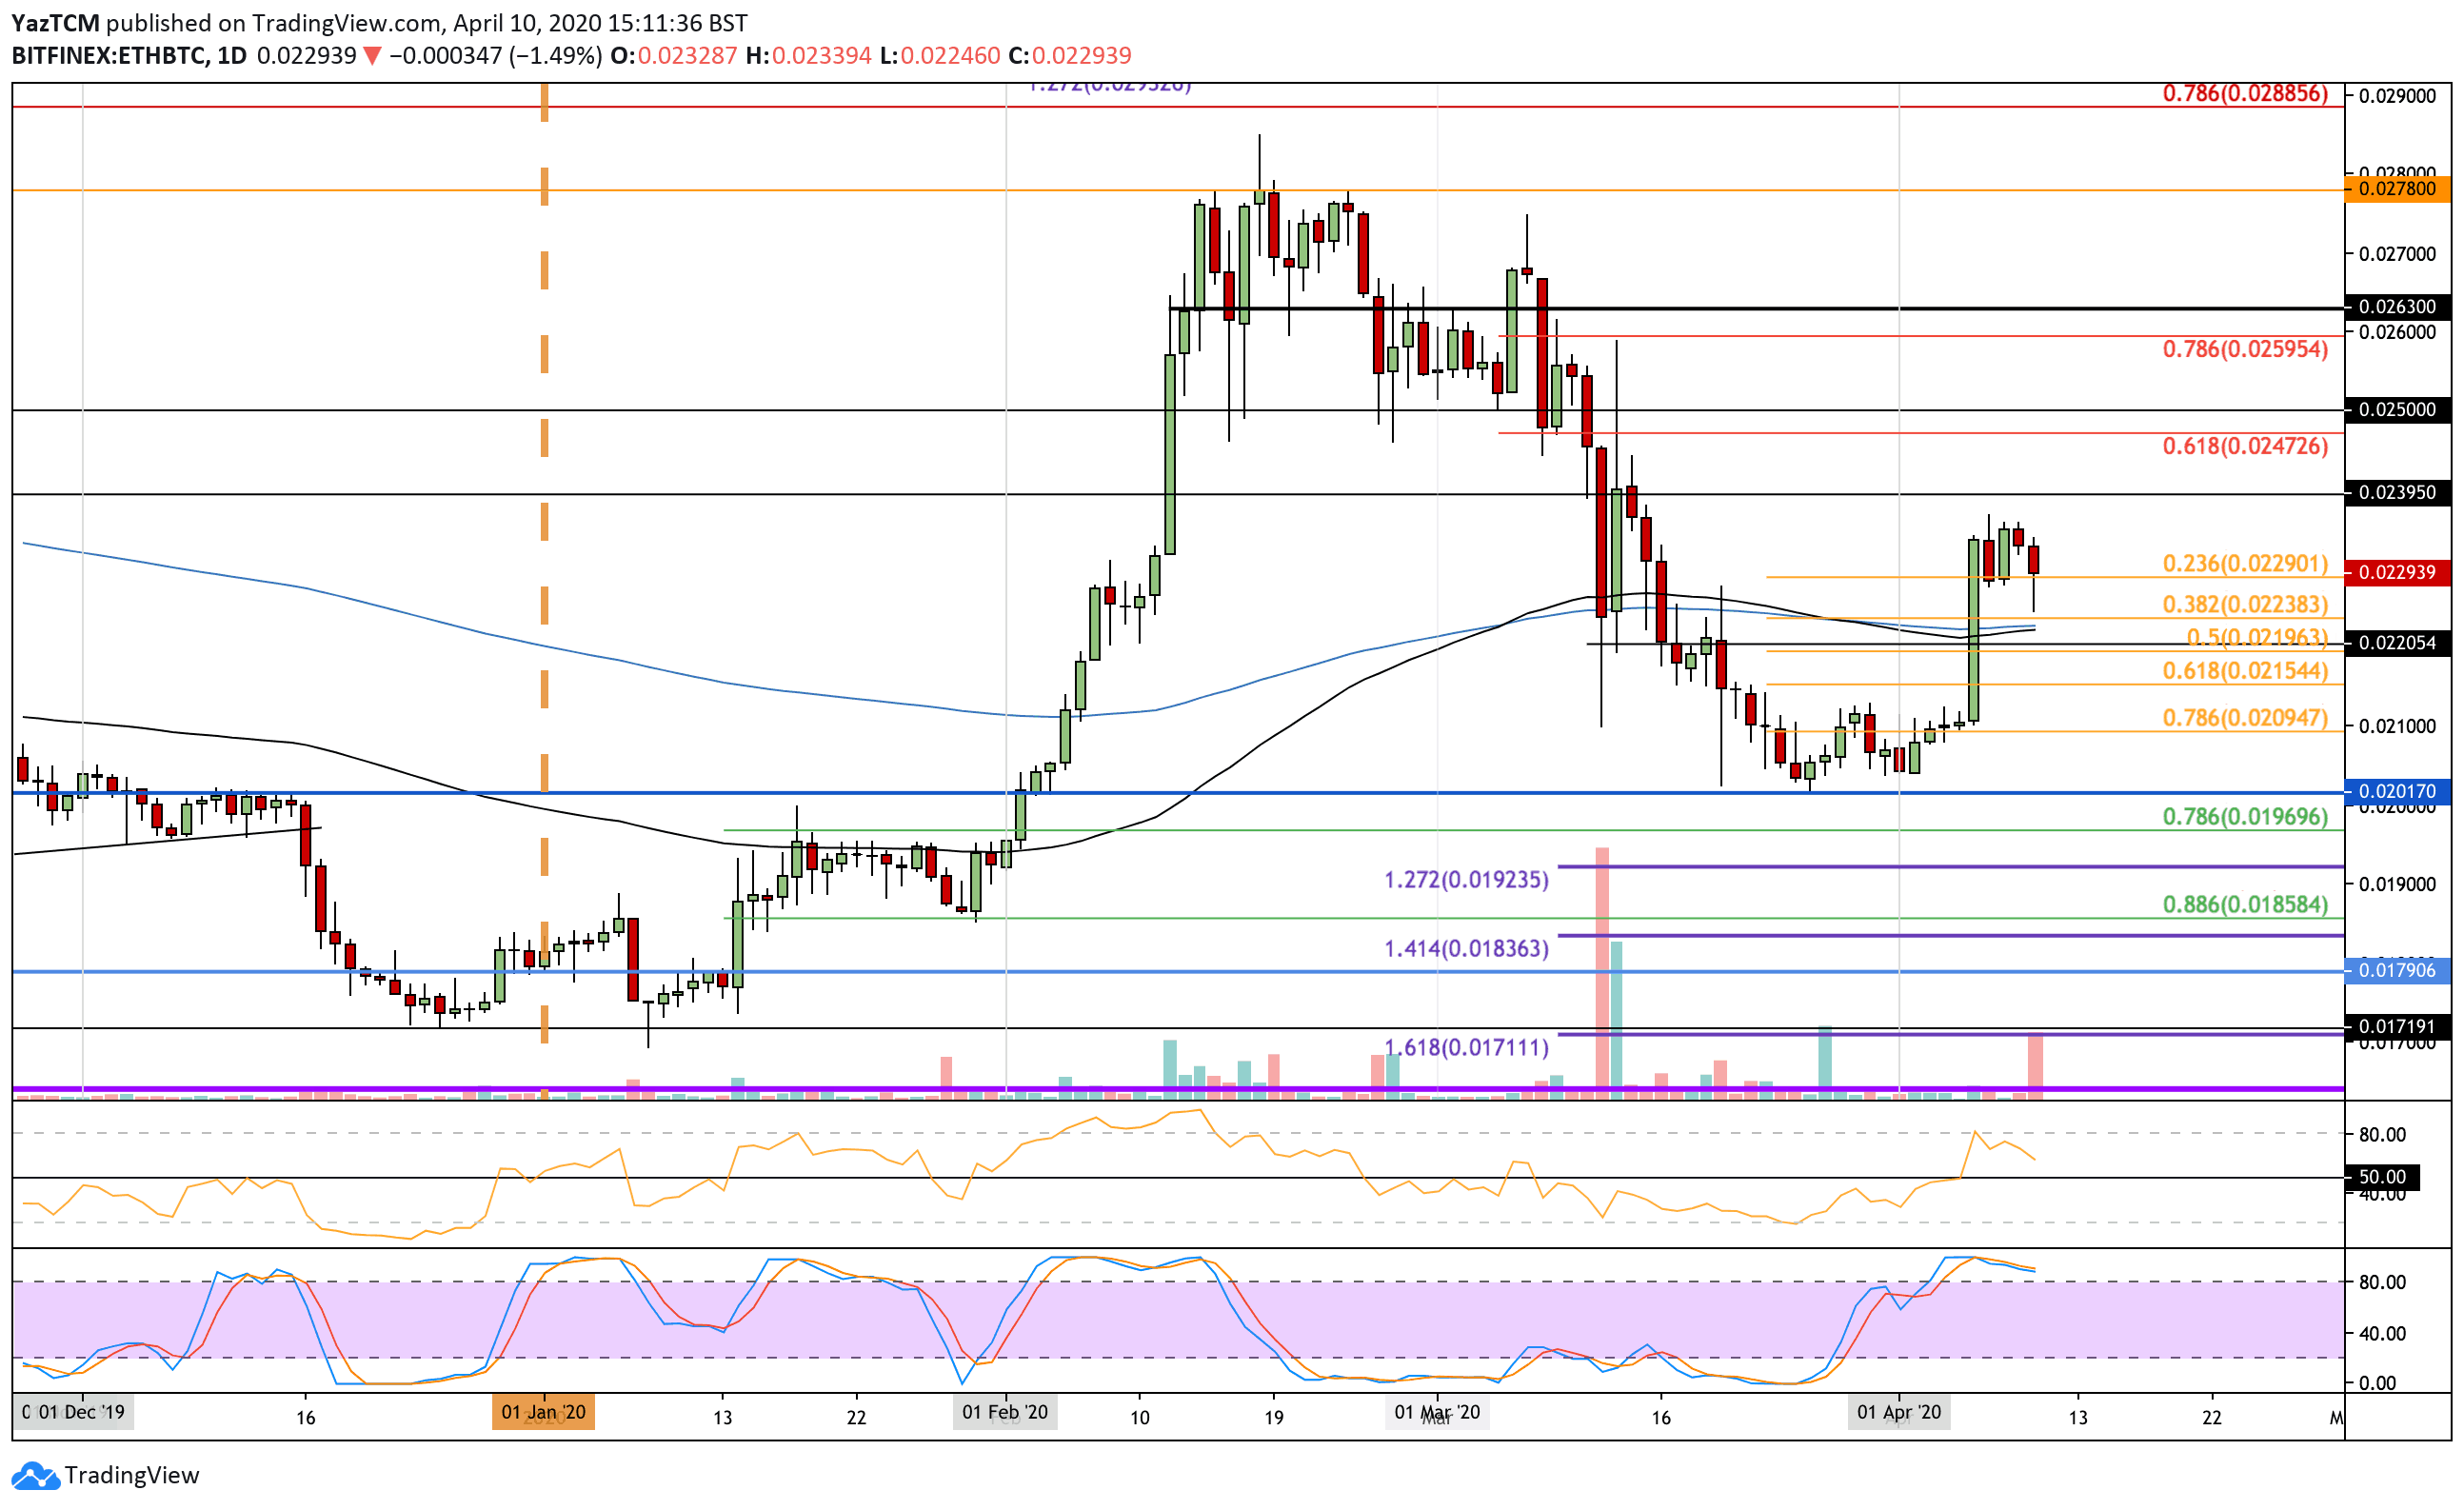
Against Bitcoin, ETH also surged by a total of 12% as it managed to break above the previous 0.021 BTC resistance to climb as high as 0.0235 BTC before reversing. It has since dropped lower but is resting at support at 0.0229 BTC provided by a .236 Fib Retracement.
If the sellers push lower, support lies at 0.0225 (.382 Fib Retracement), 0.022 BTC, and 0.0215 BTC (.618 Fib Retracement).
On the other side, if they can push higher, resistance lies at 0.0235 BTC, 0.0245 BTC (bearish .618 Fib Retracement), and 0.025 BTC.
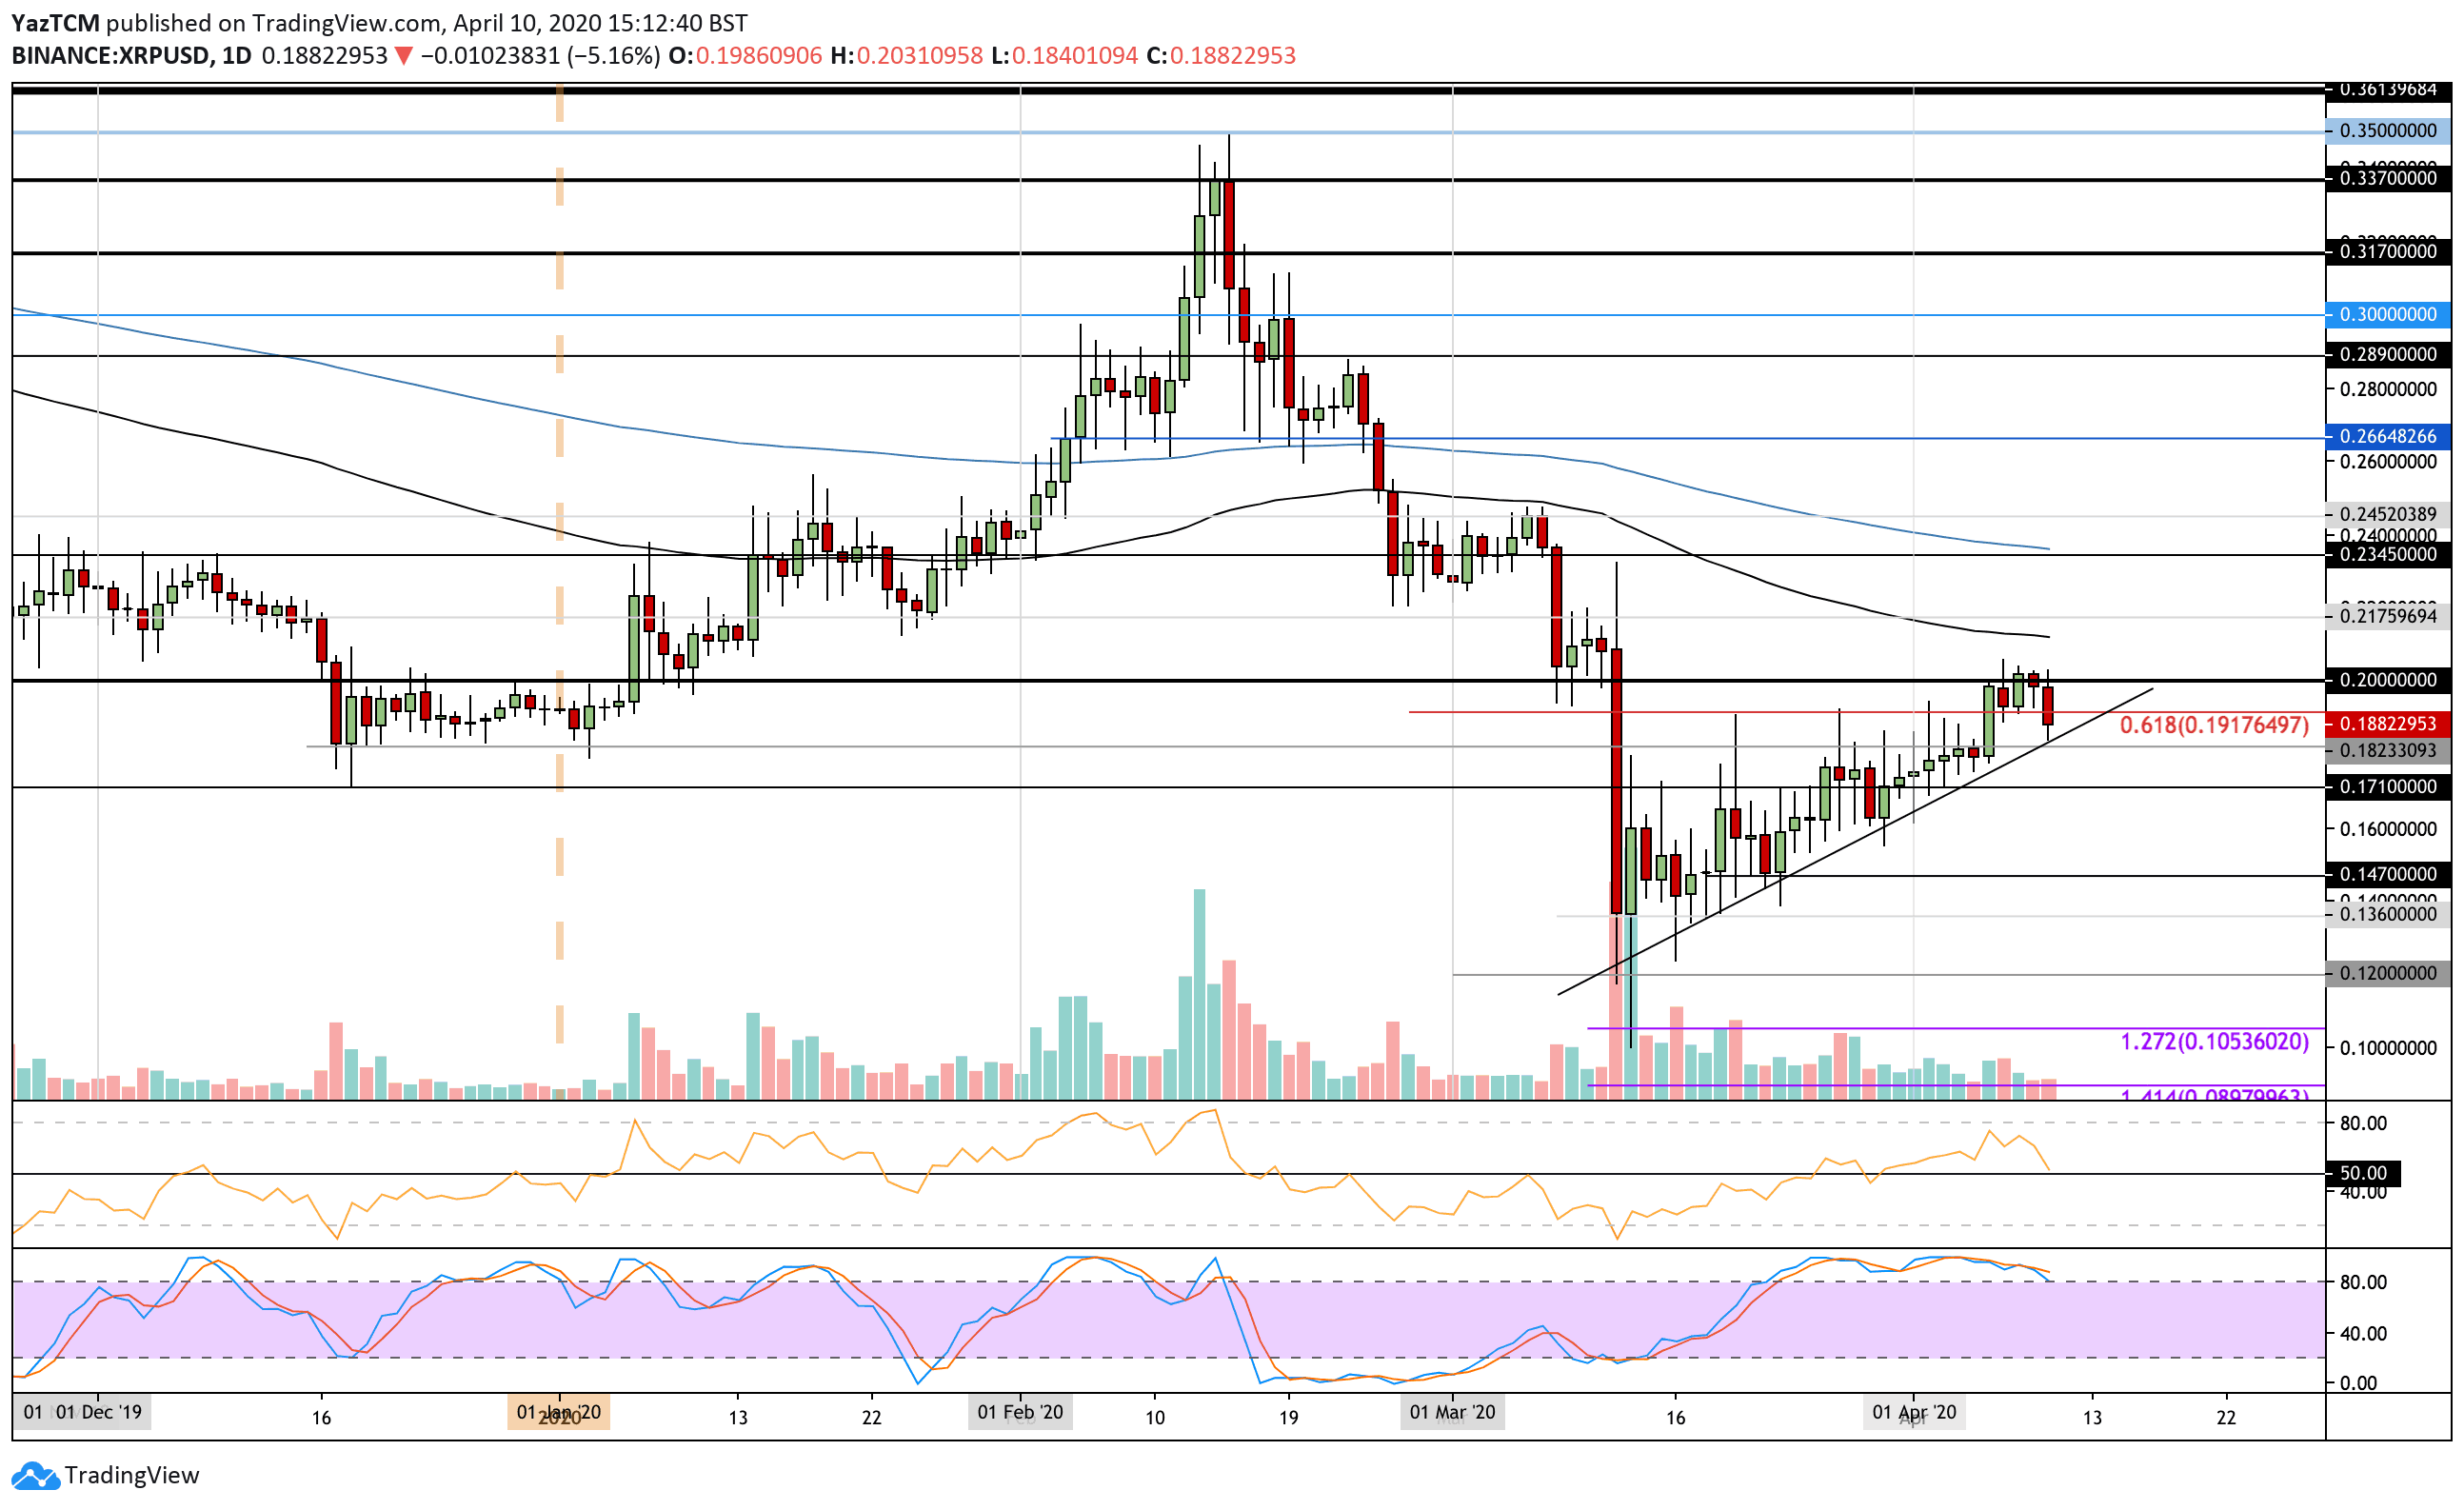
Ripple
XRP dropped by a total of 6% today as the cryptocurrency failed to make ground above the $0.20 resistance level. It had climbed by a total of 14% throughout the week to reach $0.20, but today’s price decline brought the 7-day price to a small 4%.
XRP is now trading at support provided by the rising support trend line at $0.182.
If the sellers break this rising trend line, support is expected at $0.171, $0.16, and $0.147.
On the other hand, if they can rebound from here, resistance lies at $0.191, $0.20, and $0.21 (100-days EMA). Above this, added resistance is found at $0.217 and $0.24 (200-days EMA).
Against Bitcoin, XRP rebounded from the .5 Fib Retracement support at 2620 SAT. It went on to climb as high as 2750 SAT but failed to overcome the resistance here provided by a 100-days EMA and a falling trend line.
From below, the first level of support lies at 2710 SAT. Beneath this, support lies at 2680 SAT (.382 Fib Retracement), 2650 SAT, 2620 SAT (.5 Fib Retracement), and 2560 SAT.
Alternatively, if the bulls can break the 100-days EMA, resistance lies at 2800 SAT, 2850 SAT, and 2900 SAT.

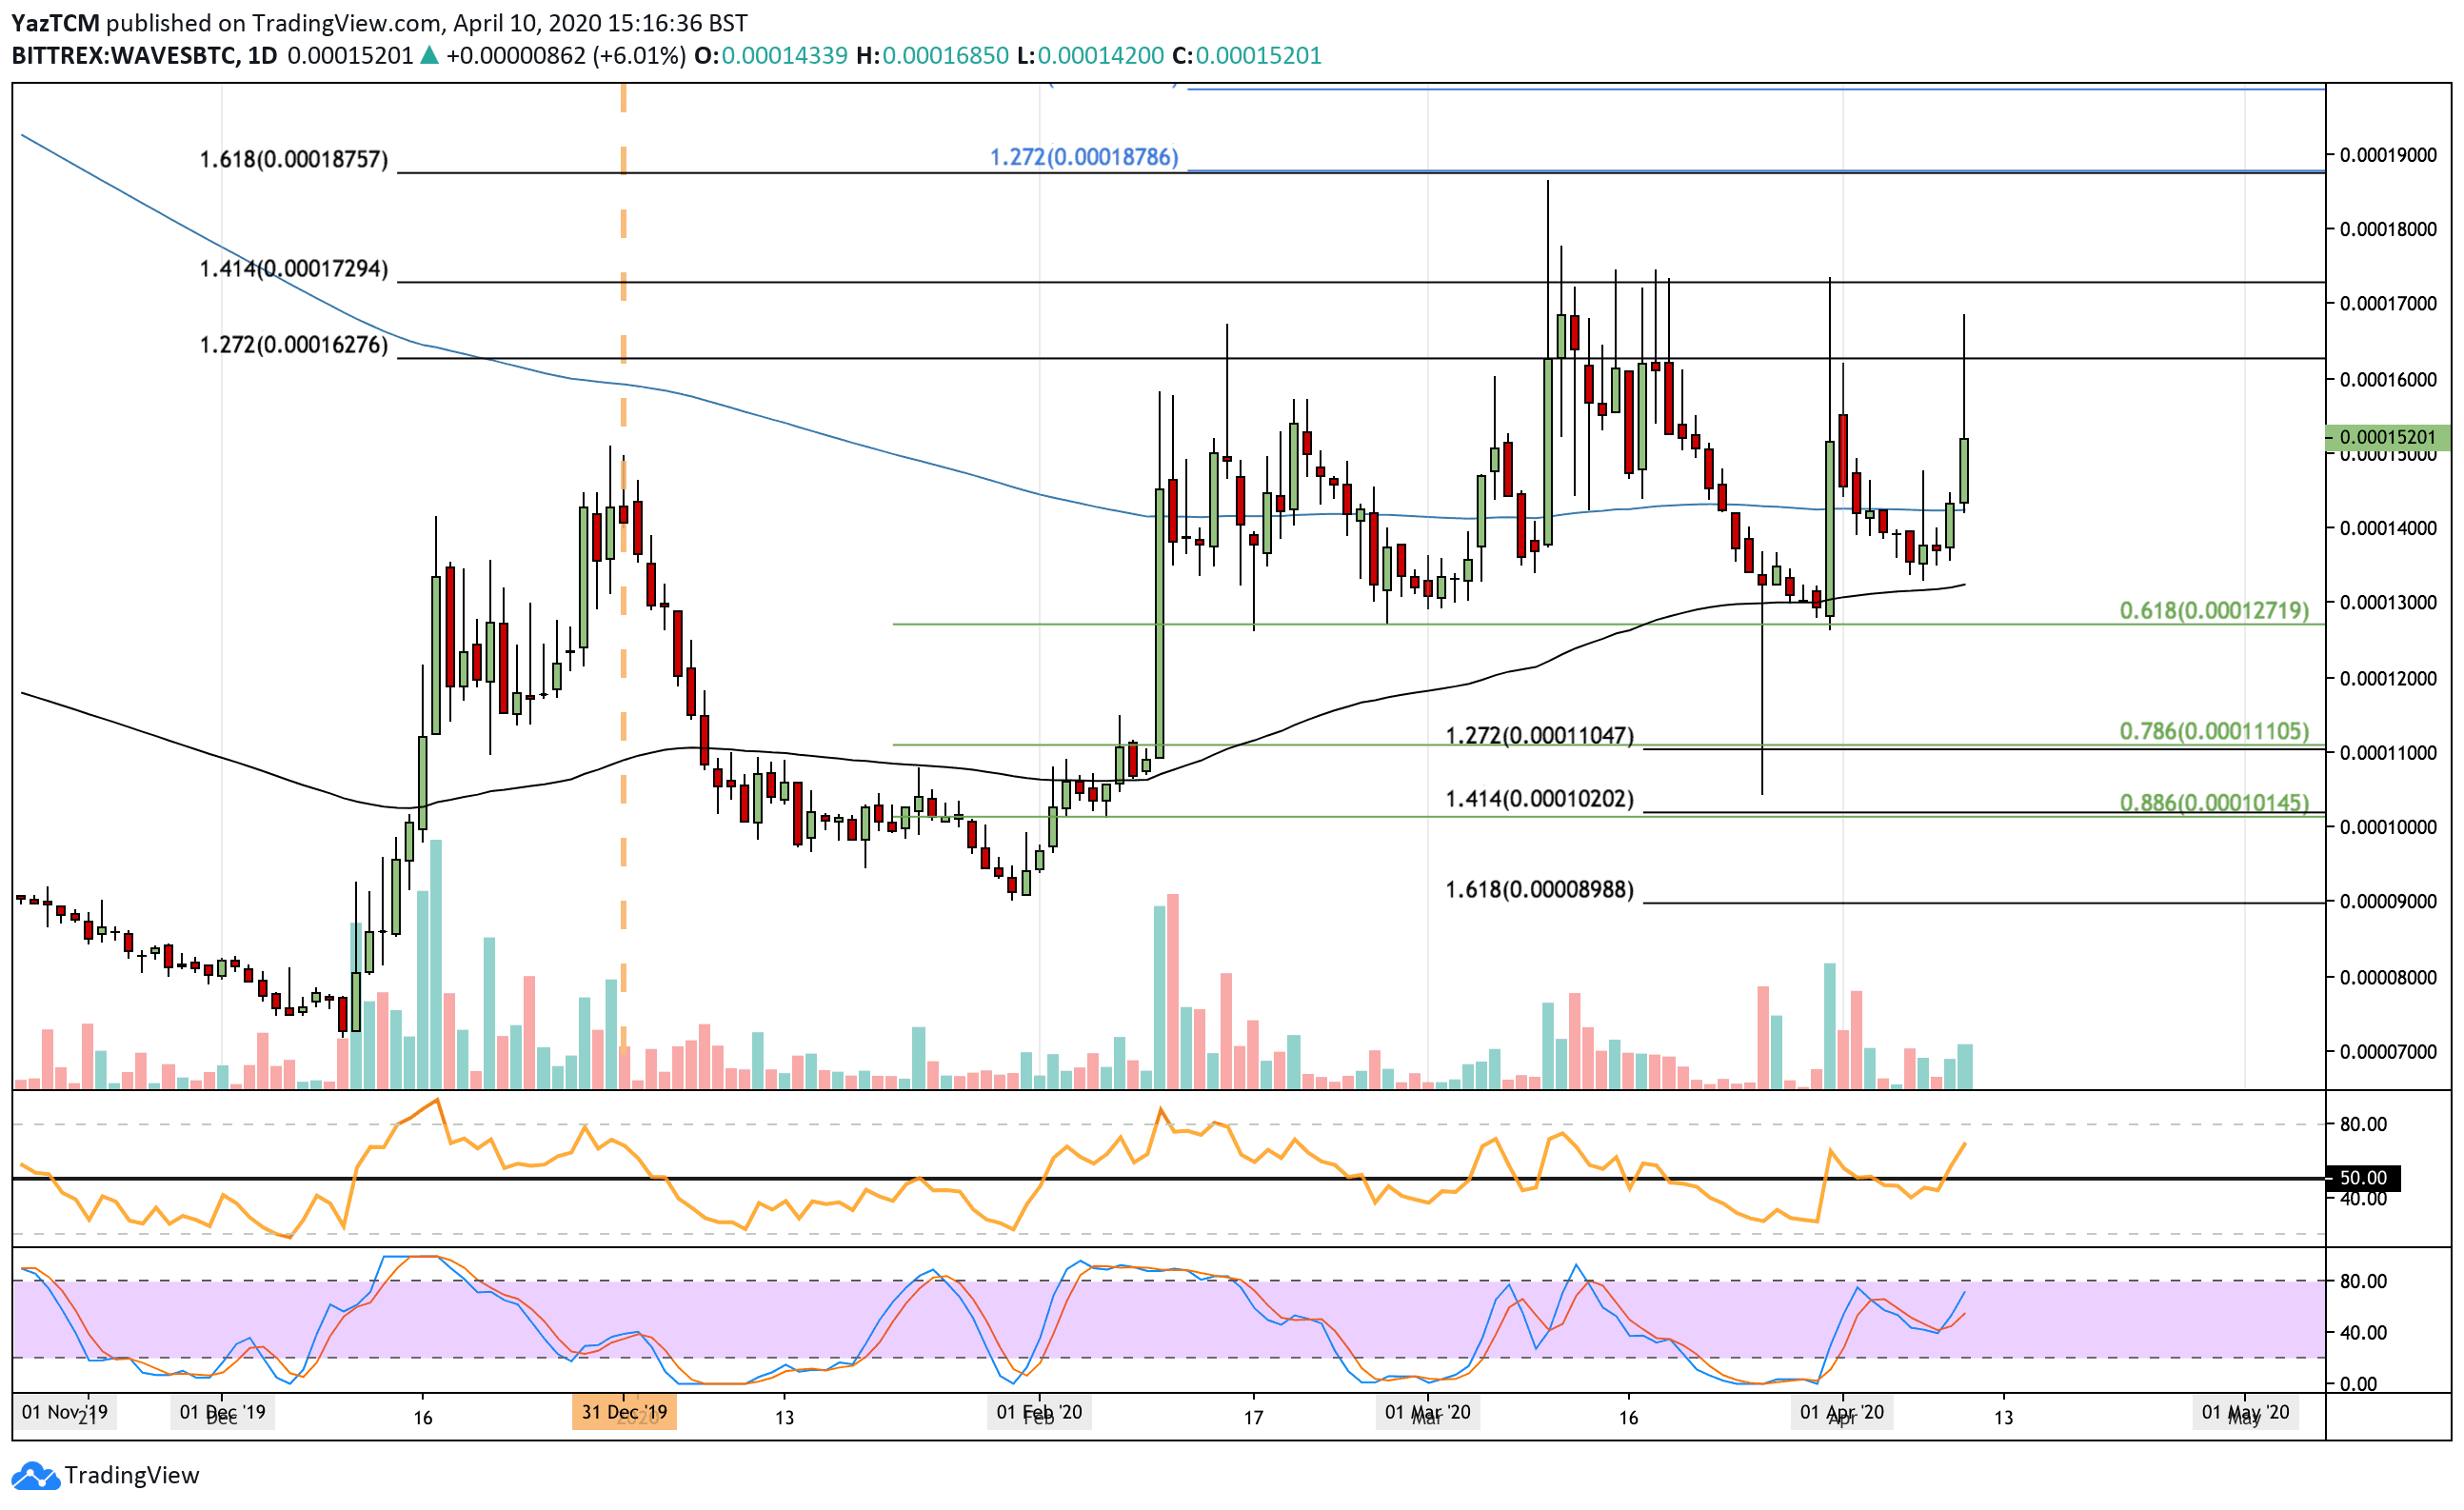
Waves
WAVES witnessed a sharp 8.5% price hike over the past week as the cryptocurrency climbed above $1.05. It is still trapped within a rising price channel and must break this for a strong bullish run to form.
From above, the first level of resistance beyond the channel lies at $1.10 (200-days EMA. Above this, resistance lies at $1.15 (bearish .5 Fib Retracement), $1.30 (bearish .618 Fib Retracement), and $1.40.
From below, the first level of support lies at $1.00. Beneath this, support lies at $0.95, $0.90, and then the lower boundary of the price channel.

Against Bitcoin, WAVES has also been performing relatively well. The cryptocurrency dropped as low as 13,500 SAT during the week but since rebounded to reach the current 15,200 SAT level, climbing above the 200-days EMA. It still must close above 17,000 SAT for a bullish trend to form.
From above, the first level of strong resistance lies at 16,000 SAT. Above this, resistance lies at 17,000 SAT, 18,000 SAT, and 18,780 SAT.
Alternatively, if the sellers push lower, support lies at 14,000 SAT (200-days EMA). Beneath this, support lies at 13,000 SAT (100-days EMA), 12,700 SAT (.618 Fib Retracement), and 12,000 SAT.
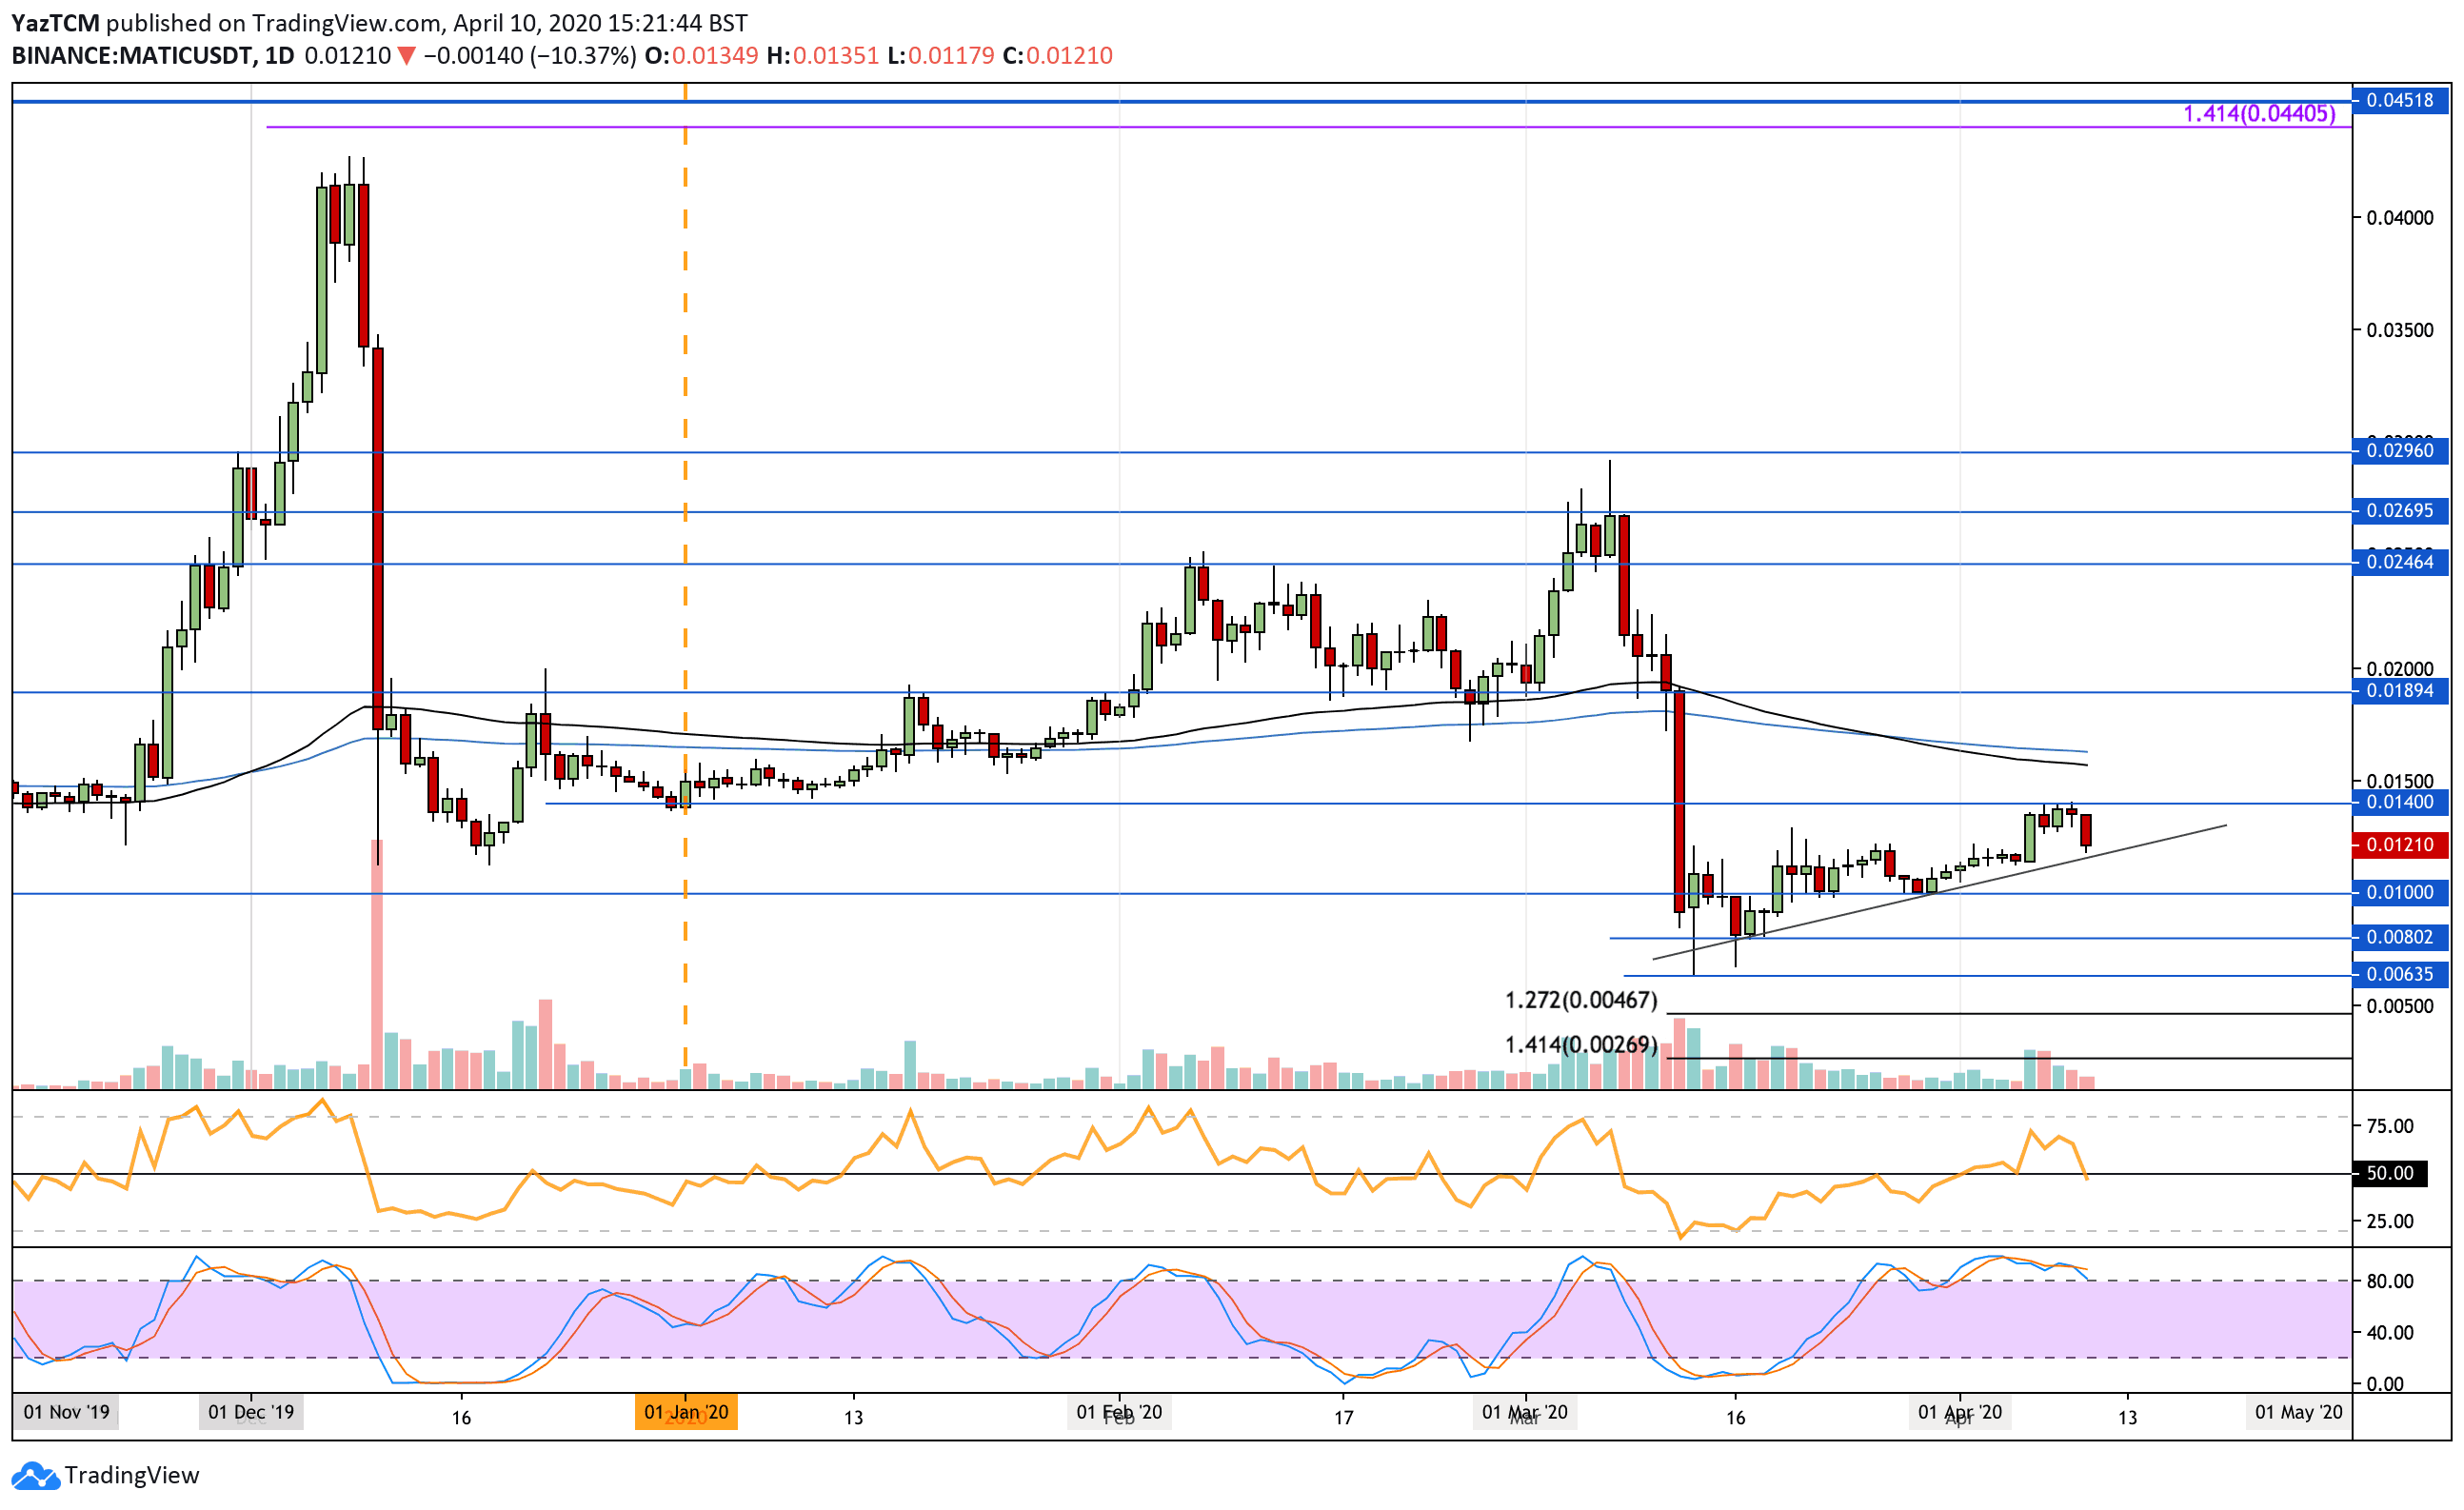
Matic
Matic dropped by a steep 12% today. However, it had increased by a total of 24% during the week to reach a high of $0.014. This brings the total 7-day price increase to a small 4% as it now trades at $0.0119.
If the buyers can regain control and push higher, the first level of resistance lies at $0.14. Above this, resistance lies at $0.15 (100-days EMA), $0.18, and $0.20.
On the other side, the first level of support lies in the rising support trend line. Beneath $0.12, added support lies at $0.01, $0.008, and $0.006.
Against Bitcoin, MATIC developed a strong support level at the 160 SAT price range during the final 2-weeks of March 2020. It went on to climb from here this week to reach as high as 192 SAT but has since dropped to 176 SAT.
From below, the first level of support lies at 165 SAT. Beneath this, support lies at 160 SAT, 150SAT, and 140 SAT.
On the other side, if the buyers can break 192 SAT, resistance lies at 200 SAT (100-days and &200-days EMAs). Above this, added resistance lies at 231 SAT and 251 SAT.
