Tezos dropped by a sharp 9% today as the cryptocurrency falls from .18 to reach .91.Despite this recent price drop, Tezos is still up by a total of 12% on the week.The cryptocurrency also rolled over against Bitcoin as it falls to 0.00028 BTC.Key Support & Resistance LevelsXTZ/USD:Support: .90, .85, .80.Resistance: .18, .34, .45.XTZ/BTC:Support: 0.00028 BTC, 0.00027 BTC, 0.00026 BTC.Resistance: 0.000292 BTC, 0.000308 BTC, 0.000324 BTC.XTZ/USD – Tezos Drops From Bearish .5 Fib RetracementTezos started this week off by breaking above the upper boundary of its previous ascending triangle pattern at .80. It then went on to surge higher as it broke past the 100-days EMA at .00 to reach the resistance at .18, provided by a bearish .5 Fibonacci Retracement level.It since
Topics:
Yaz Sheikh considers the following as important: Price Analysis, Tezos (XTZ) Price, XTZBTC, XTZUSD
This could be interesting, too:
CryptoVizArt writes ETH’s Path to K Involves Maintaining This Critical Support (Ethereum Price Analysis)
Duo Nine writes Crypto Price Analysis June-29: ETH, XRP, ADA, DOGE, and DOT
Duo Nine writes Crypto Price Analysis June-15: ETH, XRP, ADA, DOGE, and DOT
Duo Nine writes Why is the Shiba Inu (SHIB) Price Down Today?
- Tezos dropped by a sharp 9% today as the cryptocurrency falls from $2.18 to reach $1.91.
- Despite this recent price drop, Tezos is still up by a total of 12% on the week.
- The cryptocurrency also rolled over against Bitcoin as it falls to 0.00028 BTC.
Key Support & Resistance Levels
XTZ/USD:
Support: $1.90, $1.85, $1.80.
Resistance: $2.18, $2.34, $2.45.
XTZ/BTC:
Support: 0.00028 BTC, 0.00027 BTC, 0.00026 BTC.
Resistance: 0.000292 BTC, 0.000308 BTC, 0.000324 BTC.
XTZ/USD – Tezos Drops From Bearish .5 Fib Retracement
Tezos started this week off by breaking above the upper boundary of its previous ascending triangle pattern at $1.80. It then went on to surge higher as it broke past the 100-days EMA at $2.00 to reach the resistance at $2.18, provided by a bearish .5 Fibonacci Retracement level.
It since dropped from here as it dips back beneath $2.00 to find support at the 100-days EMA at $1.96.
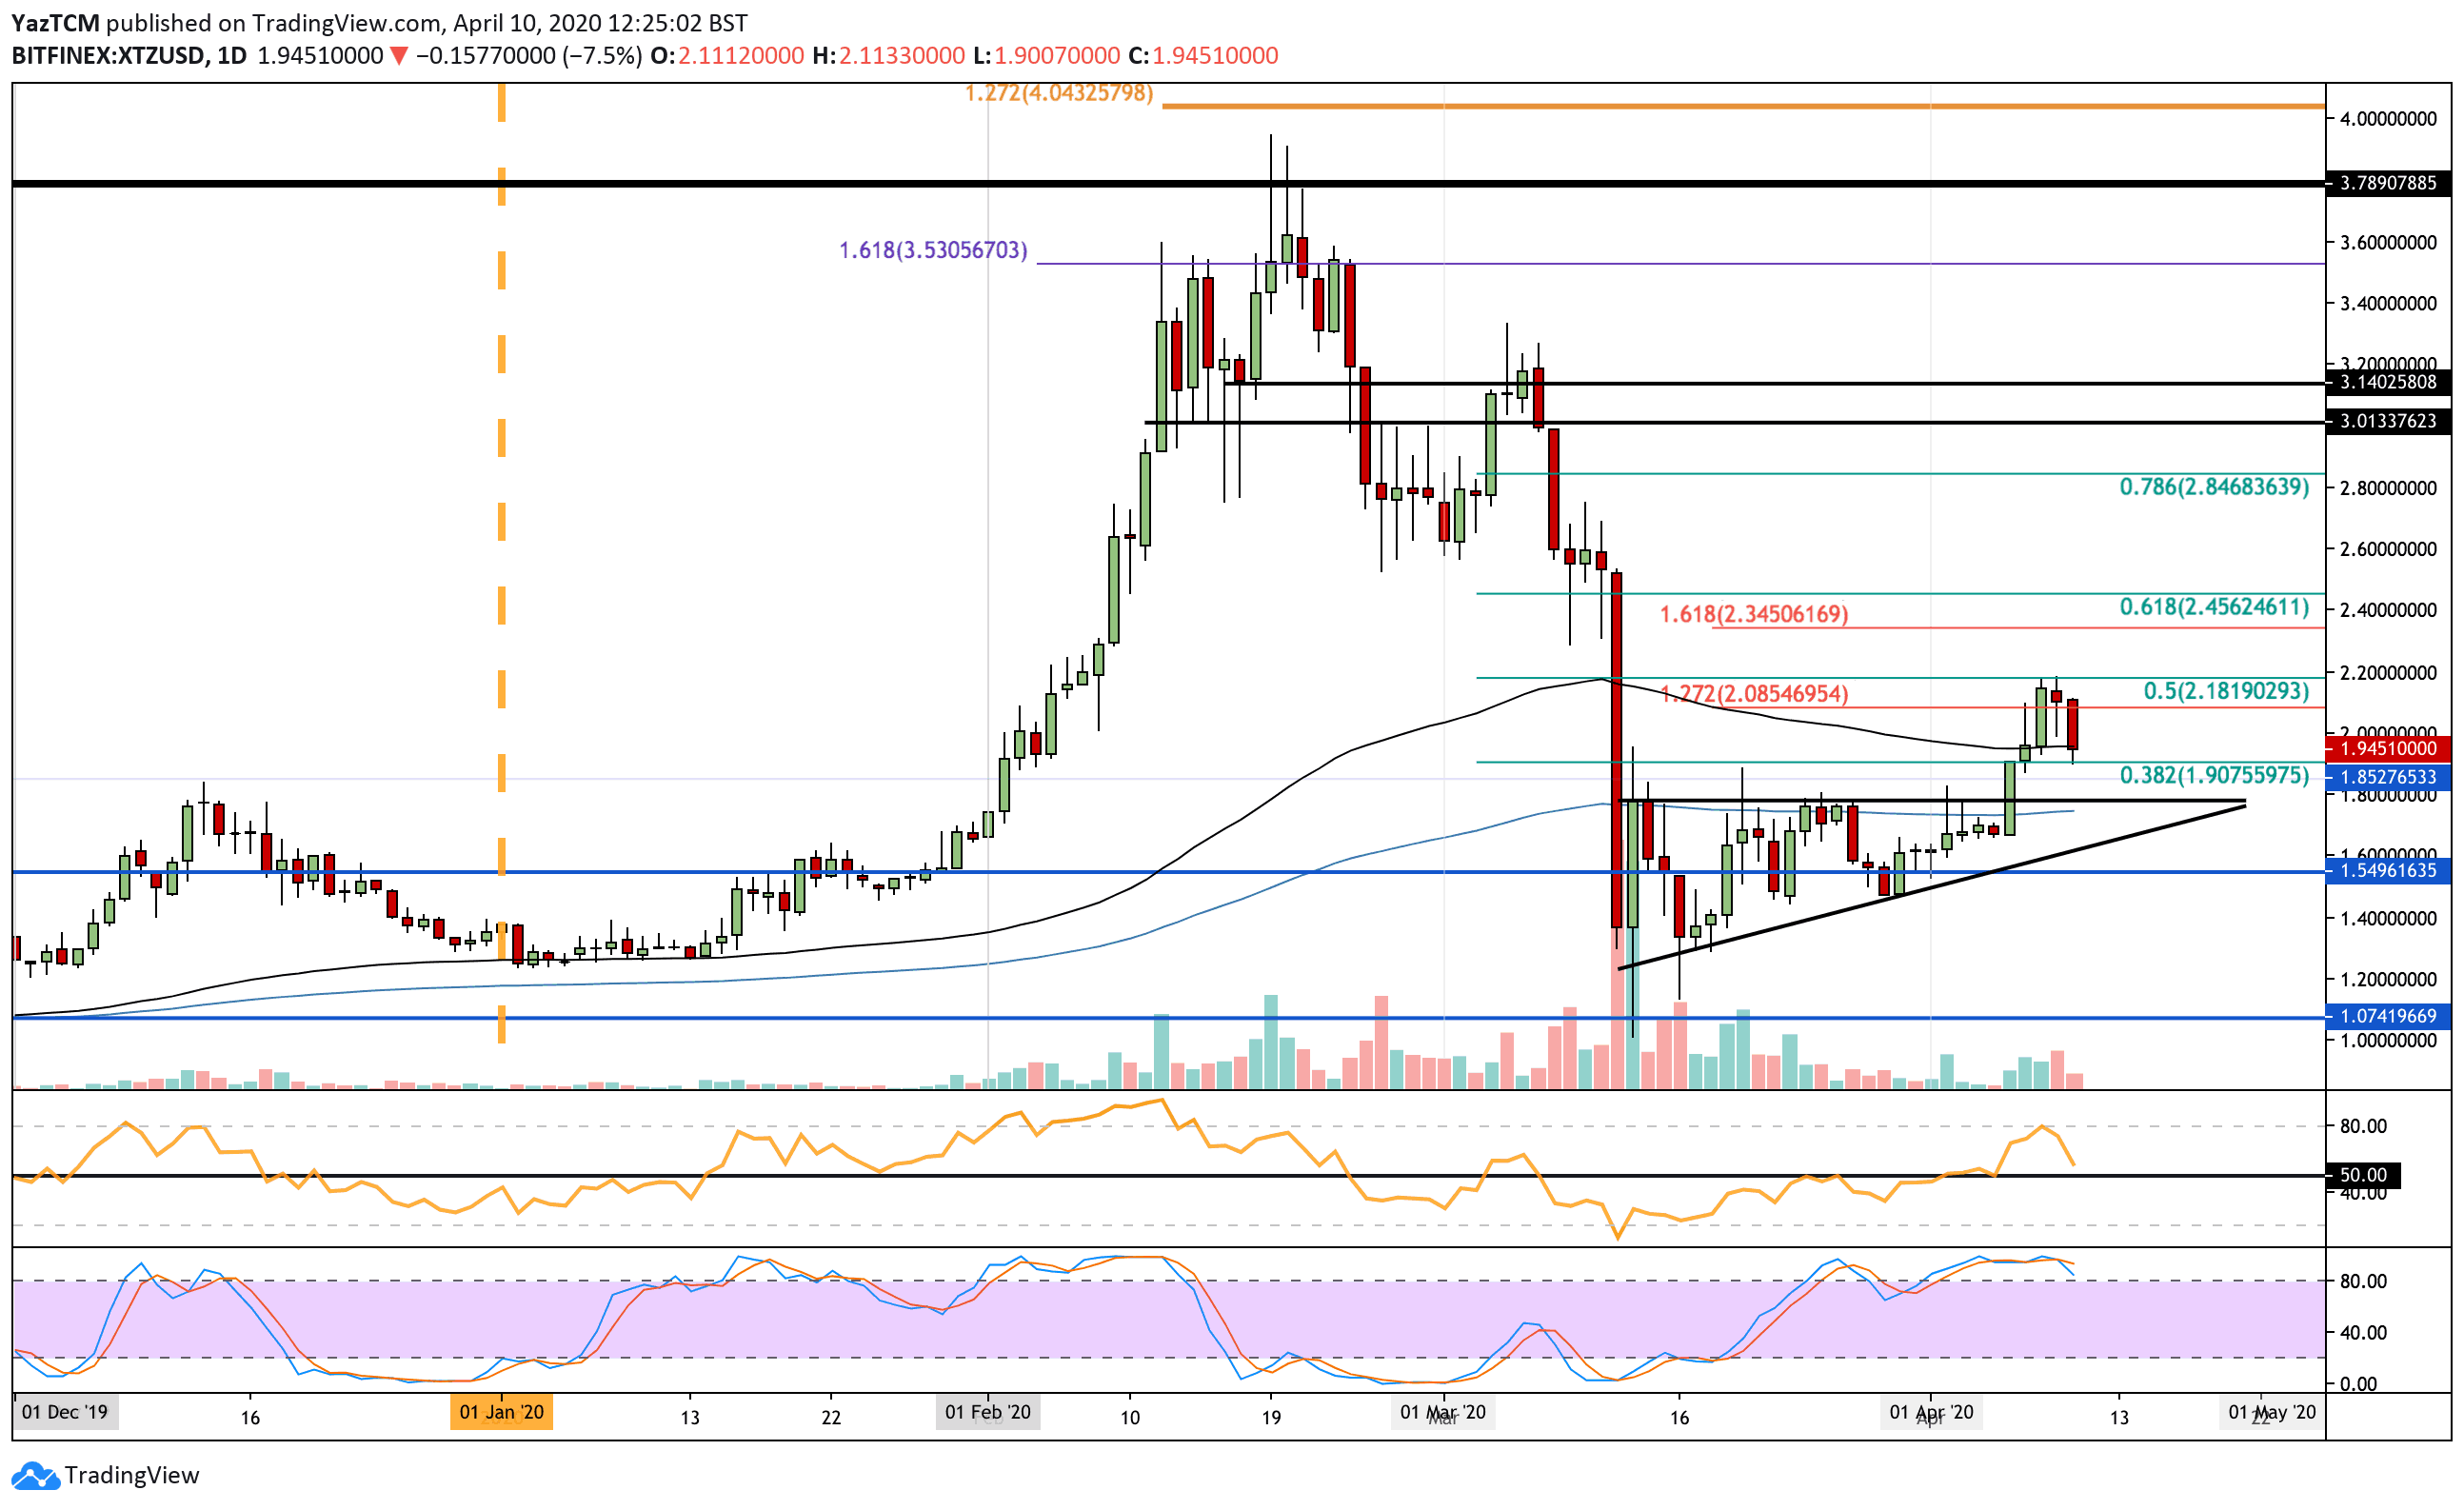
XTZ-USD Short Term Price Prediction
If the sellers continue to push Tezos lower, support can be expected at $1.90, $1.85, and $1.80. Beneath this, additional support lies at $1.75 (200-days EMA) and $1.60.
On the other side, if the bulls rebound from the 100-day EMA and break above $2.00, resistance is located at $2.18 (bearish .5 Fib Retracement), $2.34 (1.618 Fib Extension), and $2.45 (bearish .618 Fib Retracement).
The RSI has now rolled over as it re-approaches the 50 level. So long as it can stay above 50, the bulls will remain in charge and push Tezos higher.
XTZ/BTC – Tezos Fails To Reach 0.0003 BTC.
Against Bitcoin, Tezos managed to find support at the 0.000241 BTC level, where it rebounded from this week. It went on to climb as it breached 0.00027 BTC and reached resistance at 0.000292 BTC, provided by a bearish .382 Fib Retracement.
Tezos has dropped from here as it falls to the 0.00028 BTC level.
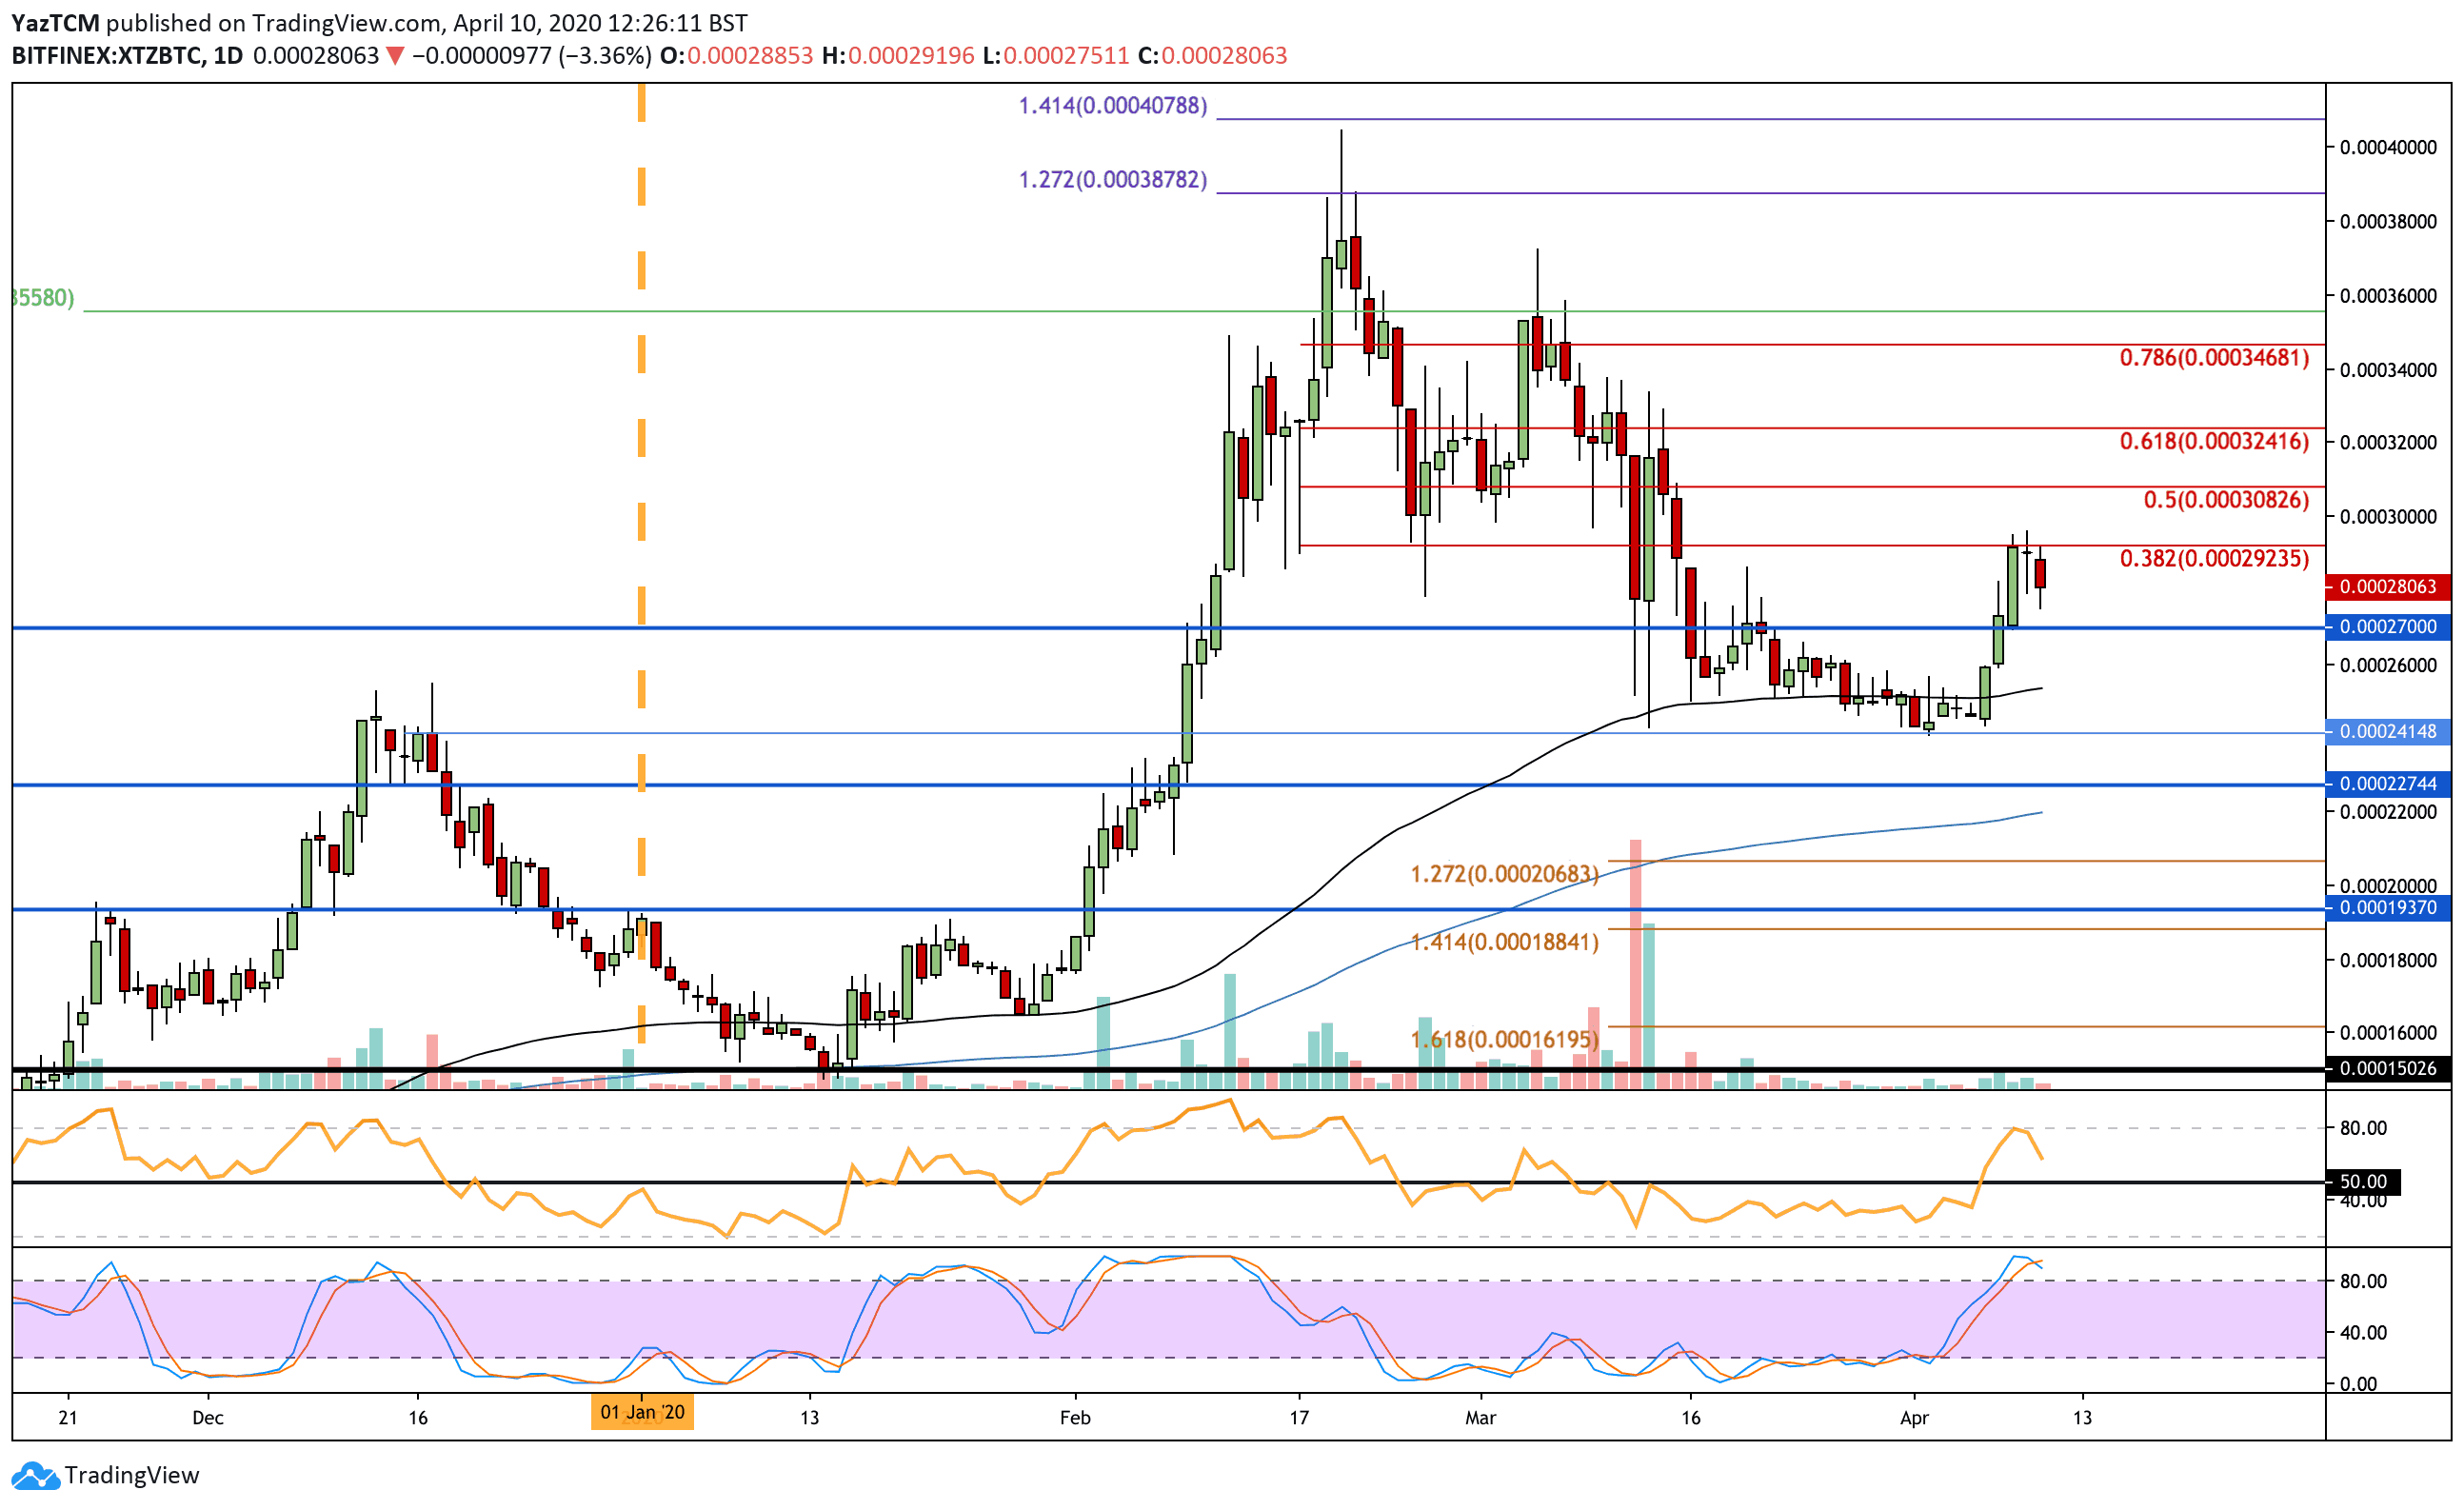
XTZ-BTC Short Term Price Prediction
If the sellers push beneath 0.00028 BTC, the first level of support lies at 0.00027 BTC. Beneath this, support lies at 0.00026 BTC, 0.000255 BTC (100-days EMA), and 0.000241 BTC. Following this, additional support is expected at 0.000227 BTC and 0.00022 BTC (200-days EMA).
Alternatively, if the buyers can regroup and push higher, they will first need to overcome resistance at 0.000292 BTC. If they can break 0.0003 BTC, added resistance lies at 0.000308 BTC (bearish .5 Fib Retracement) and 0.000324 BTC (bearish .618 Fib Retracement).
The RSI has rolled over from near overbought conditions as the buying momentum starts to weaken. Additionally, the Stochastic RSI has produced a bearish crossover signal, which suggests that the market will be headed lower.