BitcoinBitcoin moved sideways this week as a consolidation pattern appeared in the form of a symmetrical triangle. This triangle is best seen on the hourly charts and is highlighted by the white boundaries.The cryptocurrency dropped by a steep 15% in September from ,000 to the current ,260 level. The ,000 level provided strong support throughout the week and allowed the bulls to start to edge higher again. However, it is still trapped within the confines of the symmetrical triangle, and a breakout of this would determine the next direction for the market.If the buyers can push above the upper boundary of the triangle, the first level of higher resistance lies at ,500. Beyond this, resistance is located at ,780, ,900, and ,000.On the other side, if the sellers break
Topics:
Yaz Sheikh considers the following as important: ADABTC, ADAUSD, Bitcoin (BTC) Price, BTC Analysis, btcusd, Cardano (ADA) Price, Chainlink (LINK) Price, ETH Analysis, ETHBTC, Ethereum (ETH) Price, ethusd, LINKBTC, LINKUSD, Market Updates, Price Analysis, Ripple (XRP) Price, XRP Analysis, xrpbtc, xrpusd
This could be interesting, too:
Chayanika Deka writes XRP, SOL, and ADA Inclusion in US Crypto Reserve Pushes Traders on Edge
Chayanika Deka writes Why Arthur Hayes Is Bullish on Bitcoin Under Trump’s Economic Strategy
Mandy Williams writes Why the Bitcoin Market Is Stuck—and the Key Metric That Could Change It: CryptoQuant CEO
Wayne Jones writes Metaplanet Acquires 156 BTC, Bringing Total Holdings to 2,391
Bitcoin
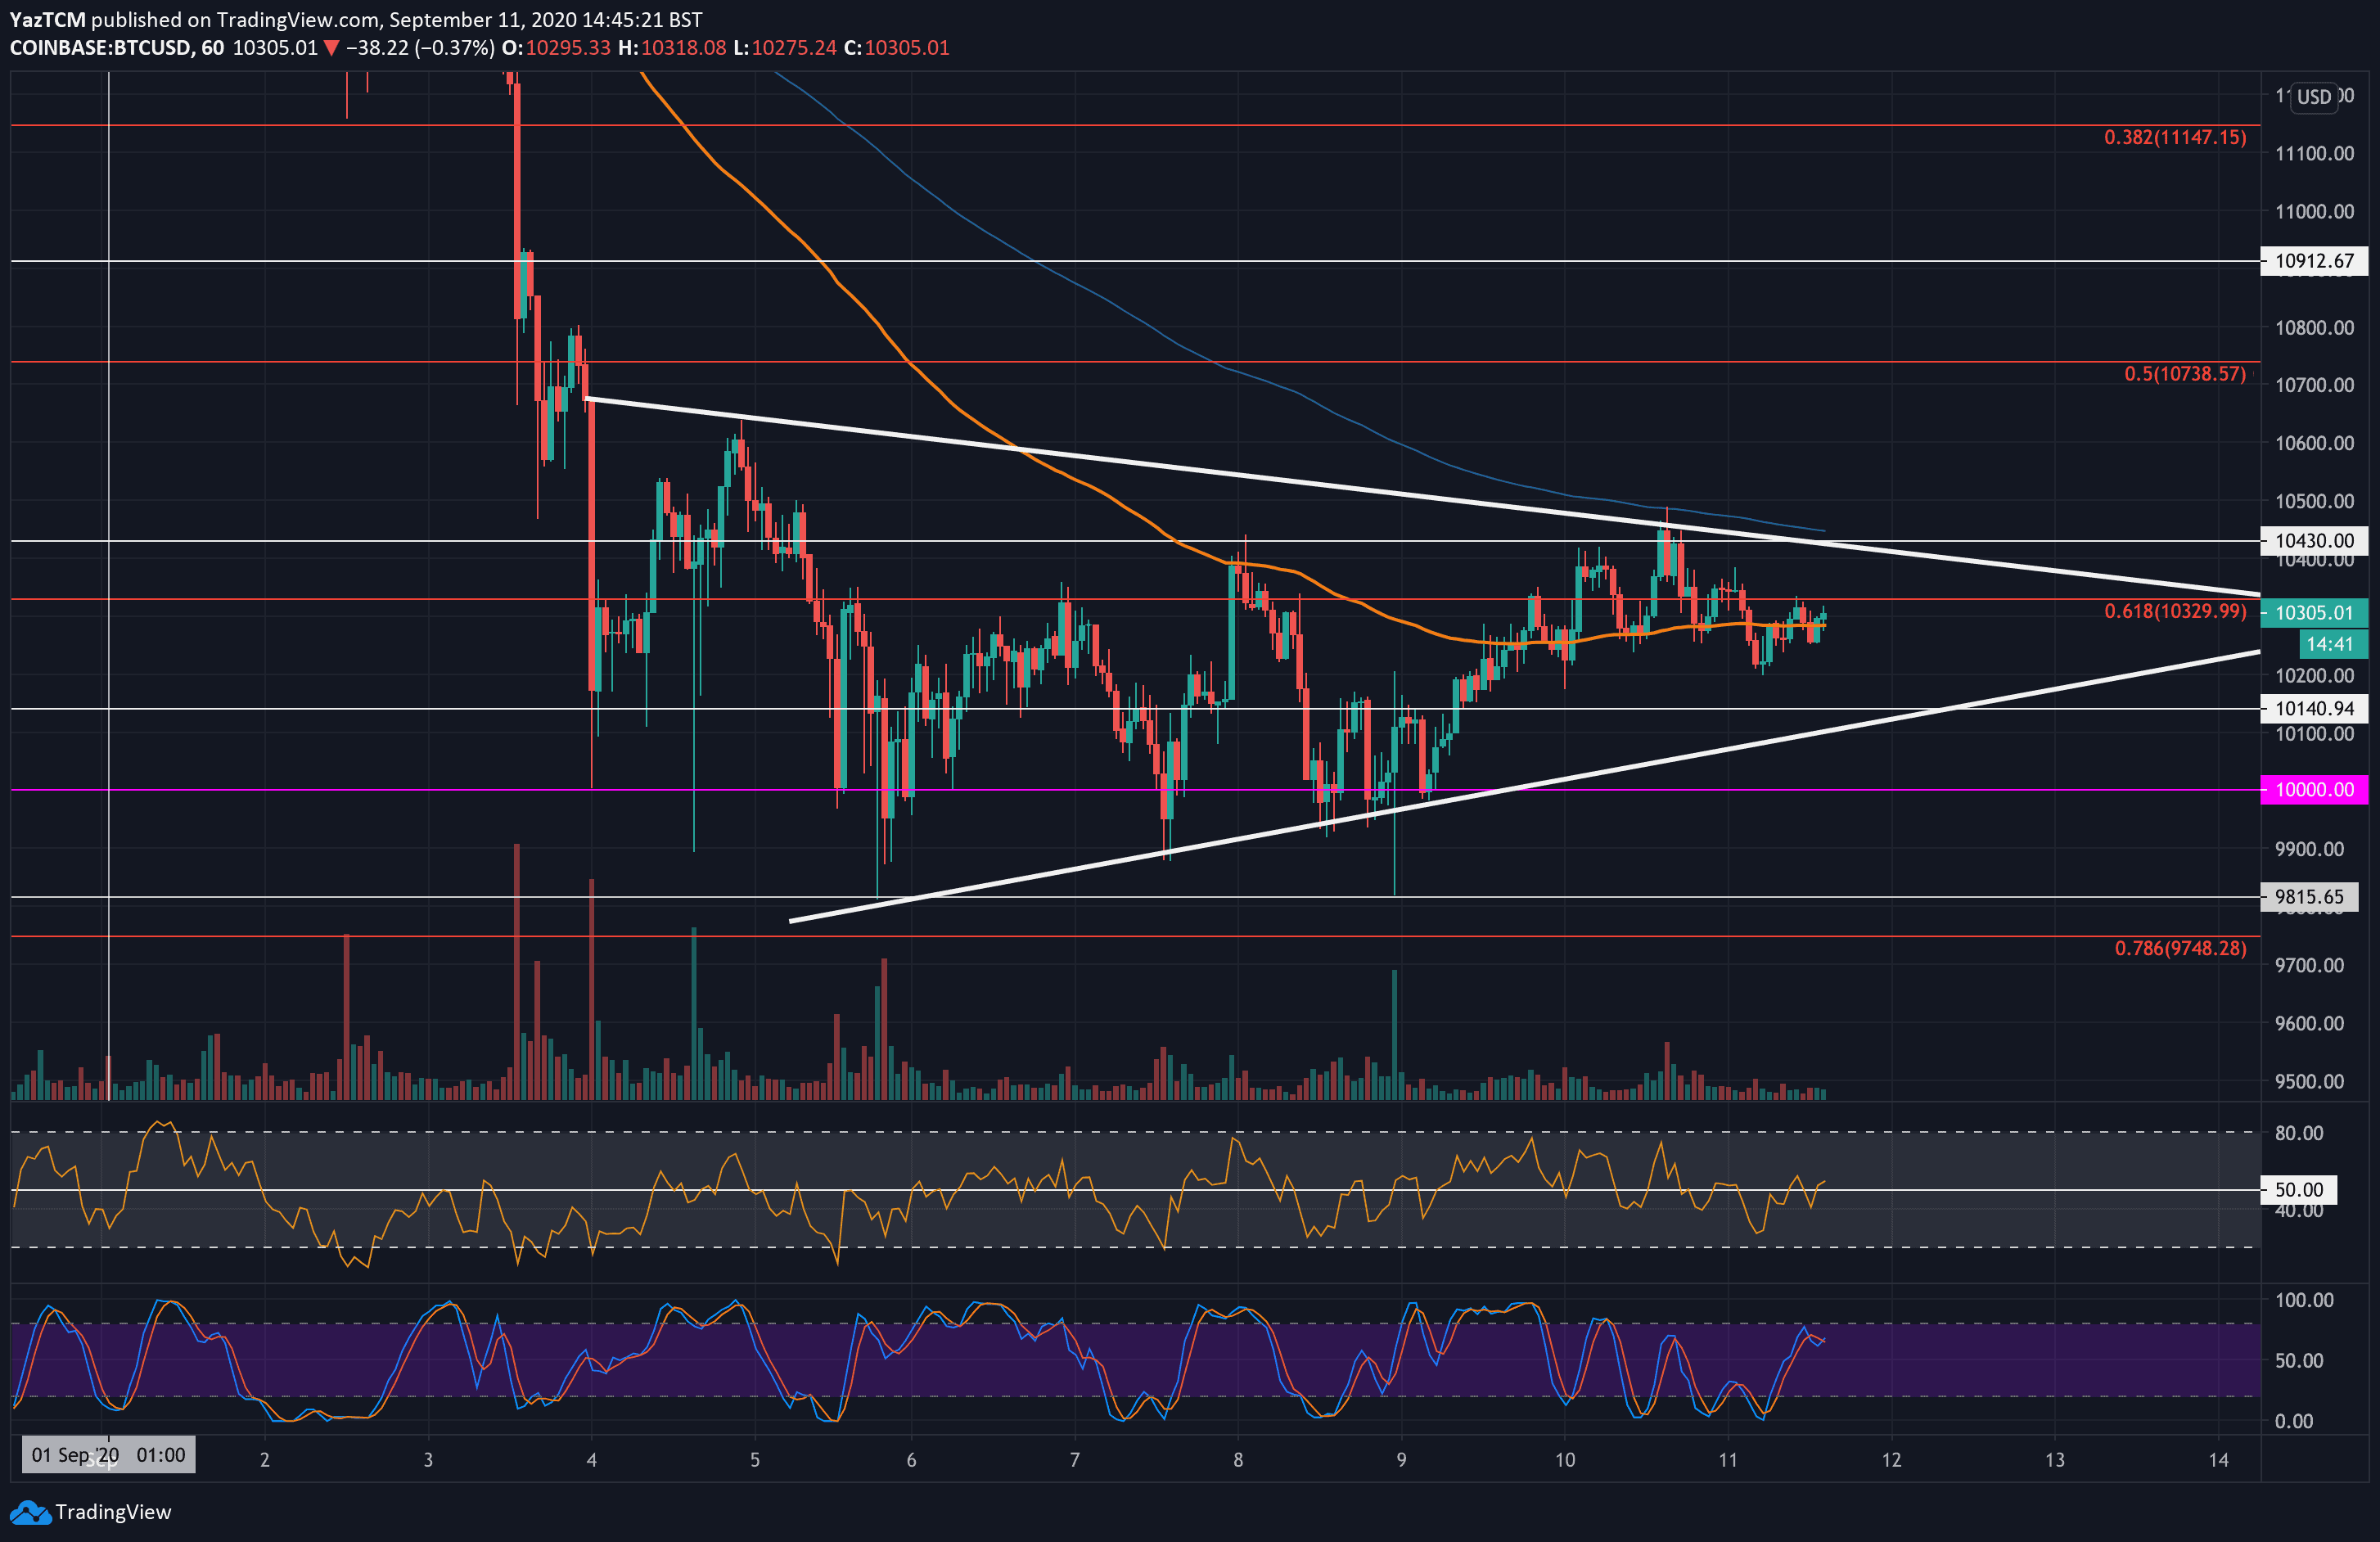
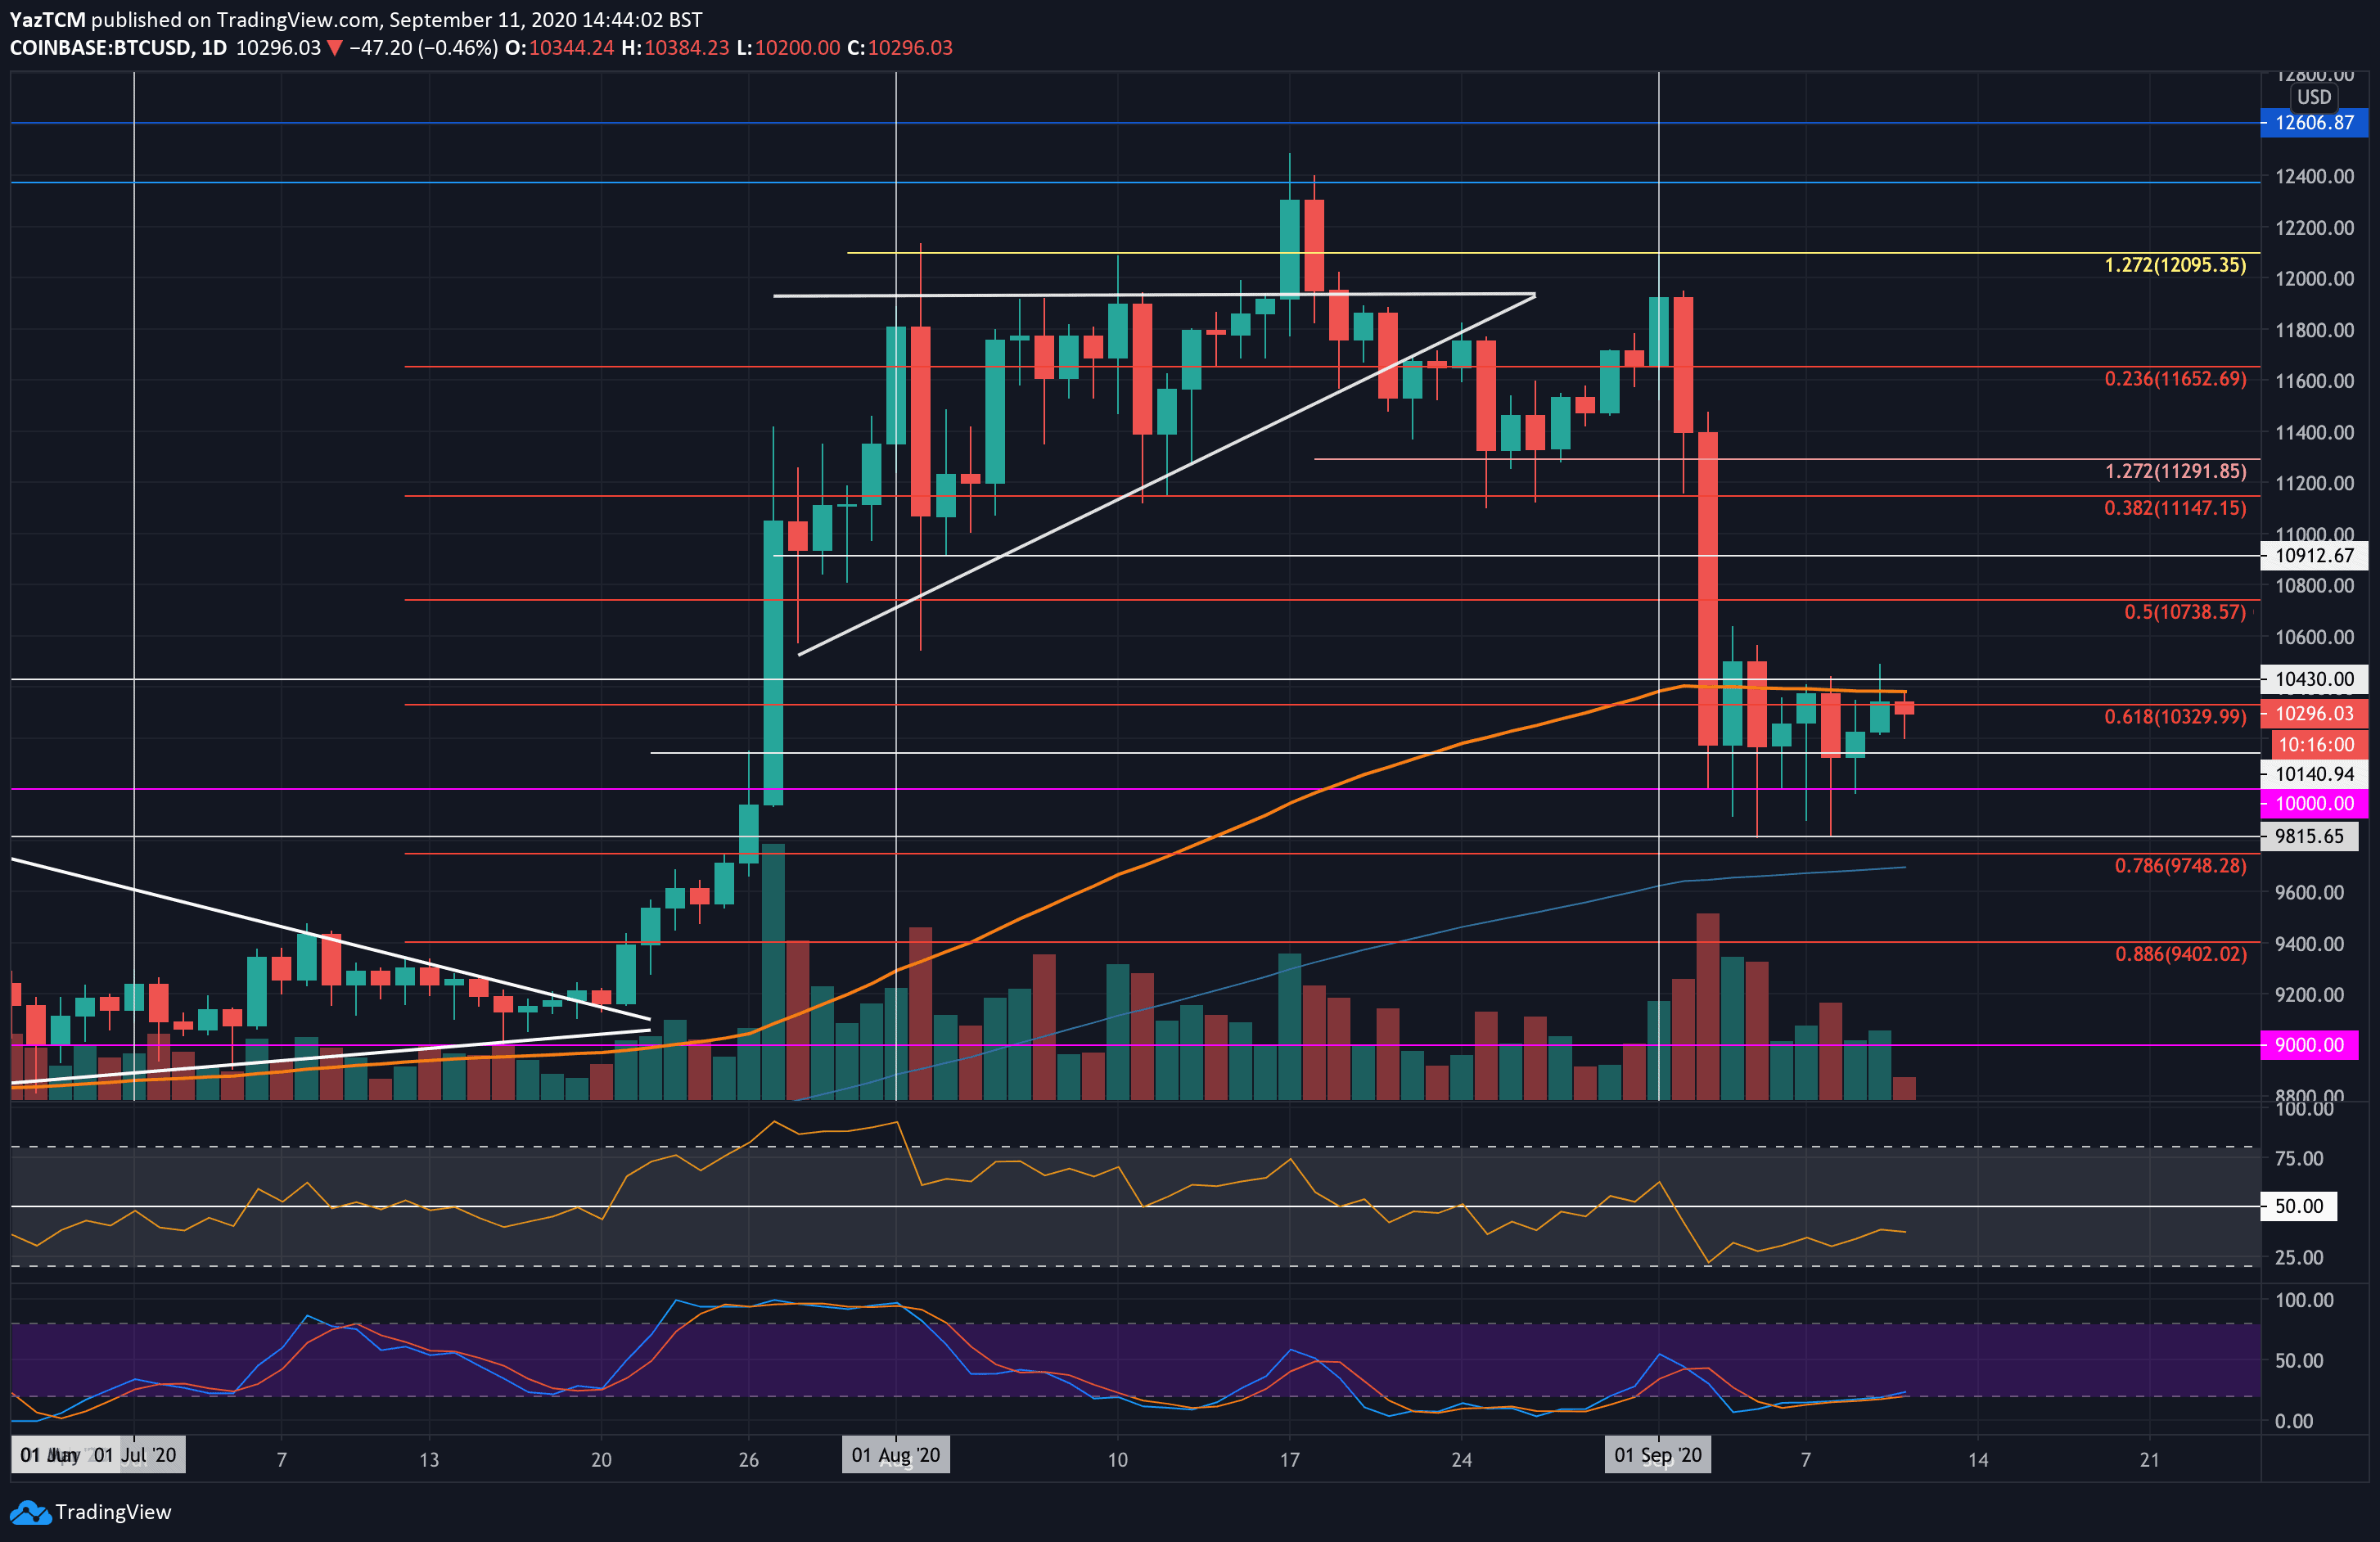
Bitcoin moved sideways this week as a consolidation pattern appeared in the form of a symmetrical triangle. This triangle is best seen on the hourly charts and is highlighted by the white boundaries.
The cryptocurrency dropped by a steep 15% in September from $12,000 to the current $10,260 level. The $10,000 level provided strong support throughout the week and allowed the bulls to start to edge higher again. However, it is still trapped within the confines of the symmetrical triangle, and a breakout of this would determine the next direction for the market.
If the buyers can push above the upper boundary of the triangle, the first level of higher resistance lies at $10,500. Beyond this, resistance is located at $10,780, $10,900, and $11,000.
On the other side, if the sellers break beneath this triangle’s lower boundary, support is found at $10,000. Beneath this, support is expected at $9,815, $9,700 (200-day EMA, .786 Fib Retracement, & CME Gap), and $9,400 (.886 Fib Retracement).
Ethereum
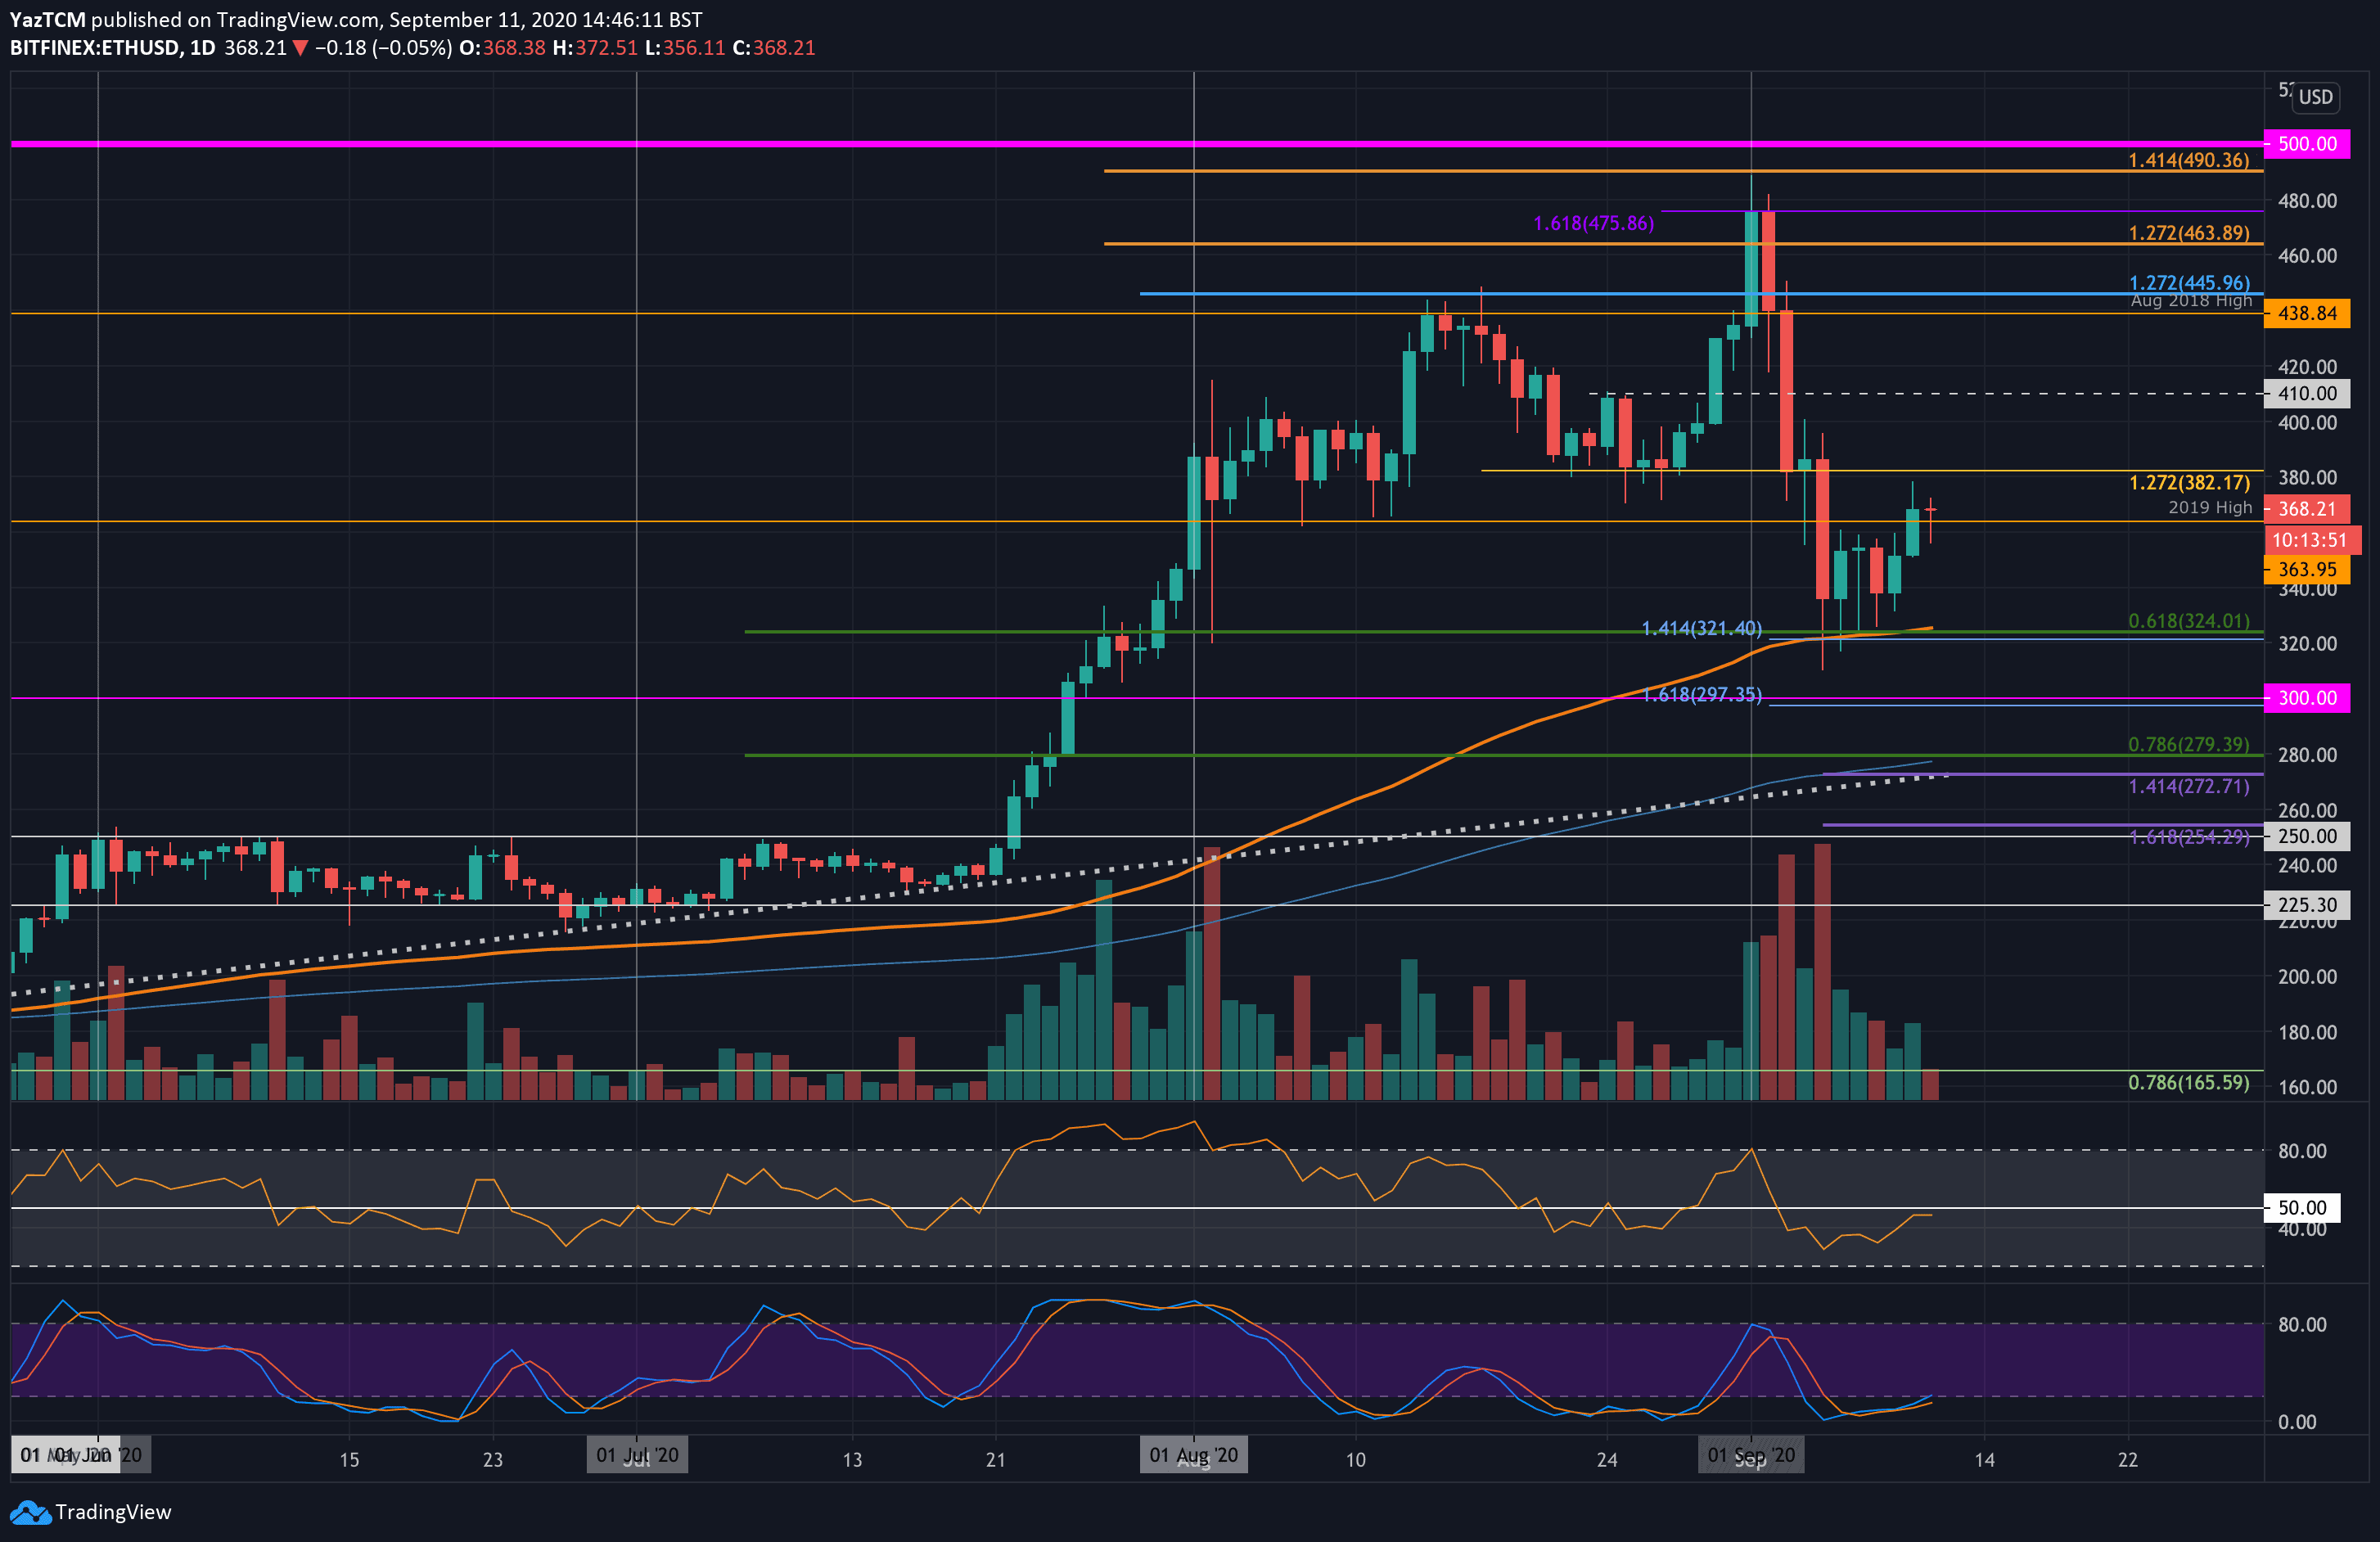
Ethereum is still down by around 6% over the past week. However, it is showing strong signs of recovering. Throughout the week, it found strong support around the $335 level where each daily candle closed. It did spike beneath this, but the buyers always rebounded around the $320 level.
Yesterday, Ethereum broke above the 2019 high at $365 and continued to edge close to $280. It has since dropped and it trades at $368.
Looking ahead, if the buyers push higher, the first level of resistance lies at $380. Beyond this, resistance is expected at $400, $410, and $438 (August 2018 High).
On the other side, the first level of support lies at $364 (2019 high). Beneath this, support lies at $340, $324 (.618 Fib Retracement & 100-day EMA), and $300.
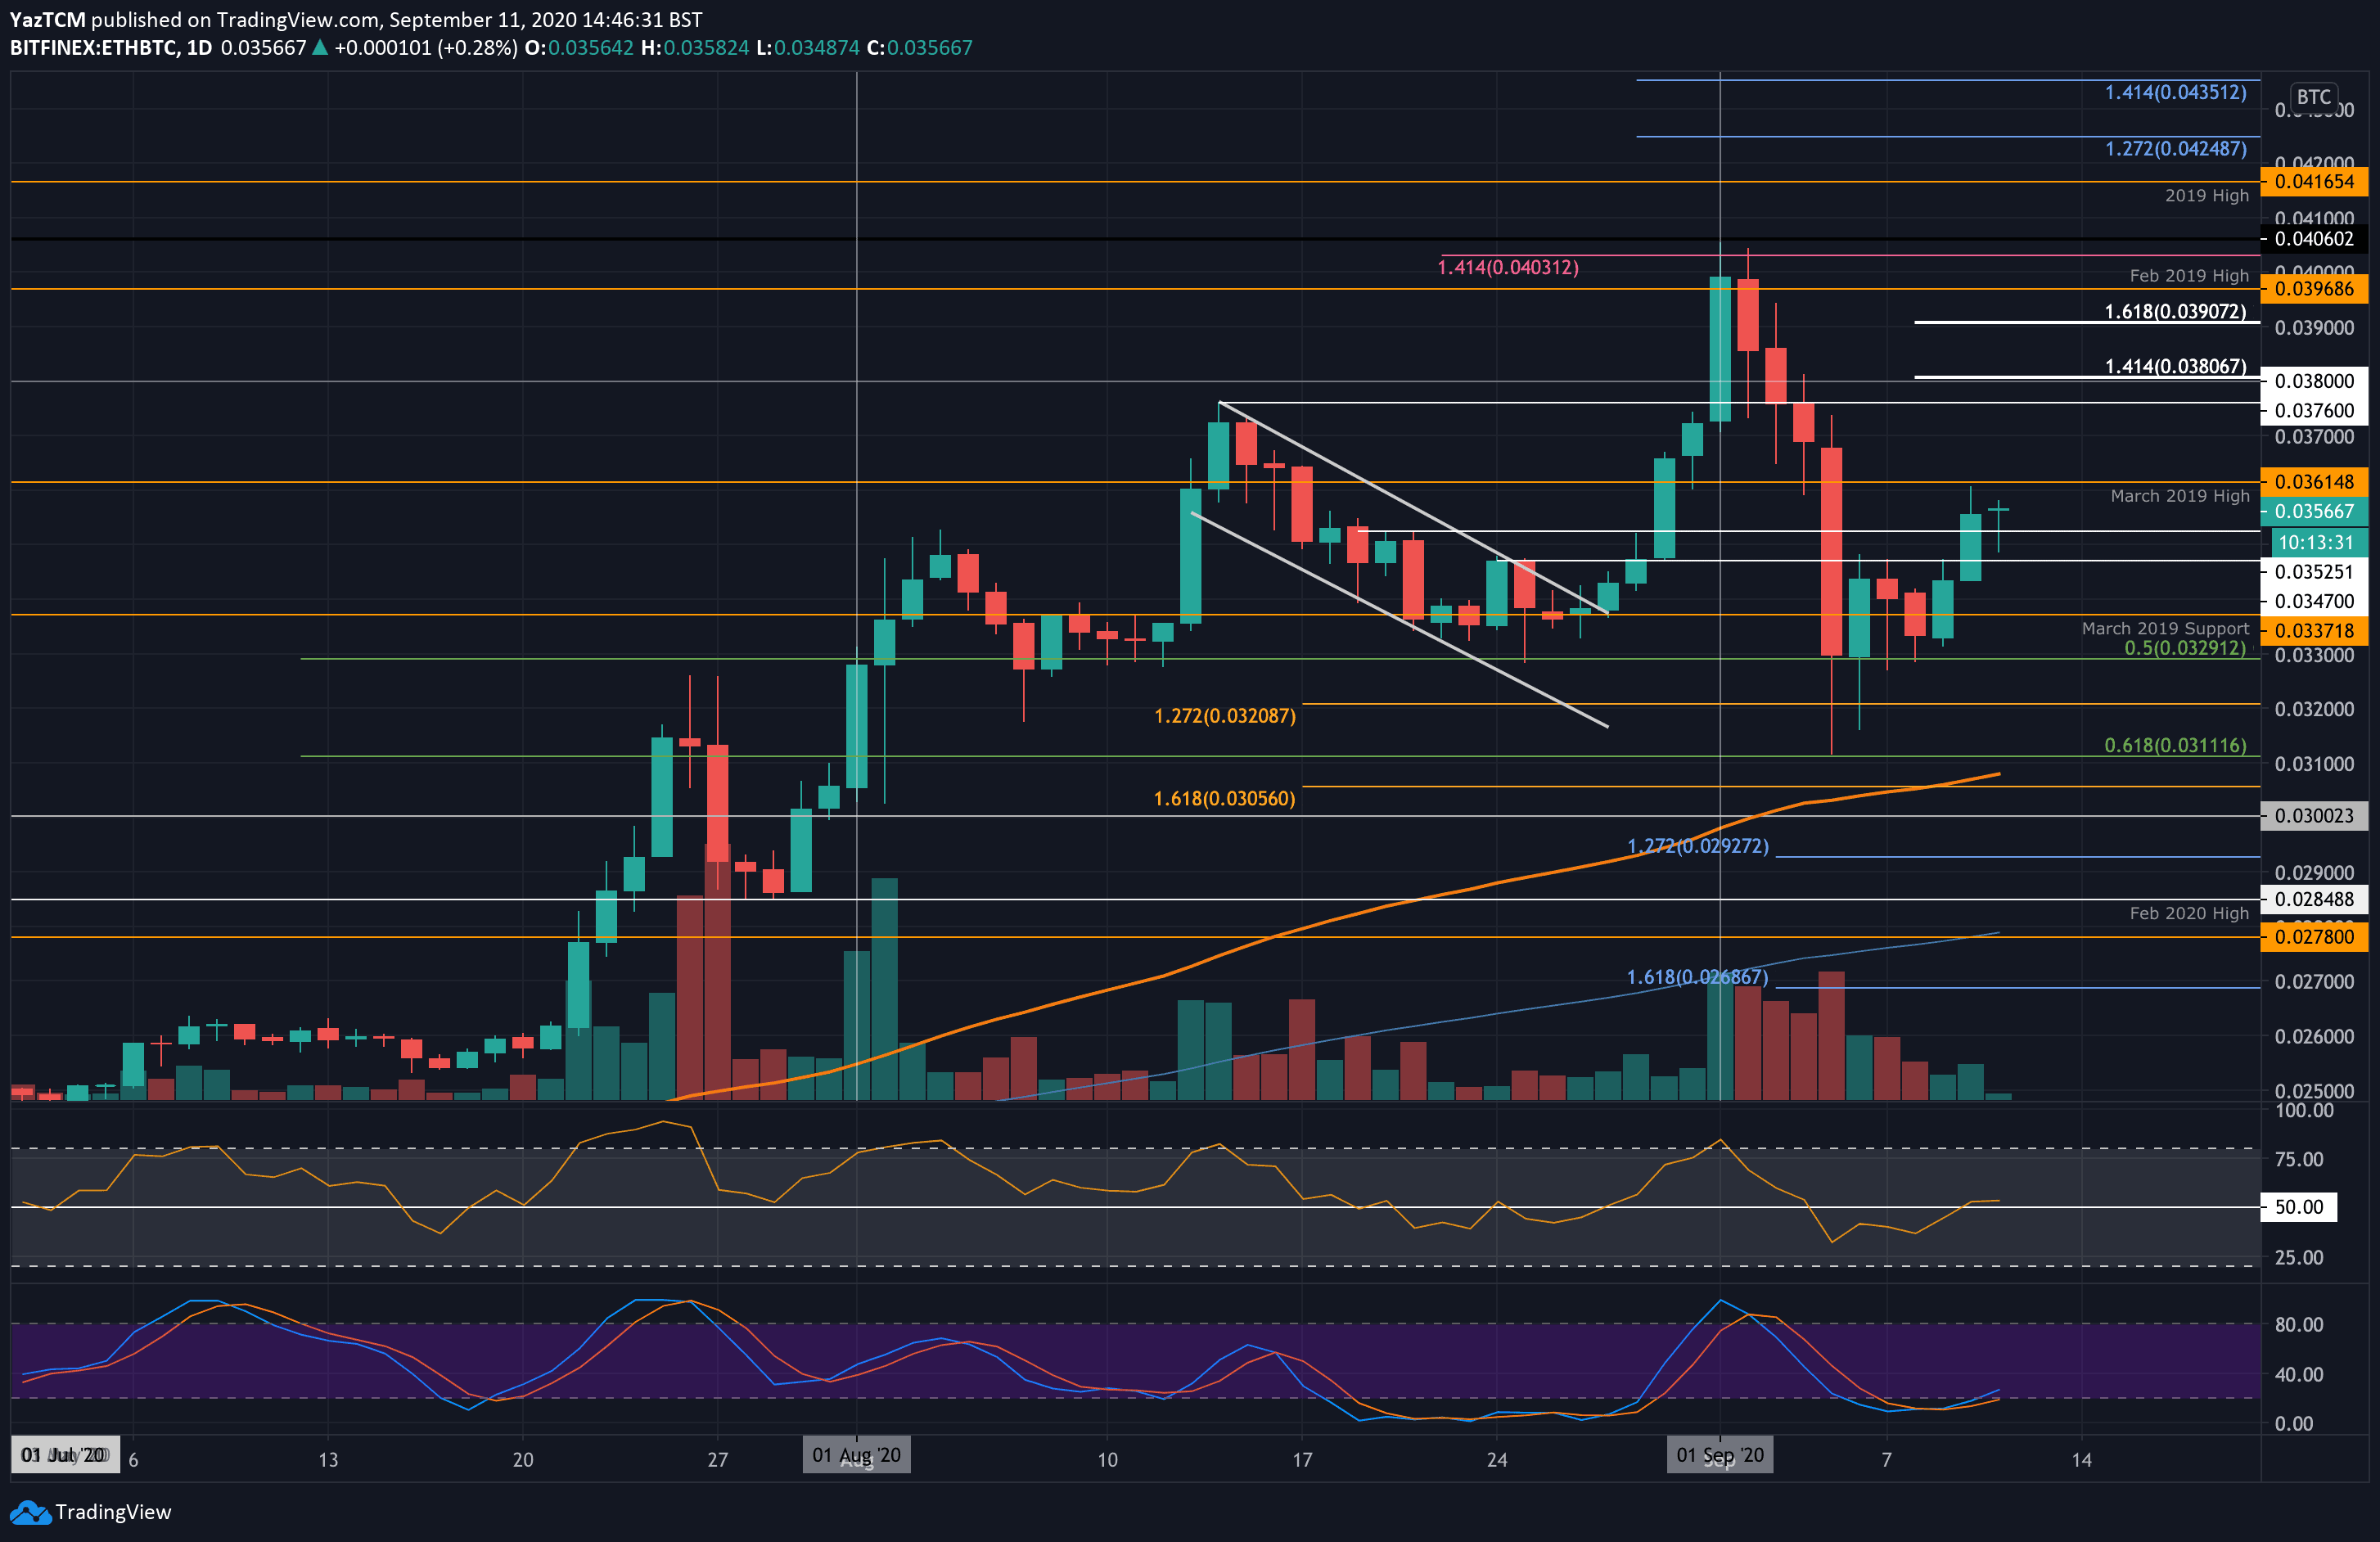
Ethereum is performing better against Bitcoin. The cryptocurrency dropped into the support at 0.0329 BTC (.5 Fib) during the week, and the bulls defended this level. They were initially bound by resistance at 0.0352 BTC, but they broke above yesterday as they reached 0.0361 BTC (March 2019 highs).
ETH dropped slightly and is now trading at around 0.0356 BTC.
Looking ahead, the first level of resistance lies at 0.0361 BTC (March 2019 High). Beyond this, resistance lies at 0.037 BTC, 0.038 BTC (1.414 Fib Extension), and 0.039 BTC (1.618 Fib Extension).
On the other side, support is first expected at 0.0352 BTC. This is followed by support at 0.0347 BTC, 0.0337 BTC, and 0.0329 BTC (.5 Fib Retracement).
Ripple
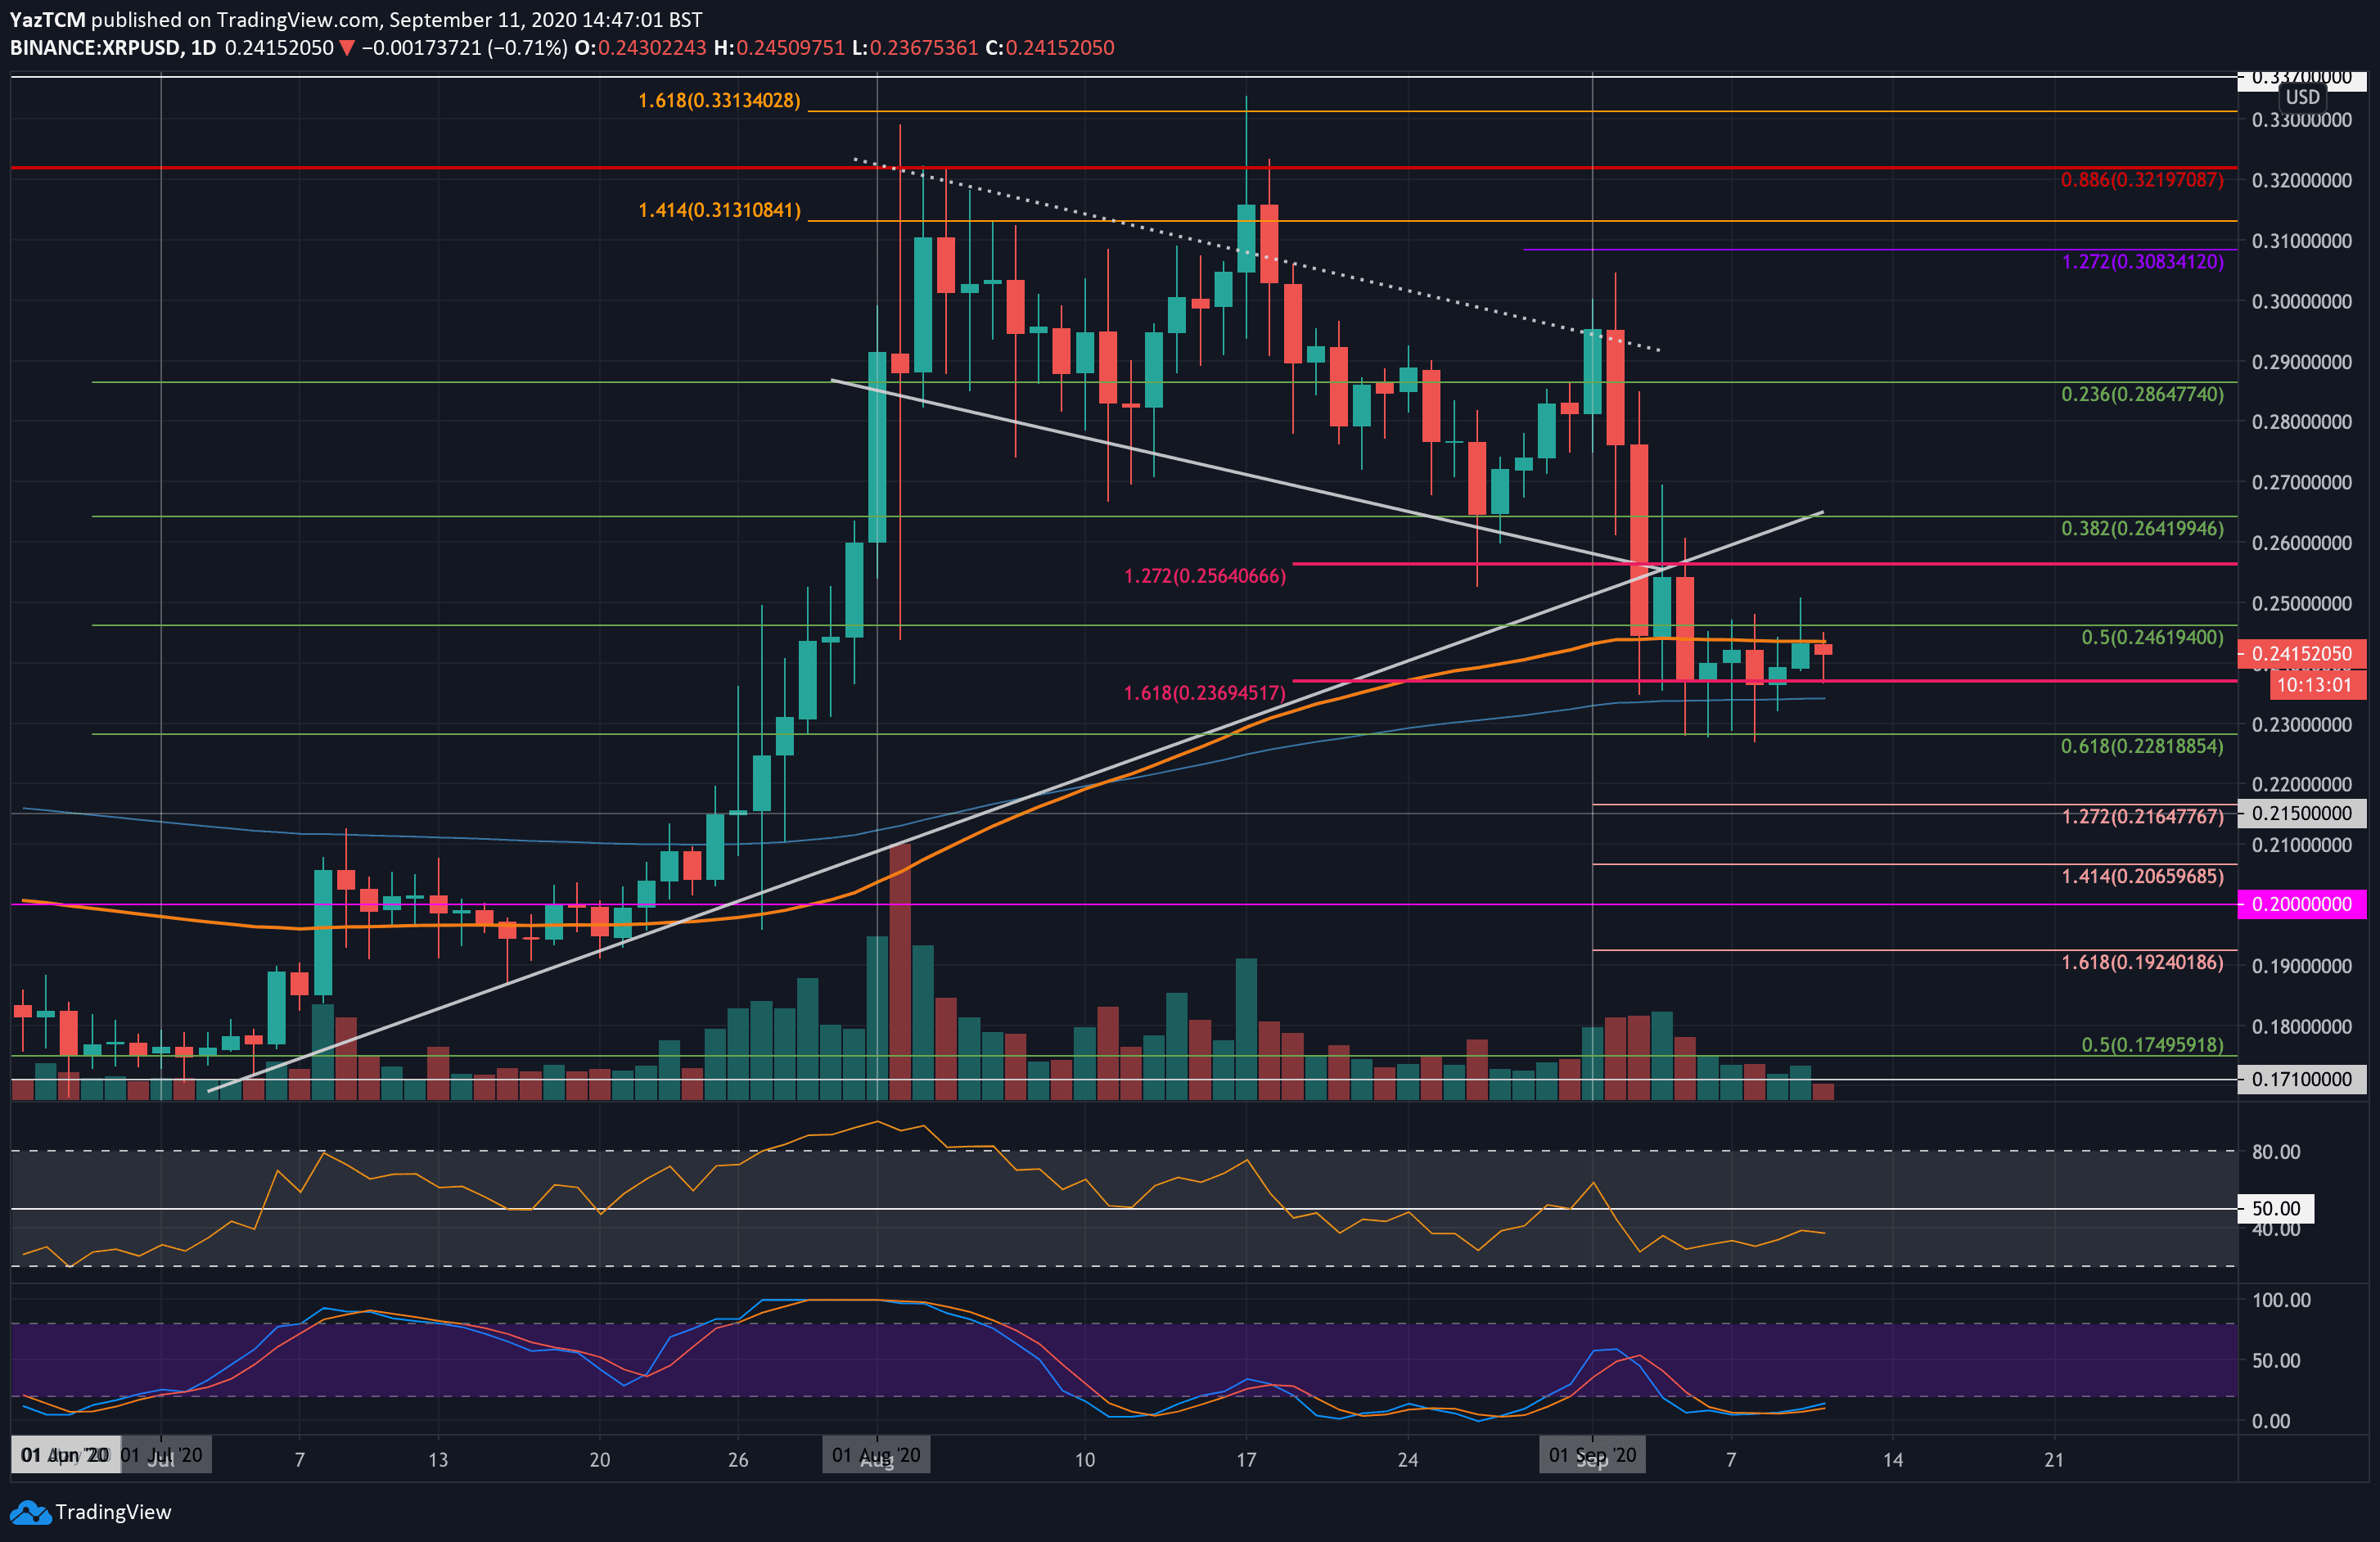
XRP also moved sideways this week as it starts to consolidate in a range between $0.236 and $0.245. The coin dropped from $0.3 last week to crash into the support at $0.236 (downside 1.618 FIb Extension). Although XRP did spike beneath this level to hit $0.228 (.618 Fib Retracement), the buyers always managed to push it back above $0.236 to close each daily candle.
Taking a closer look, the 100-days EMA around $0.243 seems to be providing substantial resistance for the buyers in the short term.
Looking ahead, if the bulls can break the 100-days EMA and climb above $0.246, resistance is expected at $0.256, $0.264, and $0.27.
On the other side, the first level of support lies at $0.236 (downside 1.618 Fib Extension). Added support lies at $0.228 (.618 Fib retracement), $0.22, and $0.216 (downside 1.272 Fib Extension).
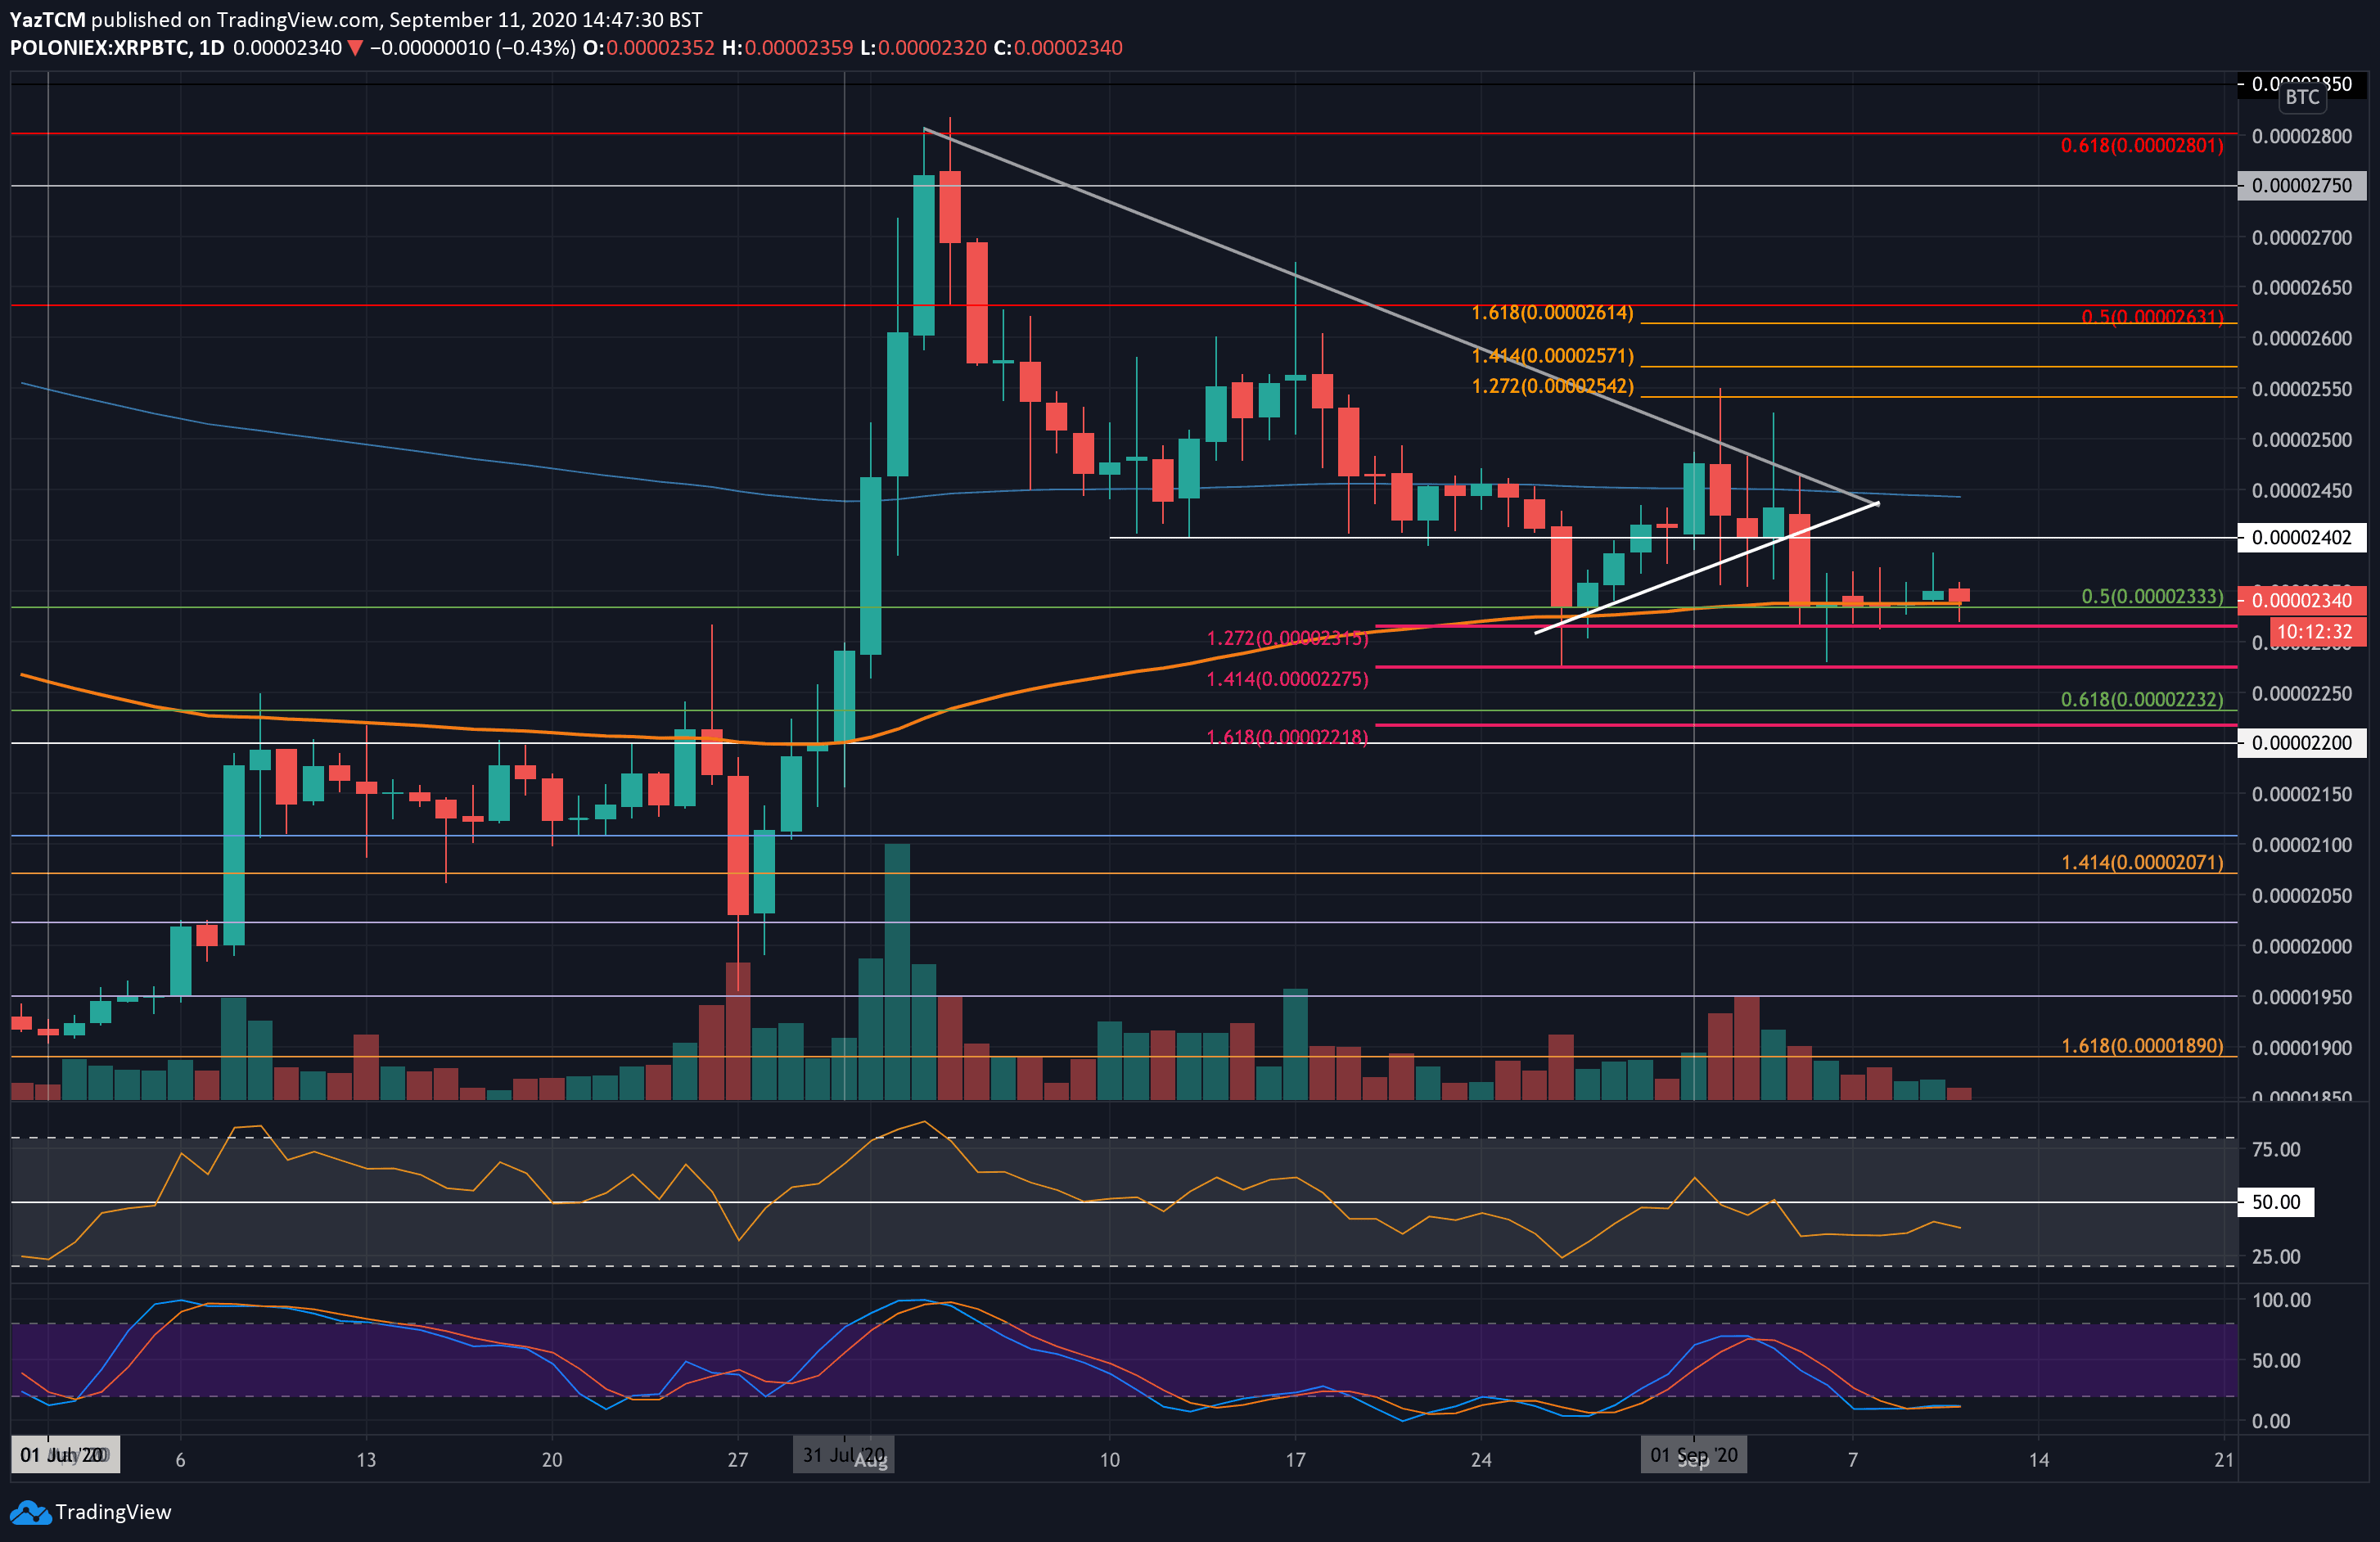
Against Bitcoin, XRP also moved sideways this week as the buyers defended the .5 Fib Retracement at around 2333 SAT. The 100-days EMA further bolsters this support in the same location.
Moving forward, if the bulls can rebound from this support, resistance lies at 2400 SAT, 2450 SAT (200-days EMA), and 2500 SAT.
On the other side, if the sellers push beneath 2333 SAT, support lies at 2275 SAT (downside 1.414 Fib Extension), 2230 SAT (.618 Fib Retracement), and 22000 SAT.
Cardano
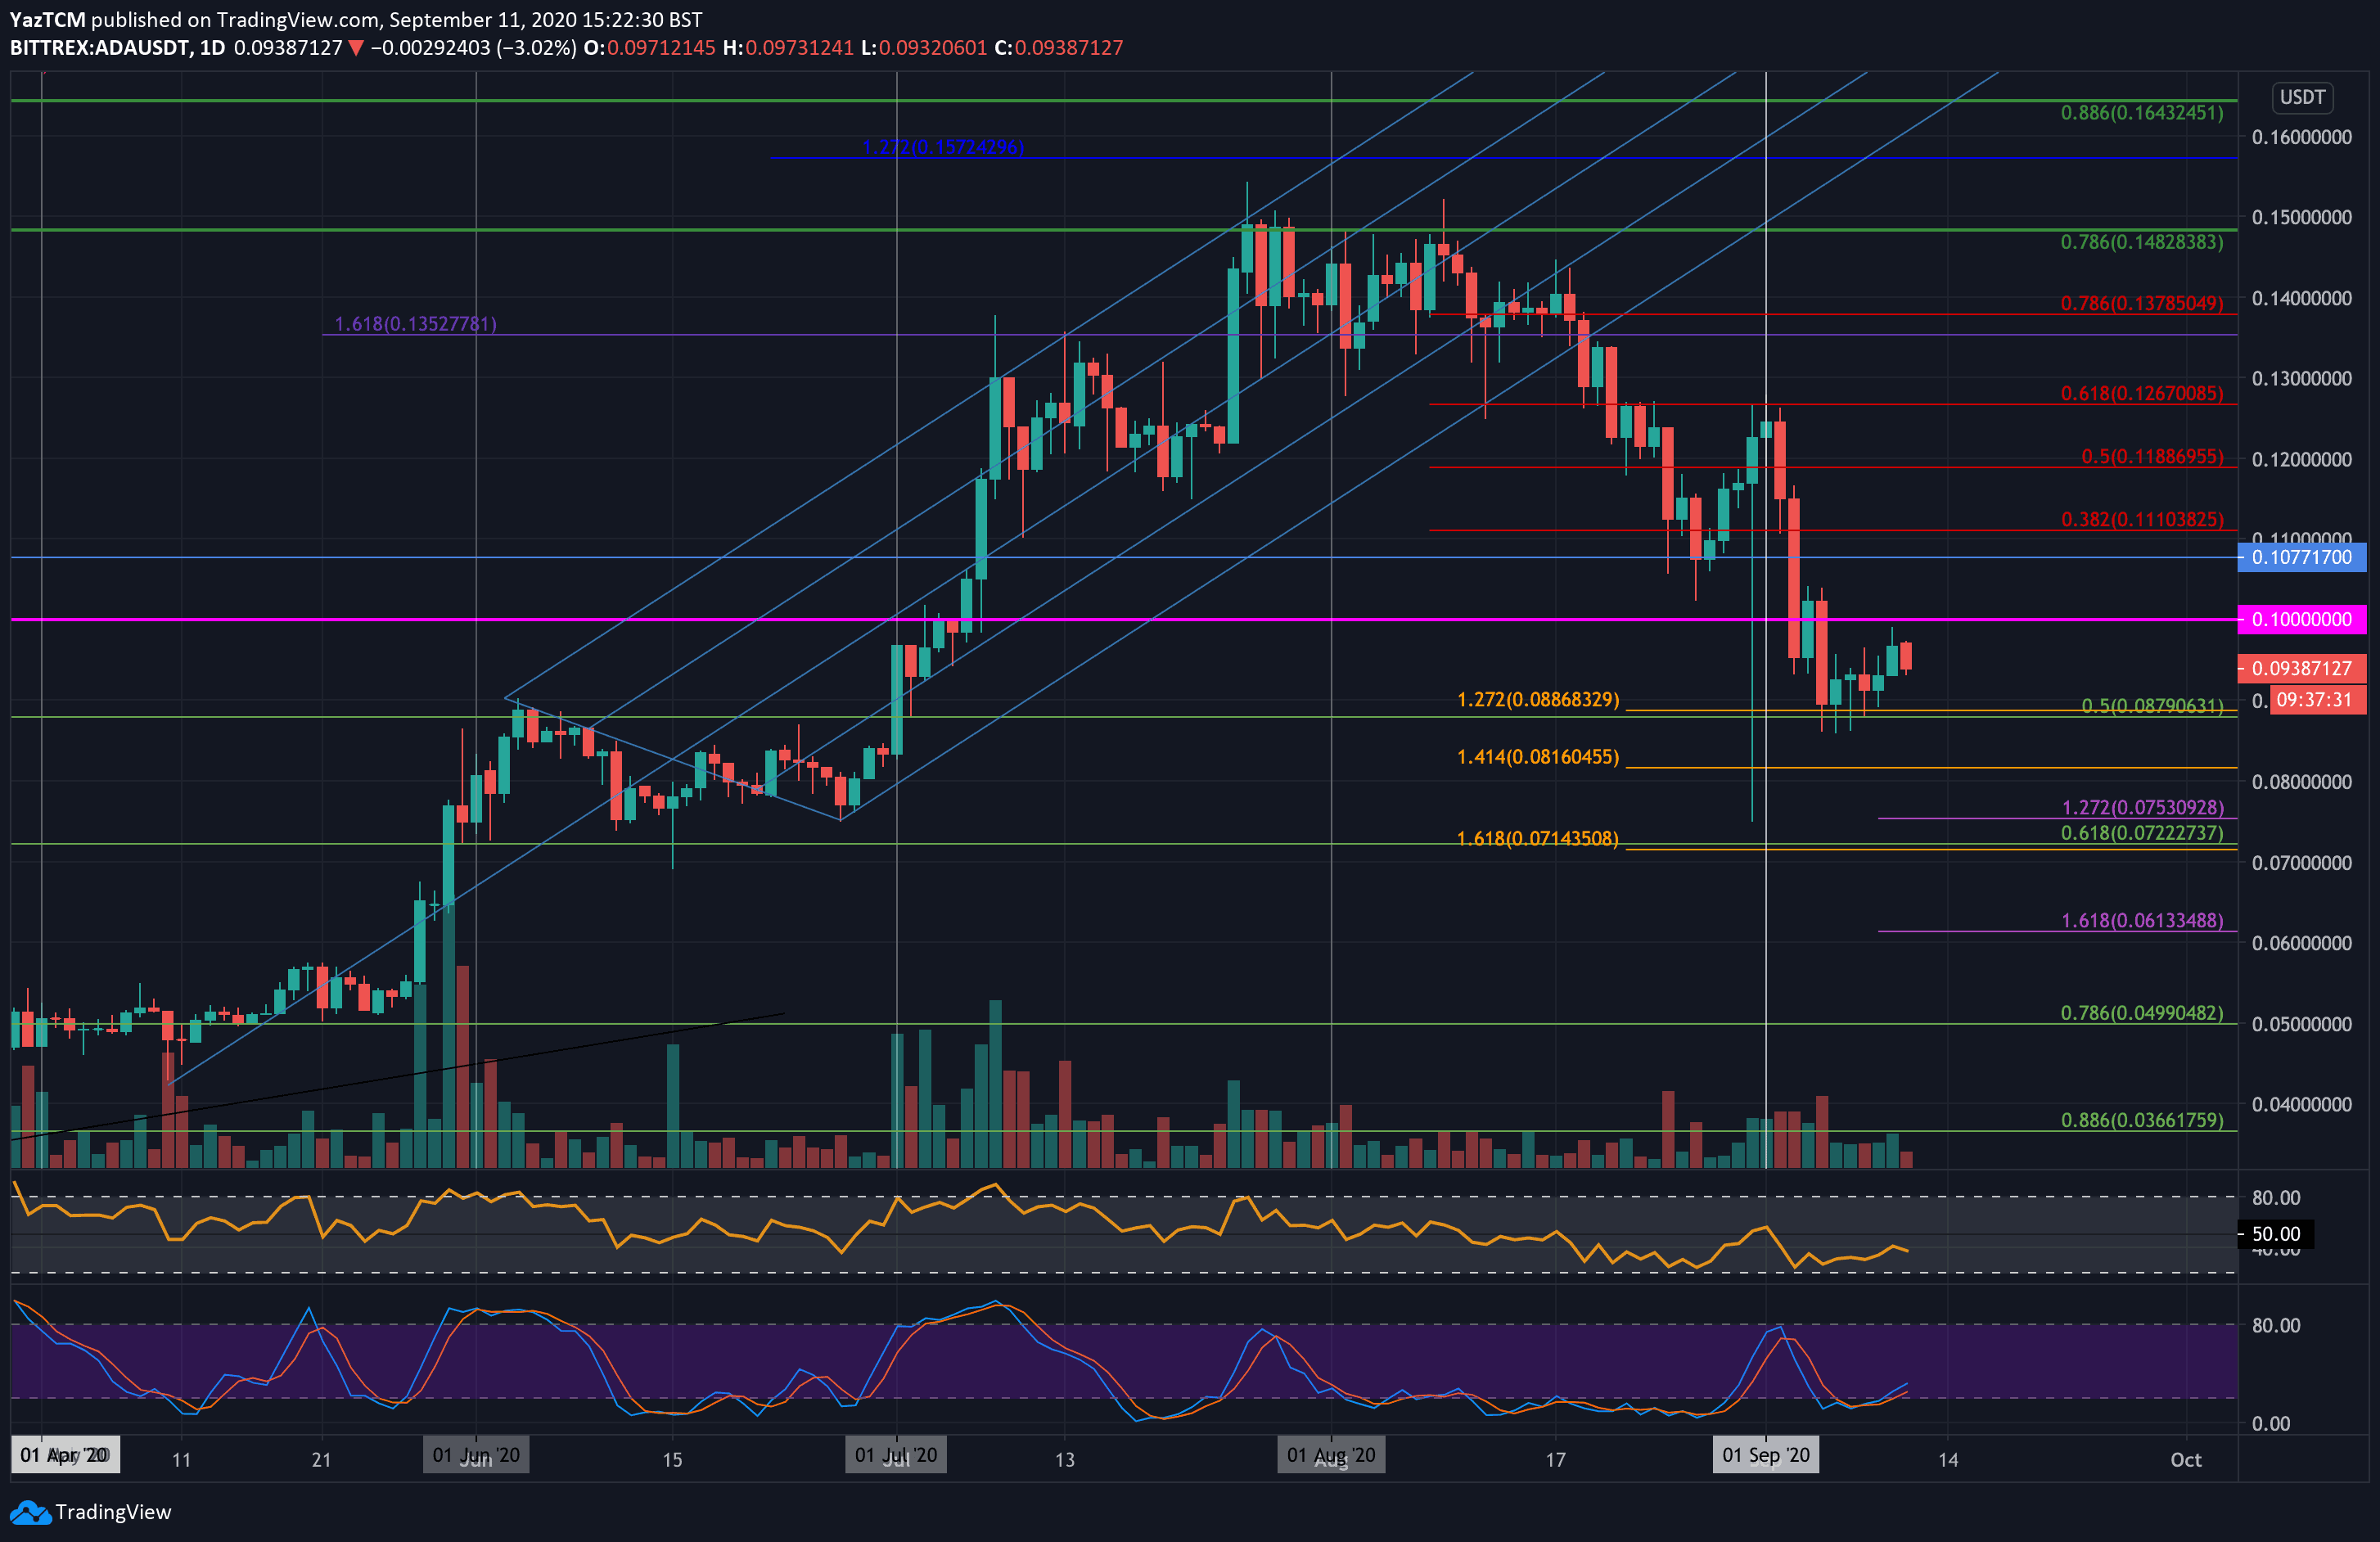
ADA also saw a sharp 6% price drop over the past week as it trades around $0.093. Like every altcoin, Cardano was brought down in September by the Bitcoin price drop. It managed to find support at the .5 Fib Retracement level at around $0.087 and started to rebound higher.
Looking ahead, the first level of resistance to overcome lies at $0.1. This is followed by resistance at $0.11 (bearish .382 Fib Retracement), $0.118 (bearish .5 Fib), and $0.126 (bearish .618 Fib).
On the other side, the first level of support lies at $0.087 (.5 Fib). Beneath this, support is located at $0.0816 (downside 1.414 Fib Extension), $0.075, and $0.072 (.618 Fib Retracement).
Cardano has been in a steady decline against Bitcoin since it reached a high of 1600 SAT in July 2020. The coin dropped in August to contact the support at 940 SAT and fell further in September until it met the 880 SAT level (.618 Fib Retracement).
If the sellers continue to drive ADA beneath 880 SAT, added support is found at 815 SAT (downside 1.272 Fib Extension), 760 SAT (downside 1.414 Fib Extension), and 685 SAT (.786 Fib Retracement).
On the other side, if the buyers can break back above 1000 SAT, resistance lies at 1136 SAT (bearish .382 FIb), 1225 SAT (bearish .5 Fib ), and 1310 SAT (bearish .618 Fib).

Chainlink
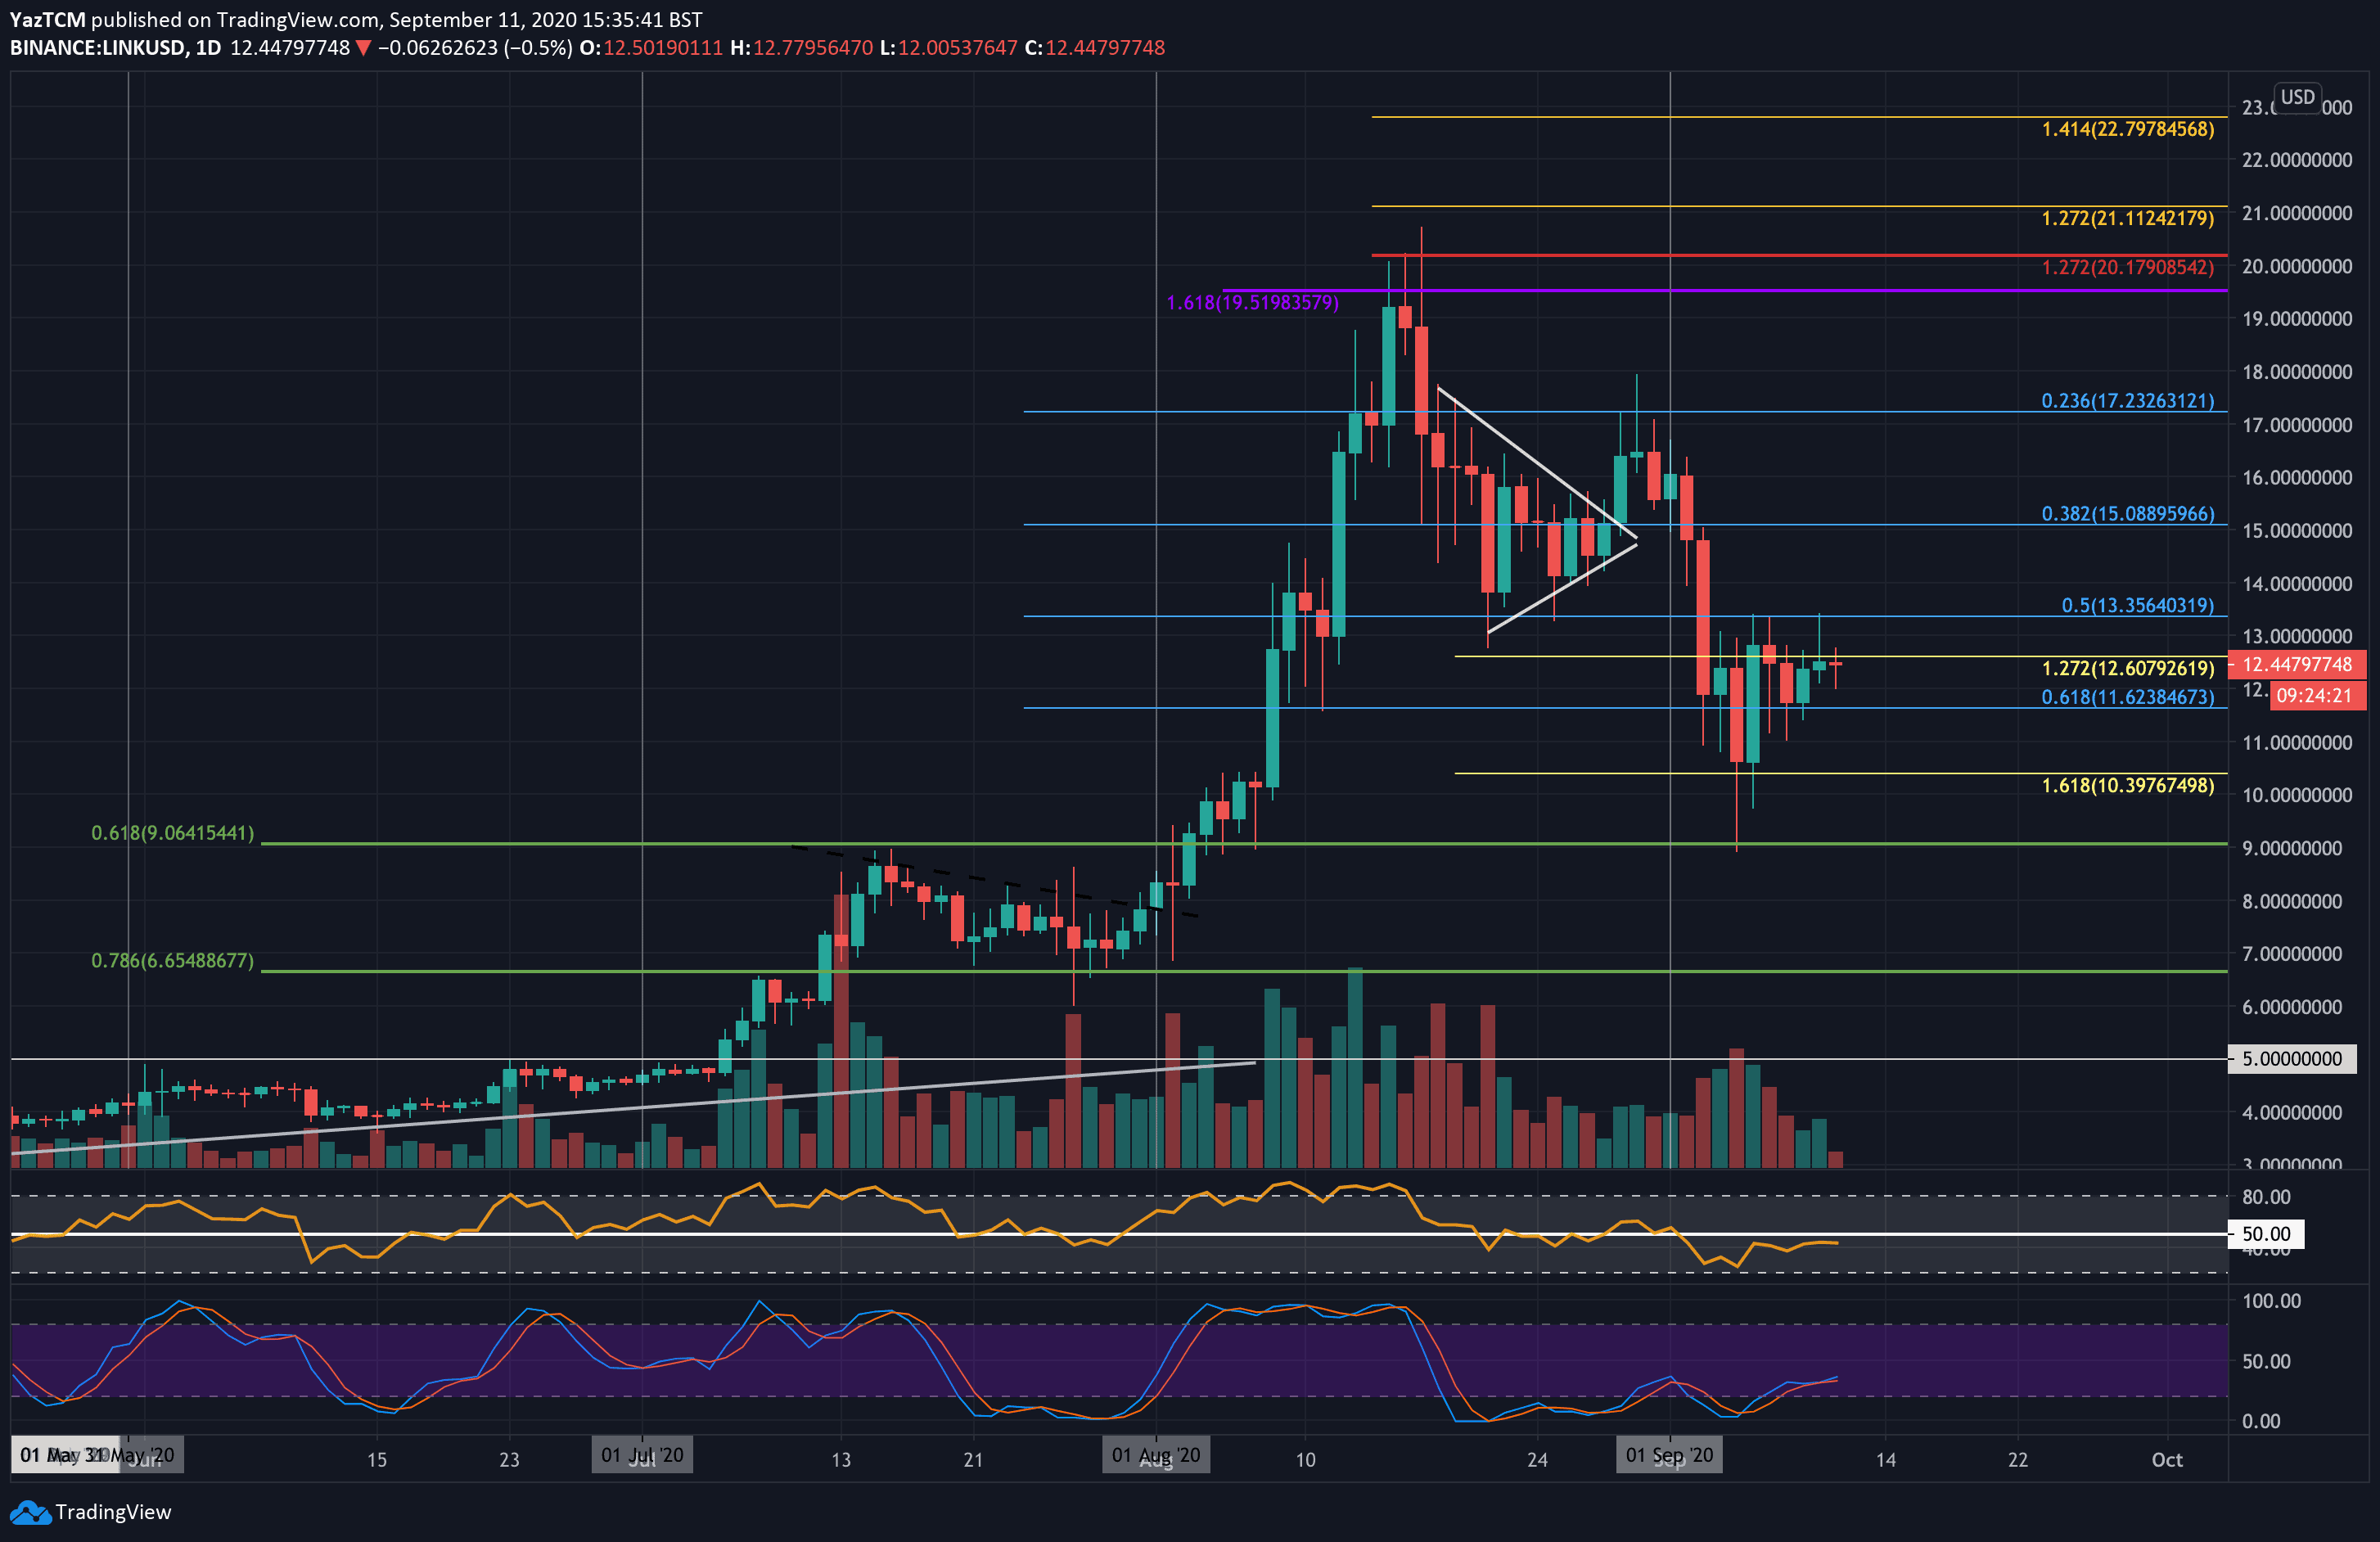
Chainlink saw a strong 40% rebound from the price low of $9.00 seen last week. The cryptocurrency managed to close the daily candle for that day above the support at $10.40 (downside 1.618 Fib Extension) and continued to climb from here.
The buyers struggle to break the resistance at $13.35 and must pass this to head back to the September highs.
Looking ahead, the first level of resistance lies at $12.60. This is followed by resistance at $13.35, $14, $14, and $17.25.
On the other side, support lies at $11.62 (.618 Fib Retracement), $10.40 (downside 1.618 Fib Extension), and $9.00
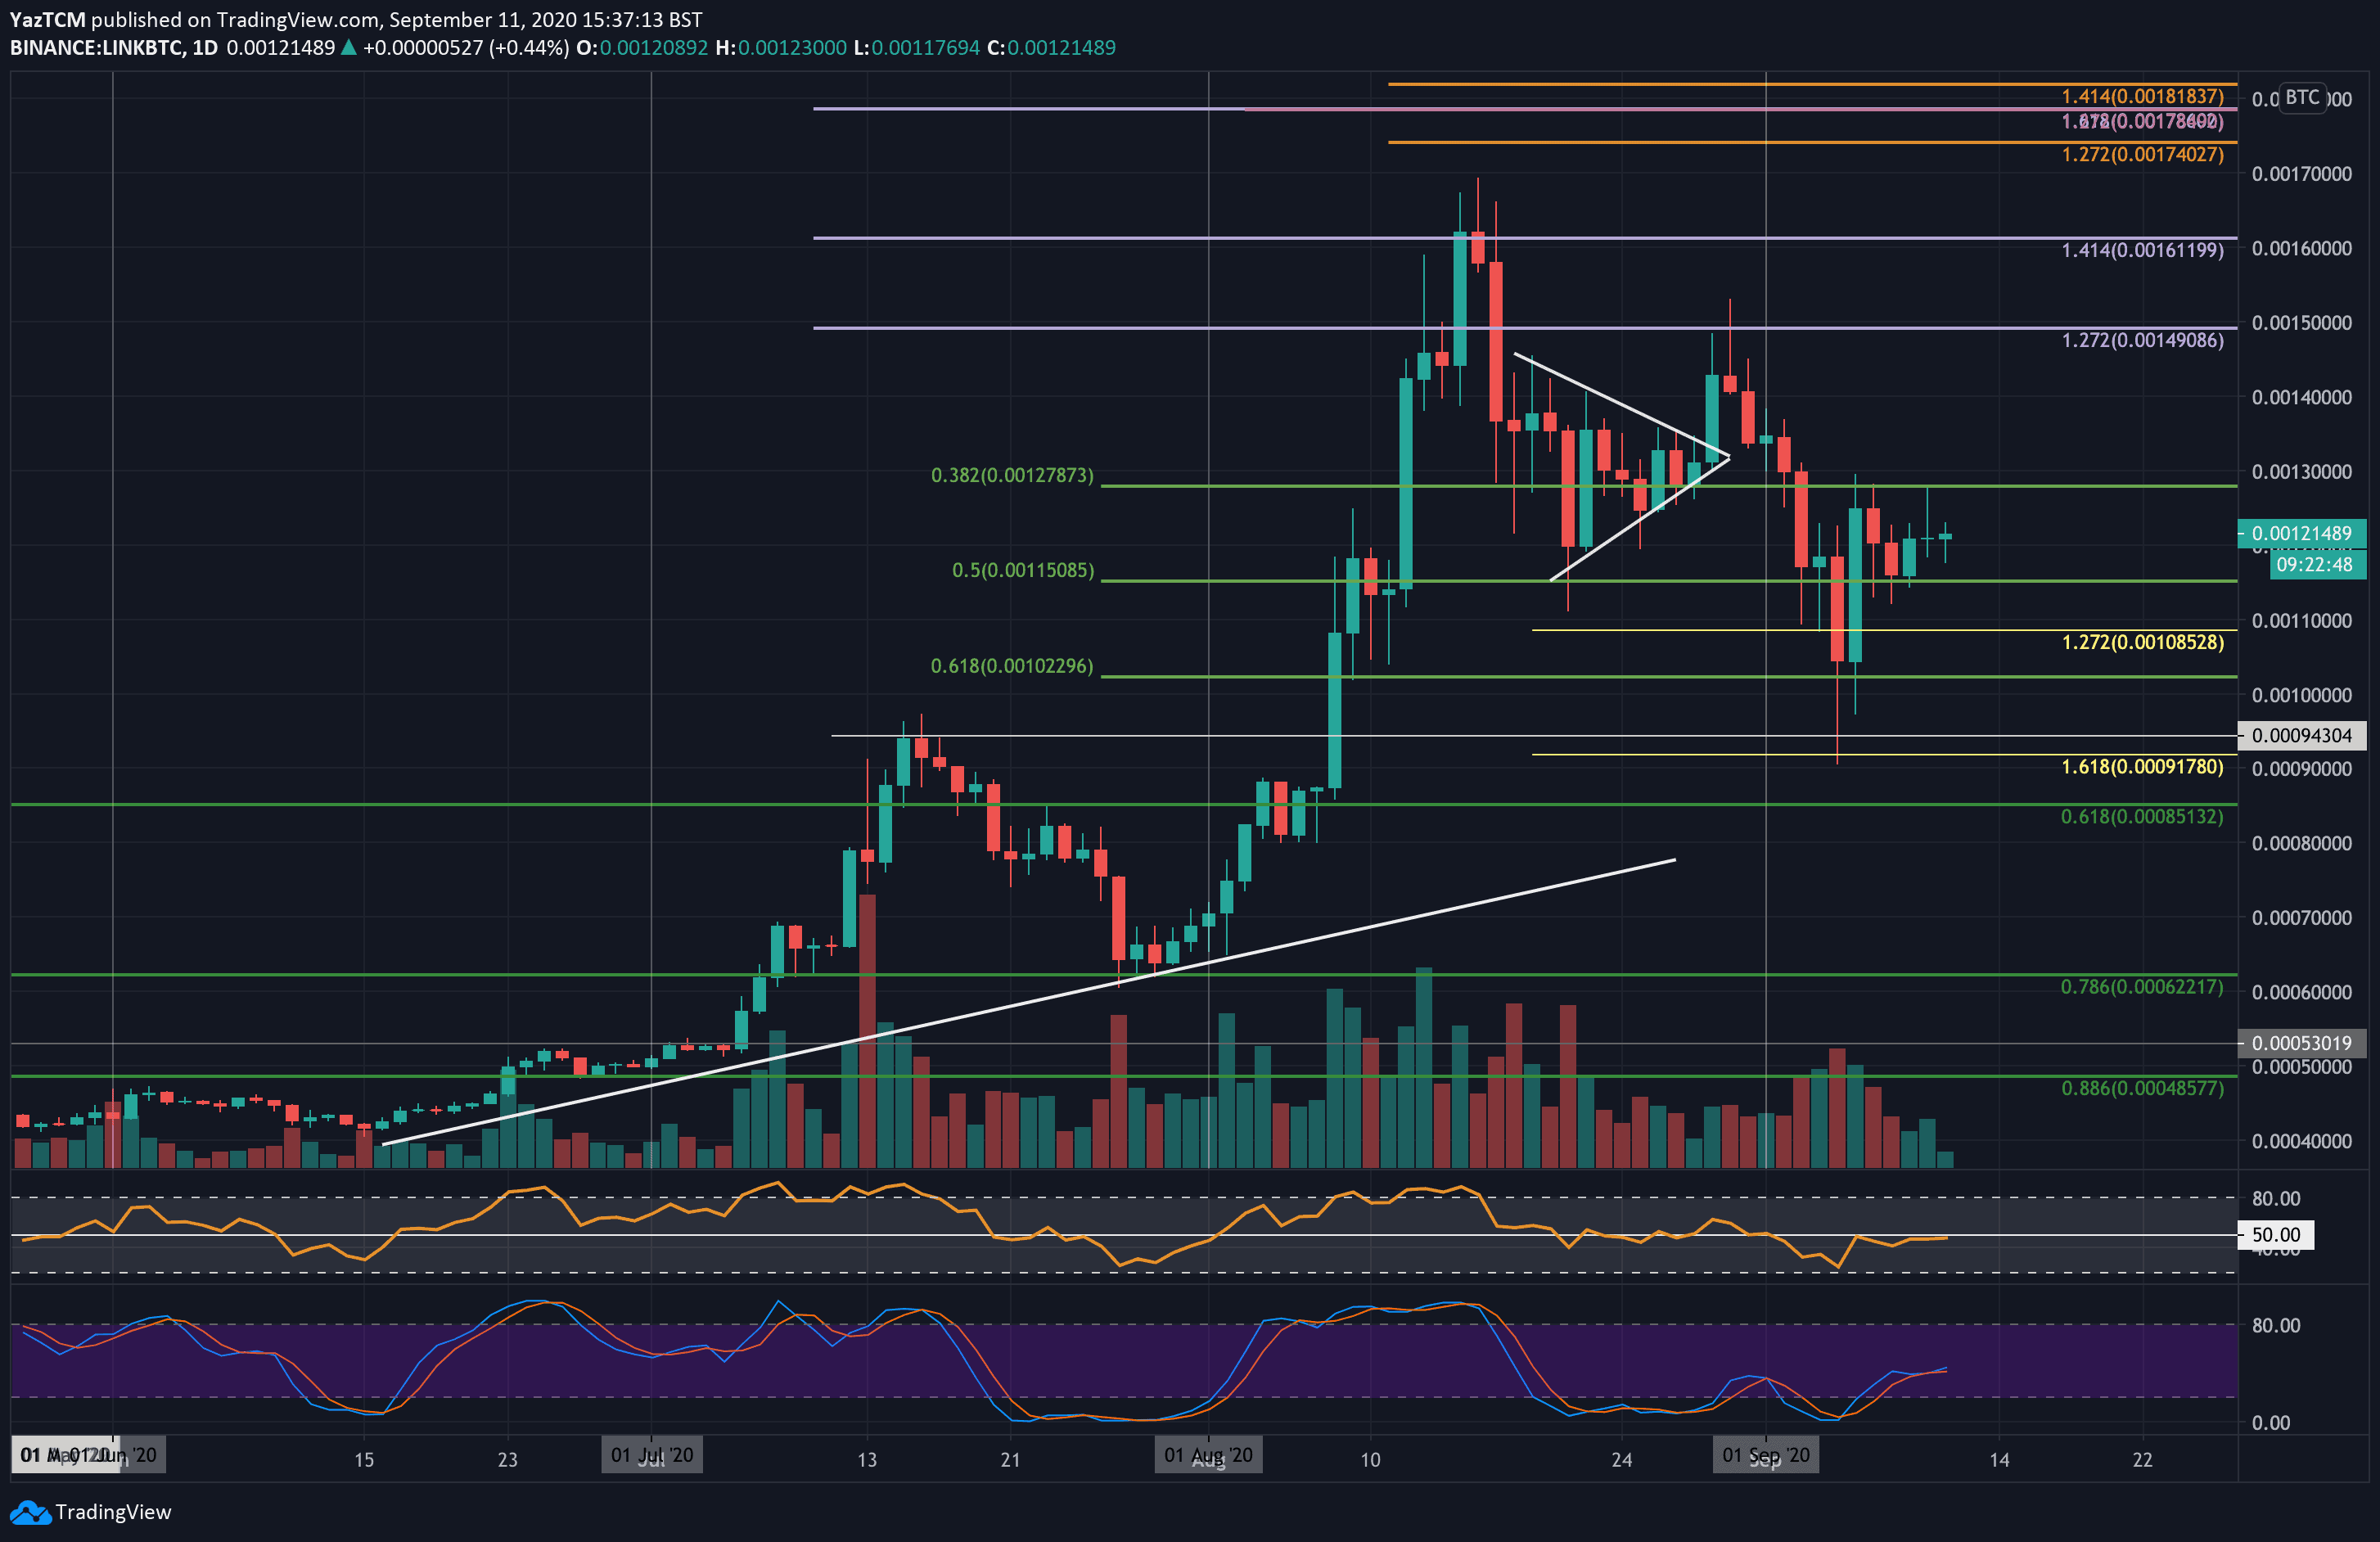
The situation is relatively similar with LINK against Bitcoin. It has increased by 35% since spiking as low as 0.00091 BTC last Friday. The coin is now trading at the 0.00121 BTC level as it faces resistance at 0.00127 BTC.
If the bulls break above 0.0013 BTC, resistance lies at 0.0014 BTC, 0.00149 BTC, and 0.00161 BTC.
On the other side, the first level of support is expected at 0.00115 BTC (.5 Fib Retracement). This is followed by support at 0.00108 BTC (downside 1.272 Fib Extension), 0.00102 BTC, and 0.000943 BTC.