DASH sees an epic 46% price surge over the past 24 hours, bringing the price for the coin up to 0.Against BTC, DASH has rocketed above 0.01 BTC and climbed much higher toward 0.013 BTC.DASH has now increased by a total of 183% over the past fortnight, allowing the cryptocurrency to rise into the 12th ranked position.Key Support & Resistance LevelsDASH/USDSupport: 3, 7, and 0.Resistance: 4, 0, and 7.DASH/BTC:Support: 0.0131 BTC, 0.0117 BTC, and 0.01 BTC.Resistance: 0.0143 BTC, 0.0171 BTC, and 0.020 BTC.DASH/USD: DASH Surges To Meet Long Term .618 Fib Retracement?The daily chart above shows DASH rising above the 200-days EMA and surging by a total of 80% over the past 2 days of trading. The cryptocurrency managed to rise as high as 9 before rolling over and falling.
Topics:
Yaz Sheikh considers the following as important: Price Analysis
This could be interesting, too:
CryptoVizArt writes ETH’s Path to K Involves Maintaining This Critical Support (Ethereum Price Analysis)
Duo Nine writes Crypto Price Analysis June-29: ETH, XRP, ADA, DOGE, and DOT
Duo Nine writes Crypto Price Analysis June-15: ETH, XRP, ADA, DOGE, and DOT
Duo Nine writes Why is the Shiba Inu (SHIB) Price Down Today?
- DASH sees an epic 46% price surge over the past 24 hours, bringing the price for the coin up to $120.
- Against BTC, DASH has rocketed above 0.01 BTC and climbed much higher toward 0.013 BTC.
- DASH has now increased by a total of 183% over the past fortnight, allowing the cryptocurrency to rise into the 12th ranked position.
Key Support & Resistance Levels
DASH/USD
Support: $113, $107, and $100.
Resistance: $124, $140, and $147.
DASH/BTC:
Support: 0.0131 BTC, 0.0117 BTC, and 0.01 BTC.
Resistance: 0.0143 BTC, 0.0171 BTC, and 0.020 BTC.
DASH/USD: DASH Surges To Meet Long Term .618 Fib Retracement?
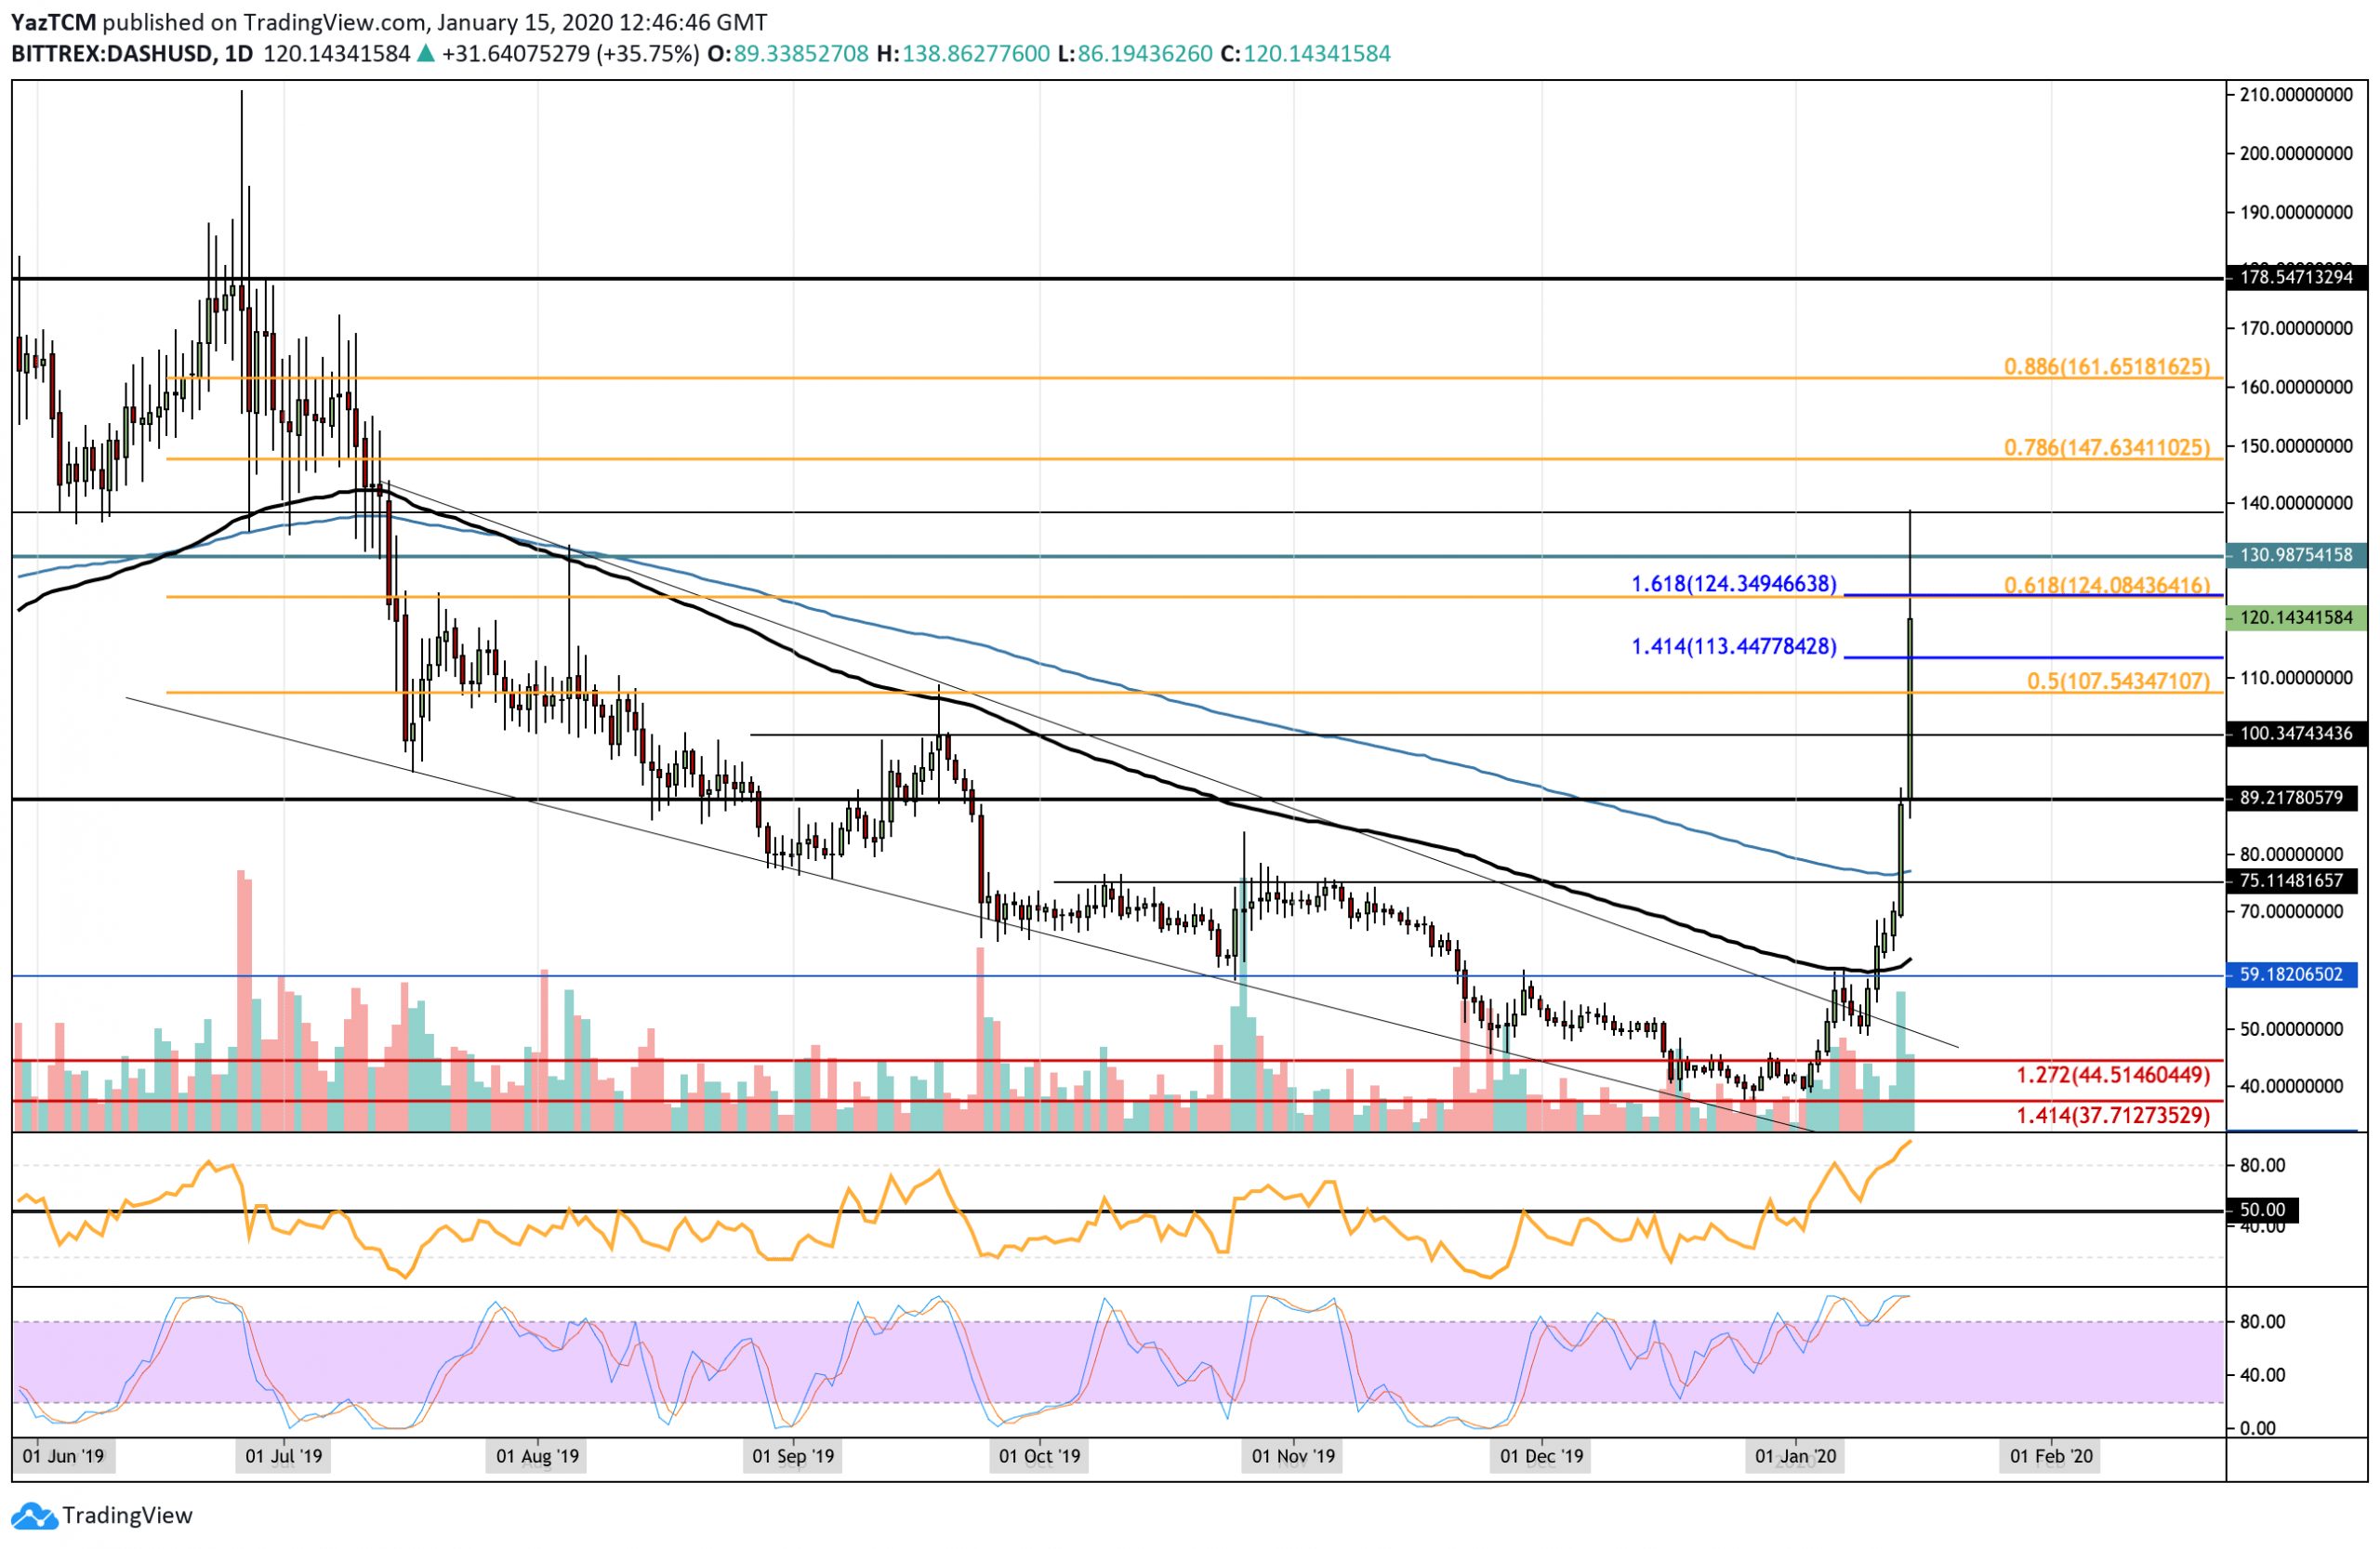
The daily chart above shows DASH rising above the 200-days EMA and surging by a total of 80% over the past 2 days of trading. The cryptocurrency managed to rise as high as $139 before rolling over and falling. More specifically, DASH is struggling to pass the resistance at $124 provided by the long term bearish .618 Fibonacci Retracement level.
DASH is most certainly in a bullish trend now, especially after the break above the 200-days EMA. If DASH was to drop back beneath $100 it would turn neutral with a further drop beneath $75 confirming another bearish trend.
DASH Short Term Price Prediction
If the buyers continue to push DASH above $124, immediate higher resistance is located at $130 and $140. Above this, additional resistance is found at $147 (bearish .786 Fibonacci Retracement) and $161 (bearish .886 Fibonacci Retracement). On the other hand, if the sellers push DASH lower, immediate support is found at $113, $110, and $107. Beneath this, additional support is found at $100 and $89.
The RSI has reached an extreme overbought condition, not seen since April 2019, which could suggest that the bulls are overstretched. However, it is well known that the RSI can remain overbought for extended periods of time when the market turns parabolic.
DASH/BTC: DASH Rises Above 200-days EMA To Meet Resistance at .382 Fib Retracement
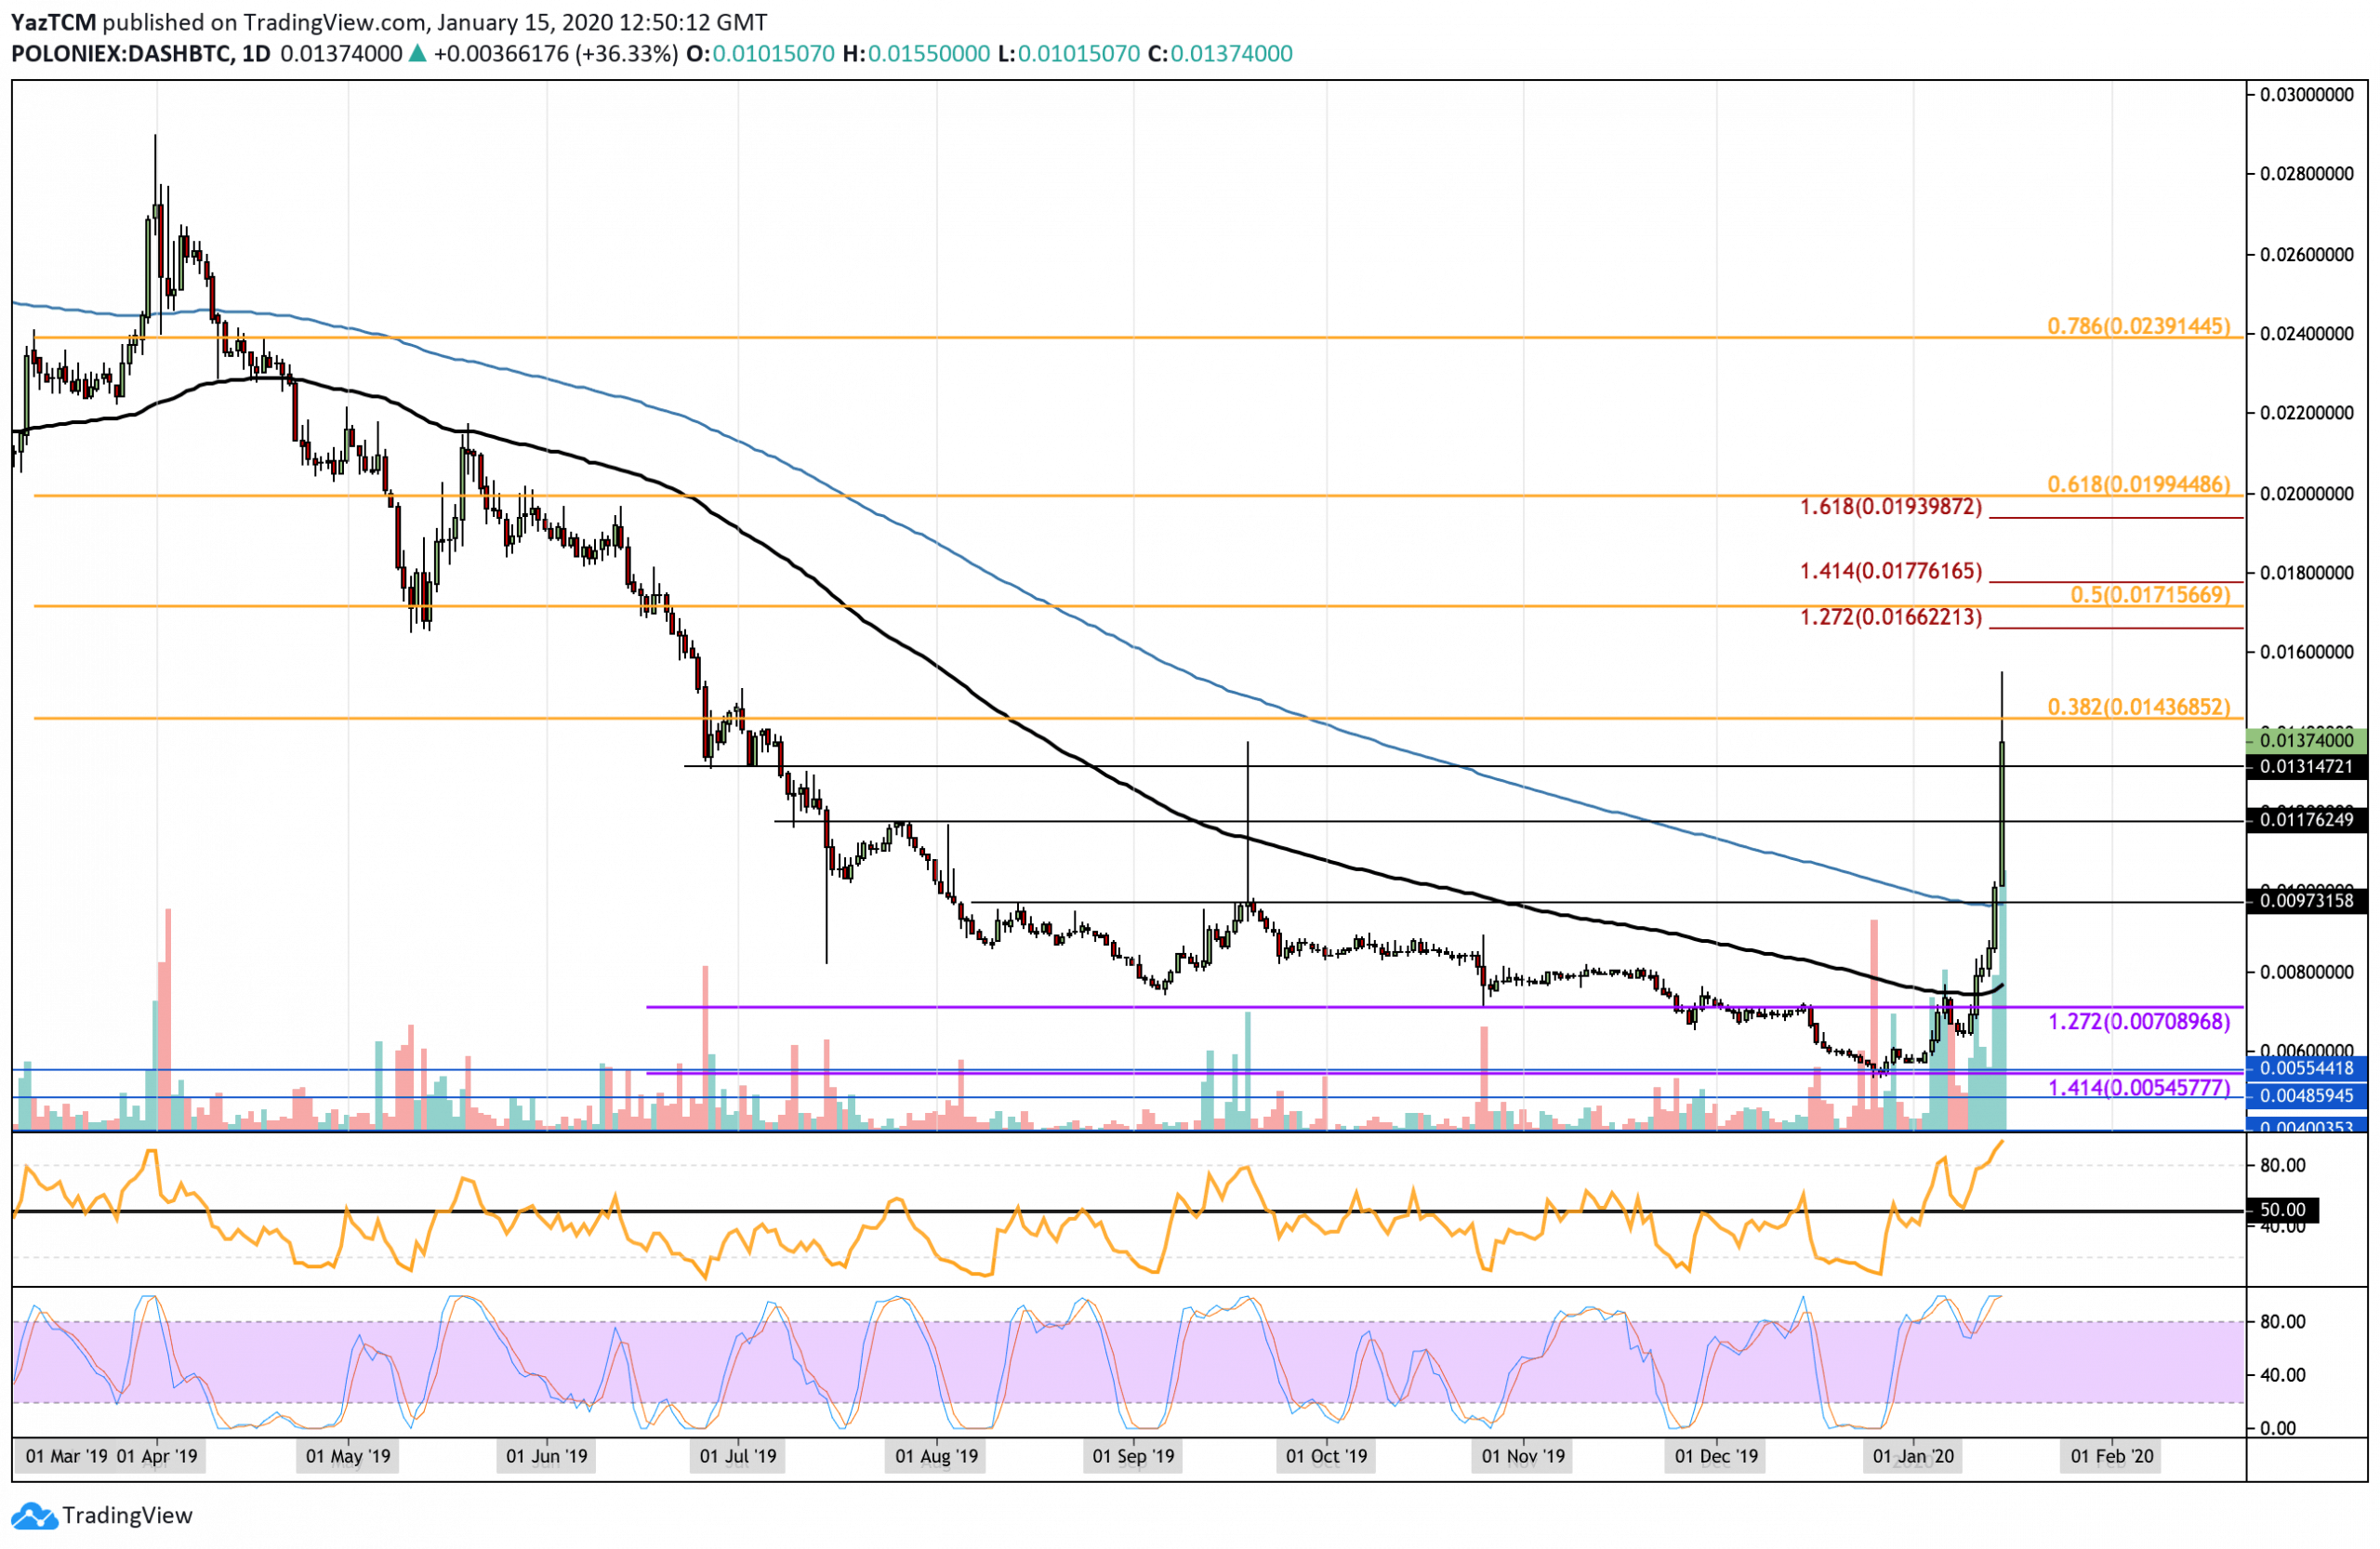
Against Bitcoin, DASH increased by a total of 60% over the past 2 days of trading which allowed it to rise above the 200-days EMA at 0.01 BTC and climb higher toward the current level of 0.0136 BTC. The cryptocurrency met resistance at the 0.0143 BTC which is provided by the bearish .382 Fib Retracement, causing it to pull back slightly.
Likewise, DASH is in a bullish trend against BTC. It would need to fall beneath 0.01 BTC to turn neutral with a drop beneath 0.008 BTC turning the market bearish.
DASH Short Term Price Prediction
If the bulls manage to push DASH above 0.014 BTC, initial higher resistance lies at 0.015 BTC and 0.0166 BTC. Above this, resistance lies at 0.0171 BTC (bearish .5 Fibonacci Retracement), 0.0177 BTC, and 0.020 BTC (bearish .618 Fibonacci Retracement). Alternatively, if the sellers regroup and push DASH lower, support can be expected at 0.0131 BTC and 0.0117 BTC. Beneath this, additional support is found at 0.01 BTC (200-days EMA) and 0.008 BTC.
The RSI is also in overbought conditions which shows that the market may be overextended. Furthermore, the Stochastic RSI is primed for a bearish crossover signal that would send the market lower.