Ethereum dropped by a small 1% over the past 24 hours as it fell to 2.The cryptocurrency is still trading above a rising trend line that has been in play since mid-March 2020.Against Bitcoin, Ethereum found support at 0.0243 BTC as it looks to tackle 0.025 BTC again.Key Support & Resistance LevelsETH/USD:Support: 5, 5, 0.Resistance: 5, 0, 5.ETH/BTC:Support: 0.0243 BTC, 0.0239 BTC, 0.0235 BTC.Resistance: 0.025 BTC, 0.0253 BTC, 0.026 BTC.ETH/USD: Ethereum Bullish Momentum Fading SlightlyEthereum remains above the rising trend line, which is a very good sign. However, the bullish momentum does seem to be fading slightly as the RSI dips beneath the 50 line. This rising support trend line will be crucial to remain above to keep the ETH bull run intact.The buyers must push
Topics:
Yaz Sheikh considers the following as important: ETH Analysis, ETHBTC, Ethereum (ETH) Price, ethusd
This could be interesting, too:
Mandy Williams writes Ethereum Derivatives Metrics Signal Modest Downside Tail Risk Ahead: Nansen
Jordan Lyanchev writes Weekly Bitcoin, Ethereum ETF Recap: Light at the End of the Tunnel for BTC
CryptoVizArt writes Will Weak Momentum Drive ETH to .5K? (Ethereum Price Analysis)
Jordan Lyanchev writes Bybit Hack Fallout: Arthur Hayes, Samson Mow Push for Ethereum Rollback
- Ethereum dropped by a small 1% over the past 24 hours as it fell to $232.
- The cryptocurrency is still trading above a rising trend line that has been in play since mid-March 2020.
- Against Bitcoin, Ethereum found support at 0.0243 BTC as it looks to tackle 0.025 BTC again.
Key Support & Resistance Levels
ETH/USD:
Support: $225, $215, $210.
Resistance: $245, $250, $265.
ETH/BTC:
Support: 0.0243 BTC, 0.0239 BTC, 0.0235 BTC.
Resistance: 0.025 BTC, 0.0253 BTC, 0.026 BTC.
ETH/USD: Ethereum Bullish Momentum Fading Slightly
Ethereum remains above the rising trend line, which is a very good sign. However, the bullish momentum does seem to be fading slightly as the RSI dips beneath the 50 line. This rising support trend line will be crucial to remain above to keep the ETH bull run intact.
The buyers must push higher and break the $250 level to keep the bullish run alive and kicking.
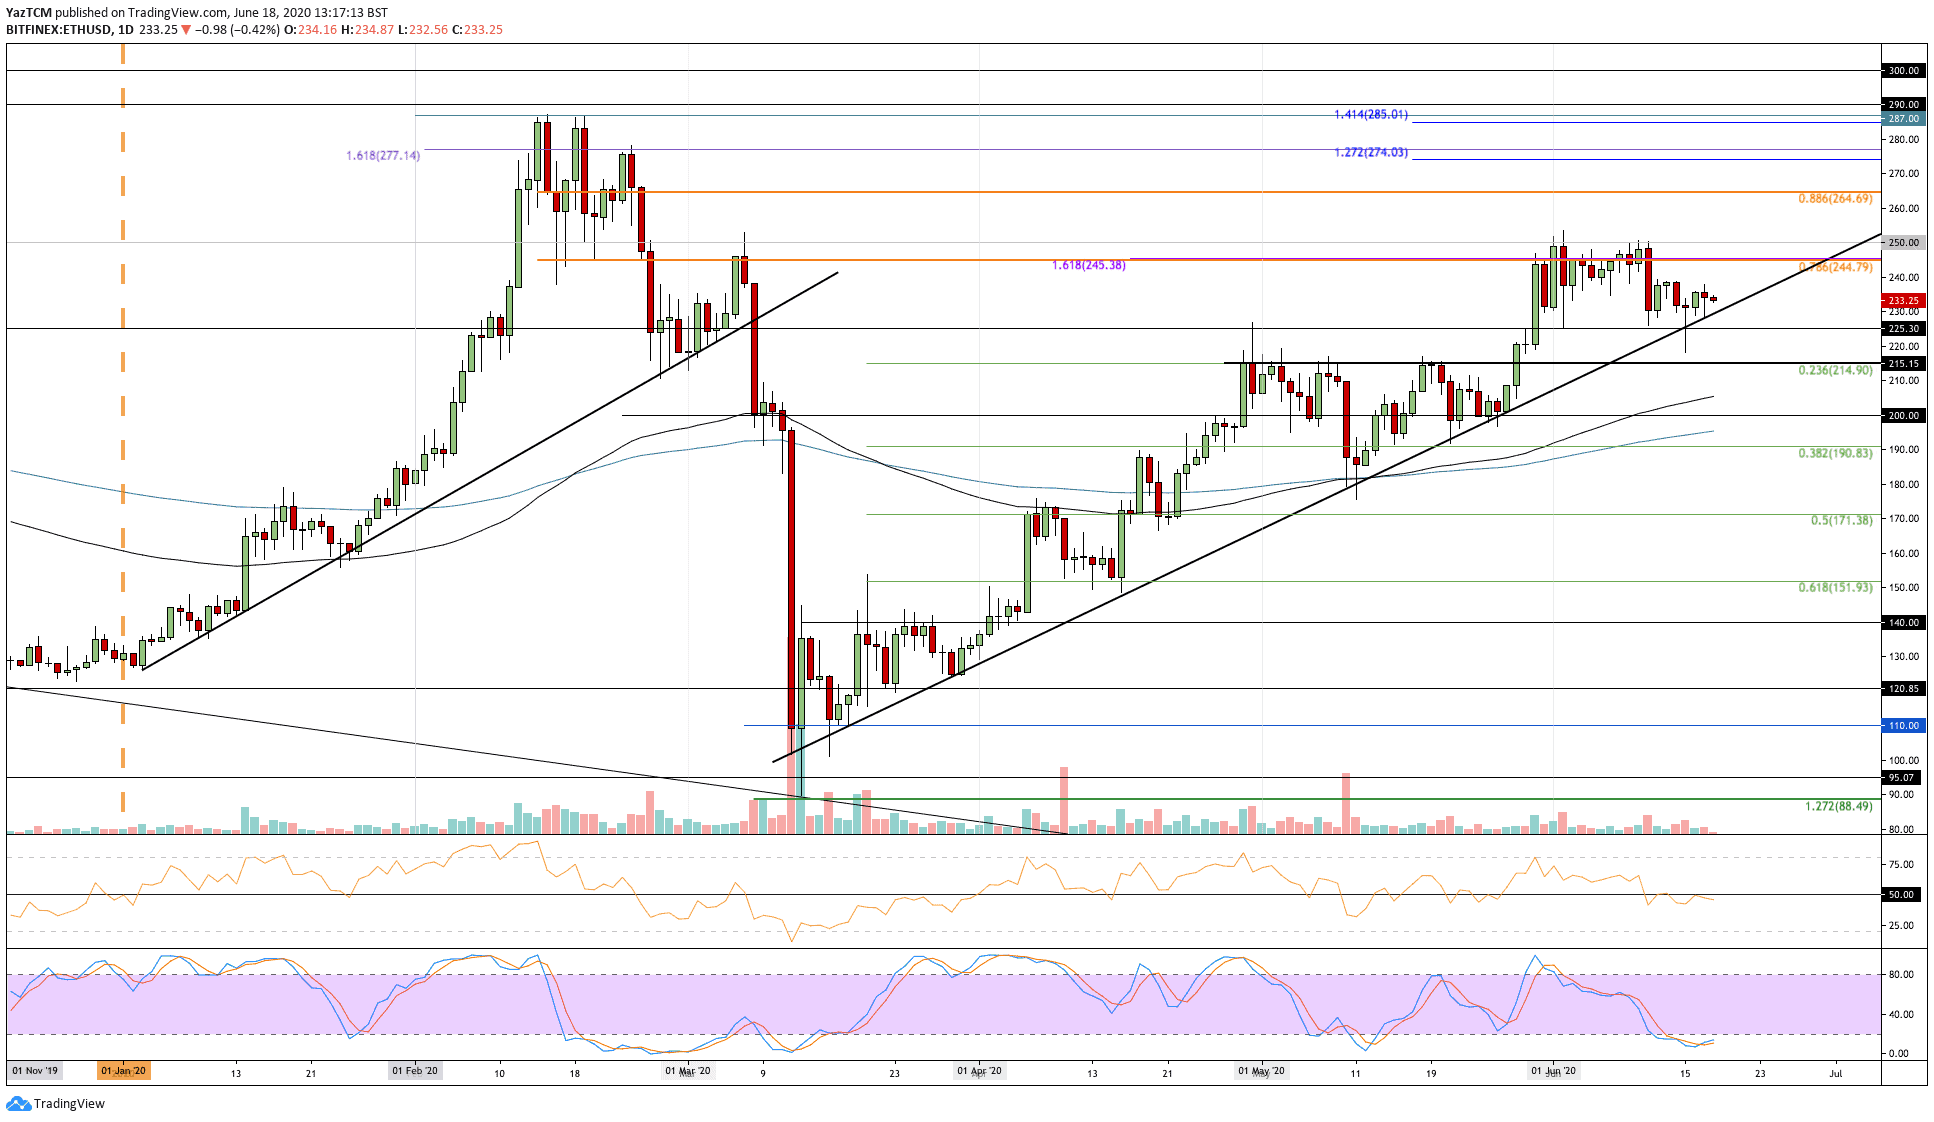
ETH-USD Short Term Price Prediction
Looking ahead, if the sellers break beneath the rising support line, the first level of support lies at $225. Beneath this, support is found at $215 (.236 Fib Retracement), $210 (100-day EMA), and $200.
Alternatively, if the buyers push higher, the first level of resistance lies at $245. Above this, resistance is found at $250, $265 (bearish .886 Fib Retracement), and $275.
As mentioned, the RSI has dropped beneath the 50 line to indicate increasing bearish momentum within the market. For a push toward $250, the RSI has to break back above 50.
Additionally, the Stochastic RSI is in oversold conditions and is primed for a bullish crossover signal.
ETH/BTC: ETH Bounces From 0.0243 BTC Support
Against Bitcoin, Ethereum was struggling to break above the 0.0253 BTC resistance at the start of June. This caused ETH to break back beneath 0.025 BTC over the past few days as it headed lower to reach the support at 0.0243 BTC (.236 Fib Retracement).
ETH recently bounced from 0.0243 BTC as it climbs to 0.0247 BTC and sets its sights toward 0.025 BTC.
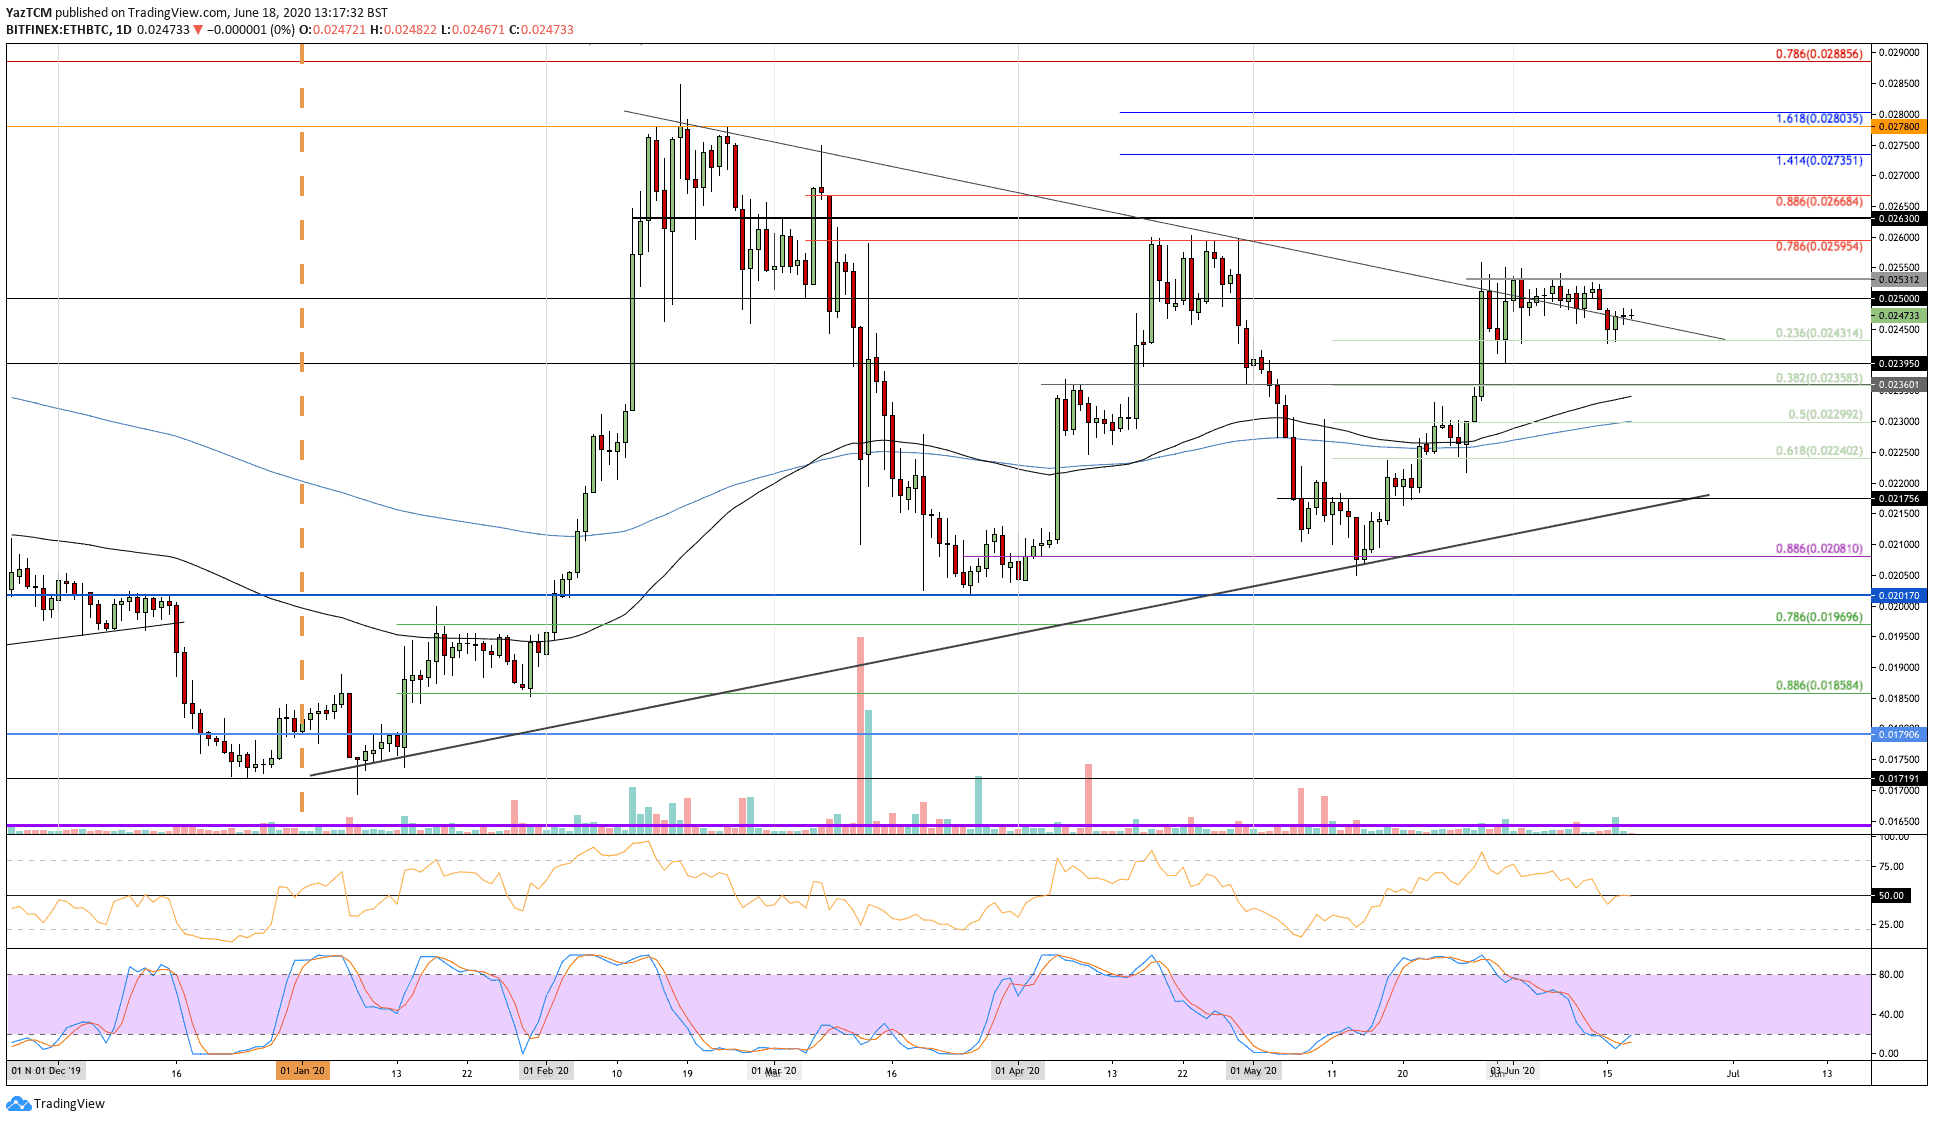
ETH-BTC Short Term Price Prediction
If the sellers push lower again, the first level of support lies at 0.0243 BTC (.236 Fib Retracement). Beneath this, support lies at 0.0239 BTC, 0.0235 BTC (.382 Fib Retracement), and 0.023 BTC.
On the other side, if the buyers push higher and break 0.025 BTC, resistance can be found at 0.0253 BTC and 0.026 BTC (bearish .786 Fib Retracement).
The RSI is trading directly along the 50 line to indicate indecision within the market. The Stochastic RSI is also in oversold conditions and is primed for a bullish crossover signal.