Ethereum saw a 1% price decline over the past 24 hours of trading as it drops to the 0 price area.The cryptocurrency was recently struggling at the 0 level.Against Bitcoin, Ethereum dropped into the 0.0236 BTC support earlier today.Key Support & Resistance LevelsETH/USD:Support: 1, 3, 0.Resistance: 0, 5, 5.ETH/BTC:Support: 0.0236 BTC, 0.023 BTC, 0.0226 BTCResistance: 0.024 BTC, 0.0247 BTC, 0.025 BTCETH/USD – Ethereum Struggling at 0Ethereum dropped by 1% today as it falls into the 1 support. It had made a brief attempt to push higher but was rejected by the resistance at 0 provided by a 1.272 Fibonacci Extension level.The cryptocurrency is still on top of a bullish short term ascending trend-line; however, it must break the resistance at 0 and 5 for
Topics:
Yaz Sheikh considers the following as important: ETH Analysis, ETHBTC, Ethereum (ETH) Price, ethusd
This could be interesting, too:
Mandy Williams writes Ethereum Derivatives Metrics Signal Modest Downside Tail Risk Ahead: Nansen
Jordan Lyanchev writes Weekly Bitcoin, Ethereum ETF Recap: Light at the End of the Tunnel for BTC
CryptoVizArt writes Will Weak Momentum Drive ETH to .5K? (Ethereum Price Analysis)
Jordan Lyanchev writes Bybit Hack Fallout: Arthur Hayes, Samson Mow Push for Ethereum Rollback
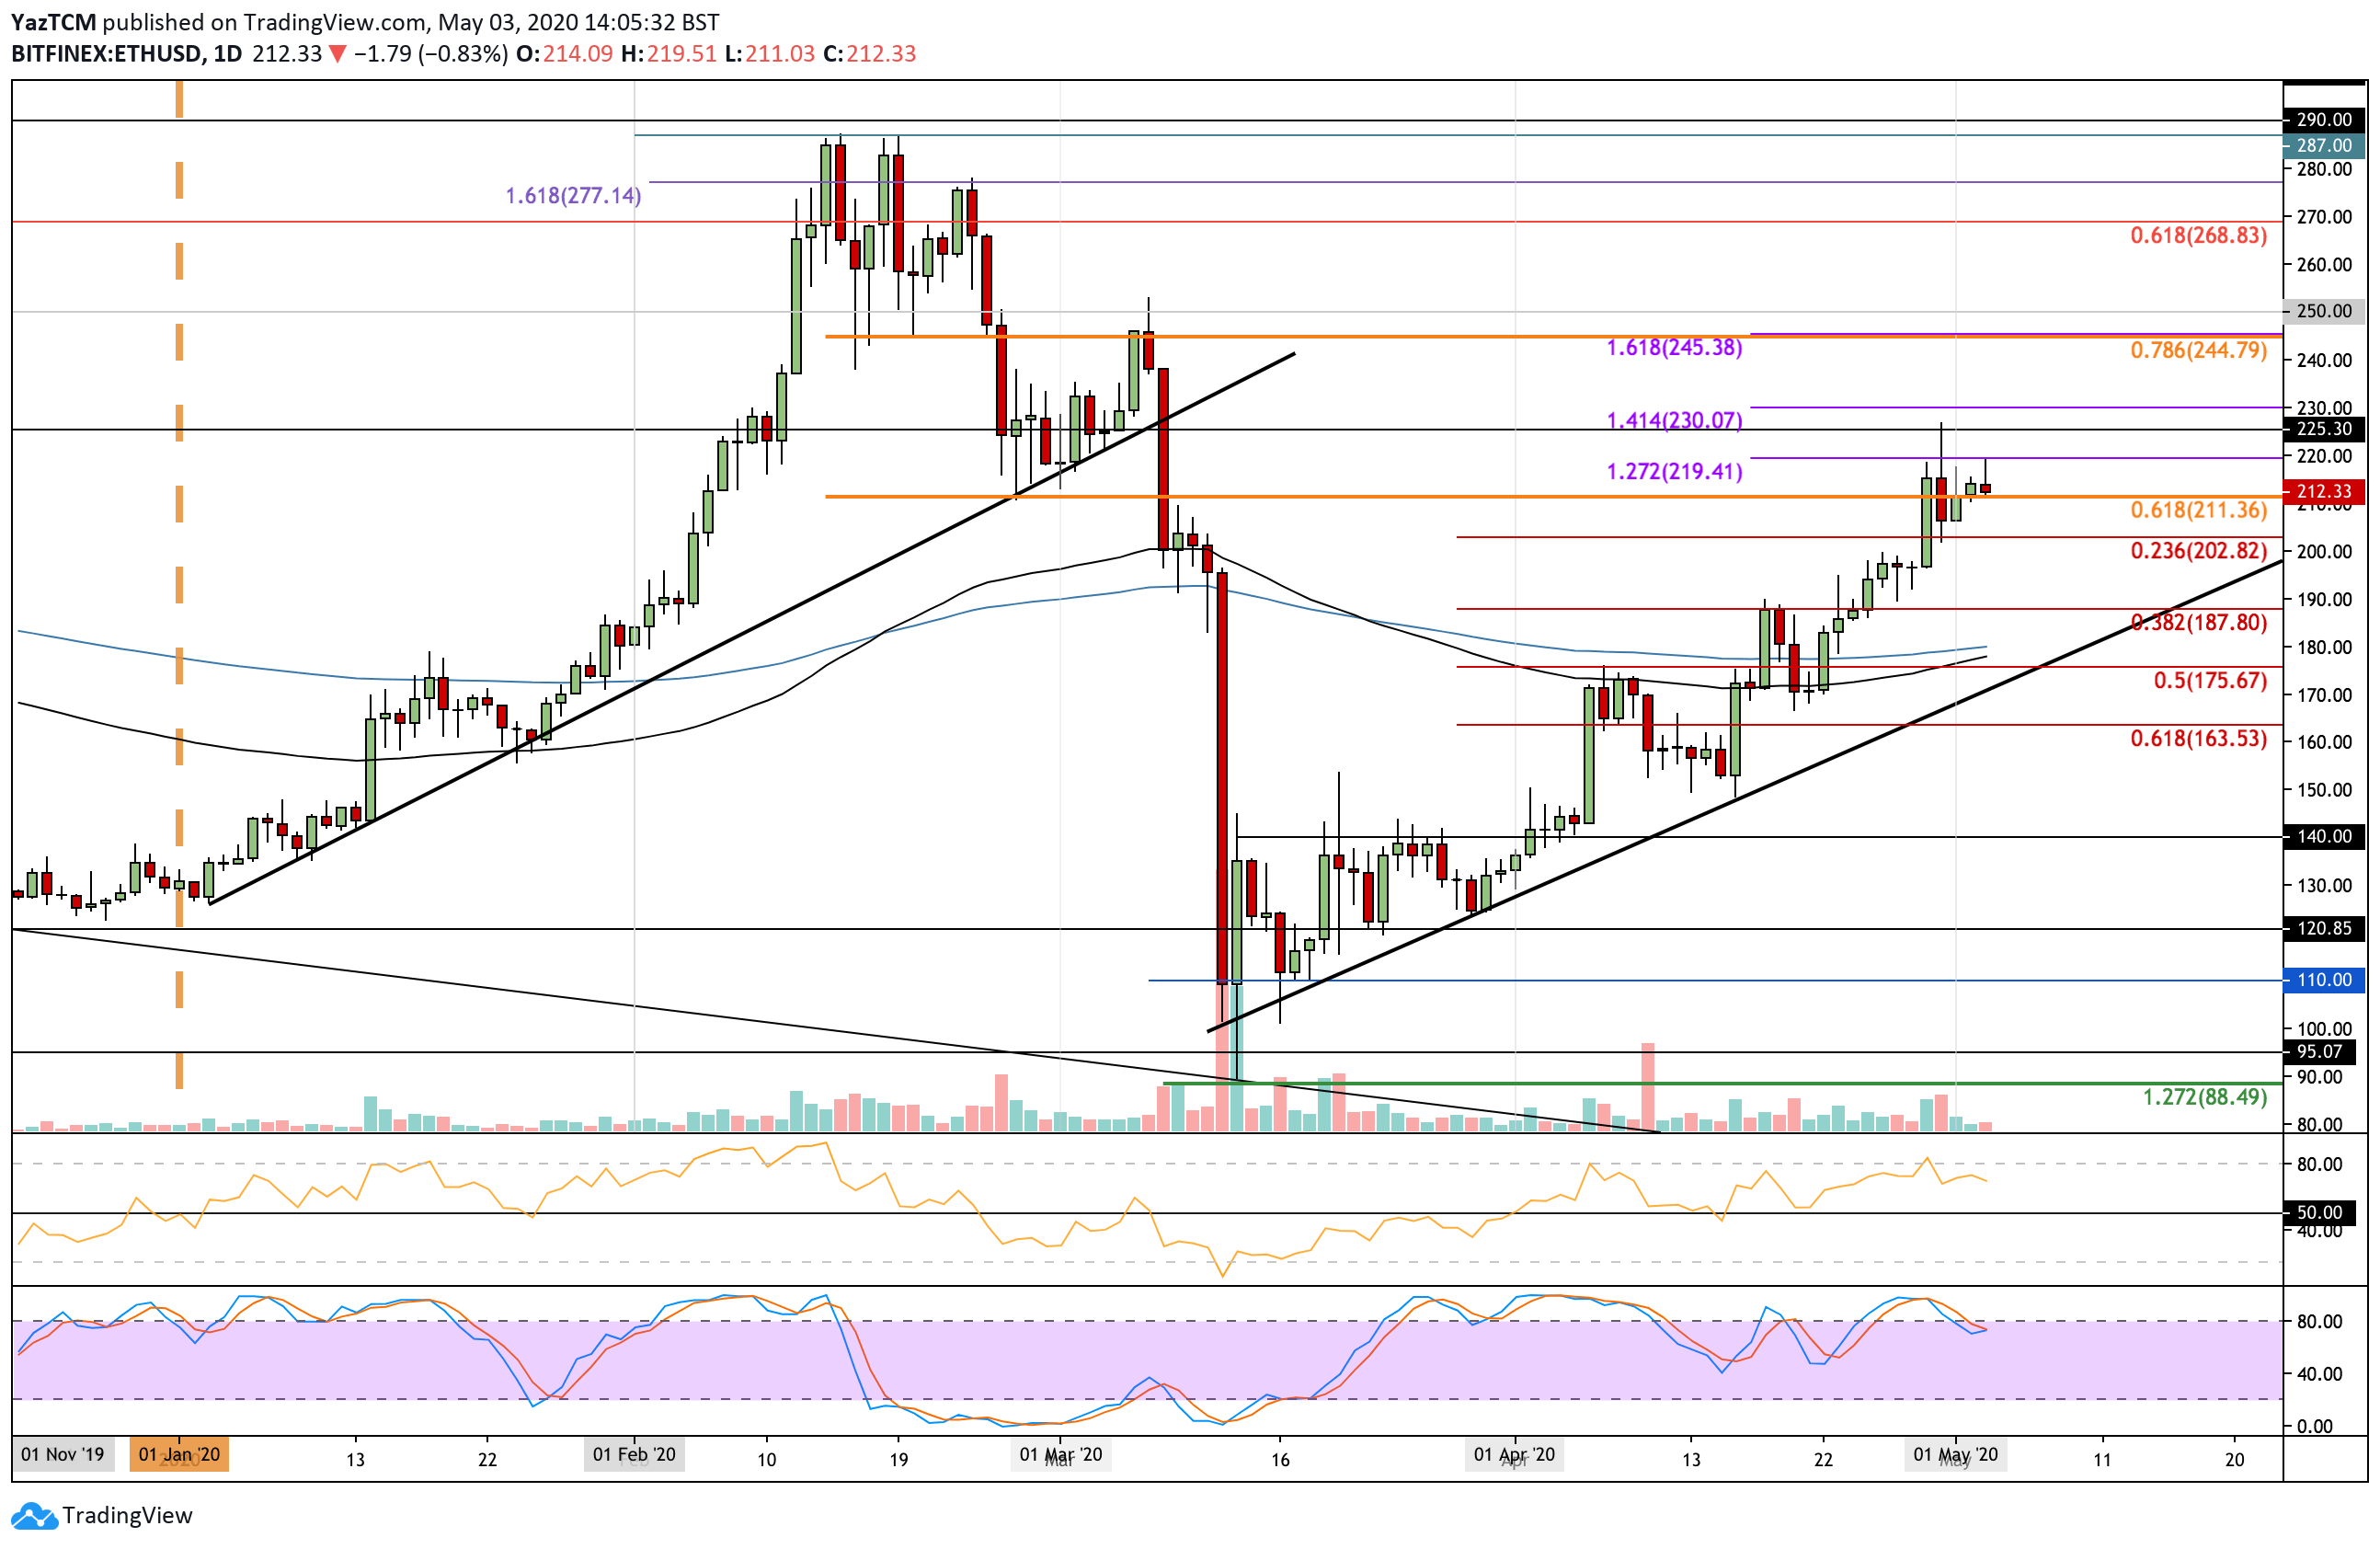
- Ethereum saw a 1% price decline over the past 24 hours of trading as it drops to the $210 price area.
- The cryptocurrency was recently struggling at the $220 level.
- Against Bitcoin, Ethereum dropped into the 0.0236 BTC support earlier today.
Key Support & Resistance Levels
ETH/USD:
Support: $211, $203, $200.
Resistance: $220, $225, $245.
ETH/BTC:
Support: 0.0236 BTC, 0.023 BTC, 0.0226 BTC
Resistance: 0.024 BTC, 0.0247 BTC, 0.025 BTC
ETH/USD – Ethereum Struggling at $220
Ethereum dropped by 1% today as it falls into the $211 support. It had made a brief attempt to push higher but was rejected by the resistance at $220 provided by a 1.272 Fibonacci Extension level.
The cryptocurrency is still on top of a bullish short term ascending trend-line; however, it must break the resistance at $220 and $225 for the bull run to continue. It would still need to drop beneath $180 (200-days EMA) before being in danger of turning bearish.
ETH-USD Short Term Price Prediction
If the bulls manage to break above the resistance at $220, the next resistance likely lies at $225. Above this, resistance is found at $230 (1.414 Fib Extension), $245 (bearish .786 Fib Retracement), and $250.
On the other side, if the sellers push beneath $211, the closest support is located at $203 (.236 Fib Retracement), $200, and $188 (.382 Fib Retracement).
The RSI remains above 50 but is starting to lose value, which could be a sign that the bullish momentum is fading away. However, if it can manage to remain above 50 during the retracement, the bulls will stay in control.
ETH/BTC – ETH Rebounds From 0.0236 BTC
Against Bitcoin, Ethereum dropped lower today towards the support level at 0.0236 BTC. It rebounded slightly from there as it currently trades at 0.0237 BTC, however, the momentum remains in the hands of the bears so ETH can be expected to discover lower targets against BTC.
The cryptocurrency had dropped out of its previous trading range last week as it broke down the 0.0247 BTC support. This sparked the bearish momentum to gather steam and pushed ETH lower against BTC.

ETH-BTC Short Term Price Prediction
If the sellers break down 0.0236 BTC, support can be found at 0.023 BTC (.5 Fib Retracement & 100-days EMA). Beneath this, support lies at 0.0226 BTC (200-days EMA) and 0.0223 BTC (.618 Fib Retracement).
Alternatively, if the buyers push higher, the next resistance is located at 0.024 BTC. Above this, further resistance lies at 0.0247 BTC and 0.025 BTC.
The RSI is well beneath 50 to indicate that the bears are in control of the market momentum. However, the Stochastic RSI is approaching oversold conditions, and a bullish crossover signal will be the first sign that a reversal may take place in the ETH/BTC market.