XRP dropped by a small 1.5% over the past 24 hours as it falls back into the %excerpt%.192 support.The cryptocurrency has now formed a very acute descending triangle formation.Against Bitcoin, the XRP recovery continues but is finding some resistance at the 2200 SAT level.Key Support & Resistance LevelsXRP/USD:Support: %excerpt%.192, %excerpt%.18, %excerpt%.175.Resistance: %excerpt%.207, %excerpt%.215, %excerpt%.225.XRP/BTC:Support: 2150 SAT, 2100 SAT, 2070 SAT.Resistance: 2200 SAT, 2300 SAT, 2360 SAT.XRP/USD – XRP Forms Acute Descending TriangleXRP has formed an acute descending triangle pattern with the floor at the support provided by a .382 Fib Retracement at %excerpt%.192. The coin has failed to break the upper boundary of this pattern for the entire month and is quickly approaching the apex where a breakout is expected.As the days pass,
Topics:
Yaz Sheikh considers the following as important: Ripple (XRP) Price, XRP Analysis, xrpbtc, xrpusd
This could be interesting, too:
Jordan Lyanchev writes Ripple’s (XRP) Surge to Triggers Over Million in Short Liquidations
Jordan Lyanchev writes Trump Confirms Work on Strategic Crypto Reserve: XRP, ADA, SOL Included
Dimitar Dzhondzhorov writes Is a Major Ripple v. SEC Lawsuit Development Expected This Week? Here’s Why
Mandy Williams writes Ripple Releases Institutional DeFi Roadmap for XRP Ledger in 2025
- XRP dropped by a small 1.5% over the past 24 hours as it falls back into the $0.192 support.
- The cryptocurrency has now formed a very acute descending triangle formation.
- Against Bitcoin, the XRP recovery continues but is finding some resistance at the 2200 SAT level.
Key Support & Resistance Levels
XRP/USD:
Support: $0.192, $0.18, $0.175.
Resistance: $0.207, $0.215, $0.225.
XRP/BTC:
Support: 2150 SAT, 2100 SAT, 2070 SAT.
Resistance: 2200 SAT, 2300 SAT, 2360 SAT.
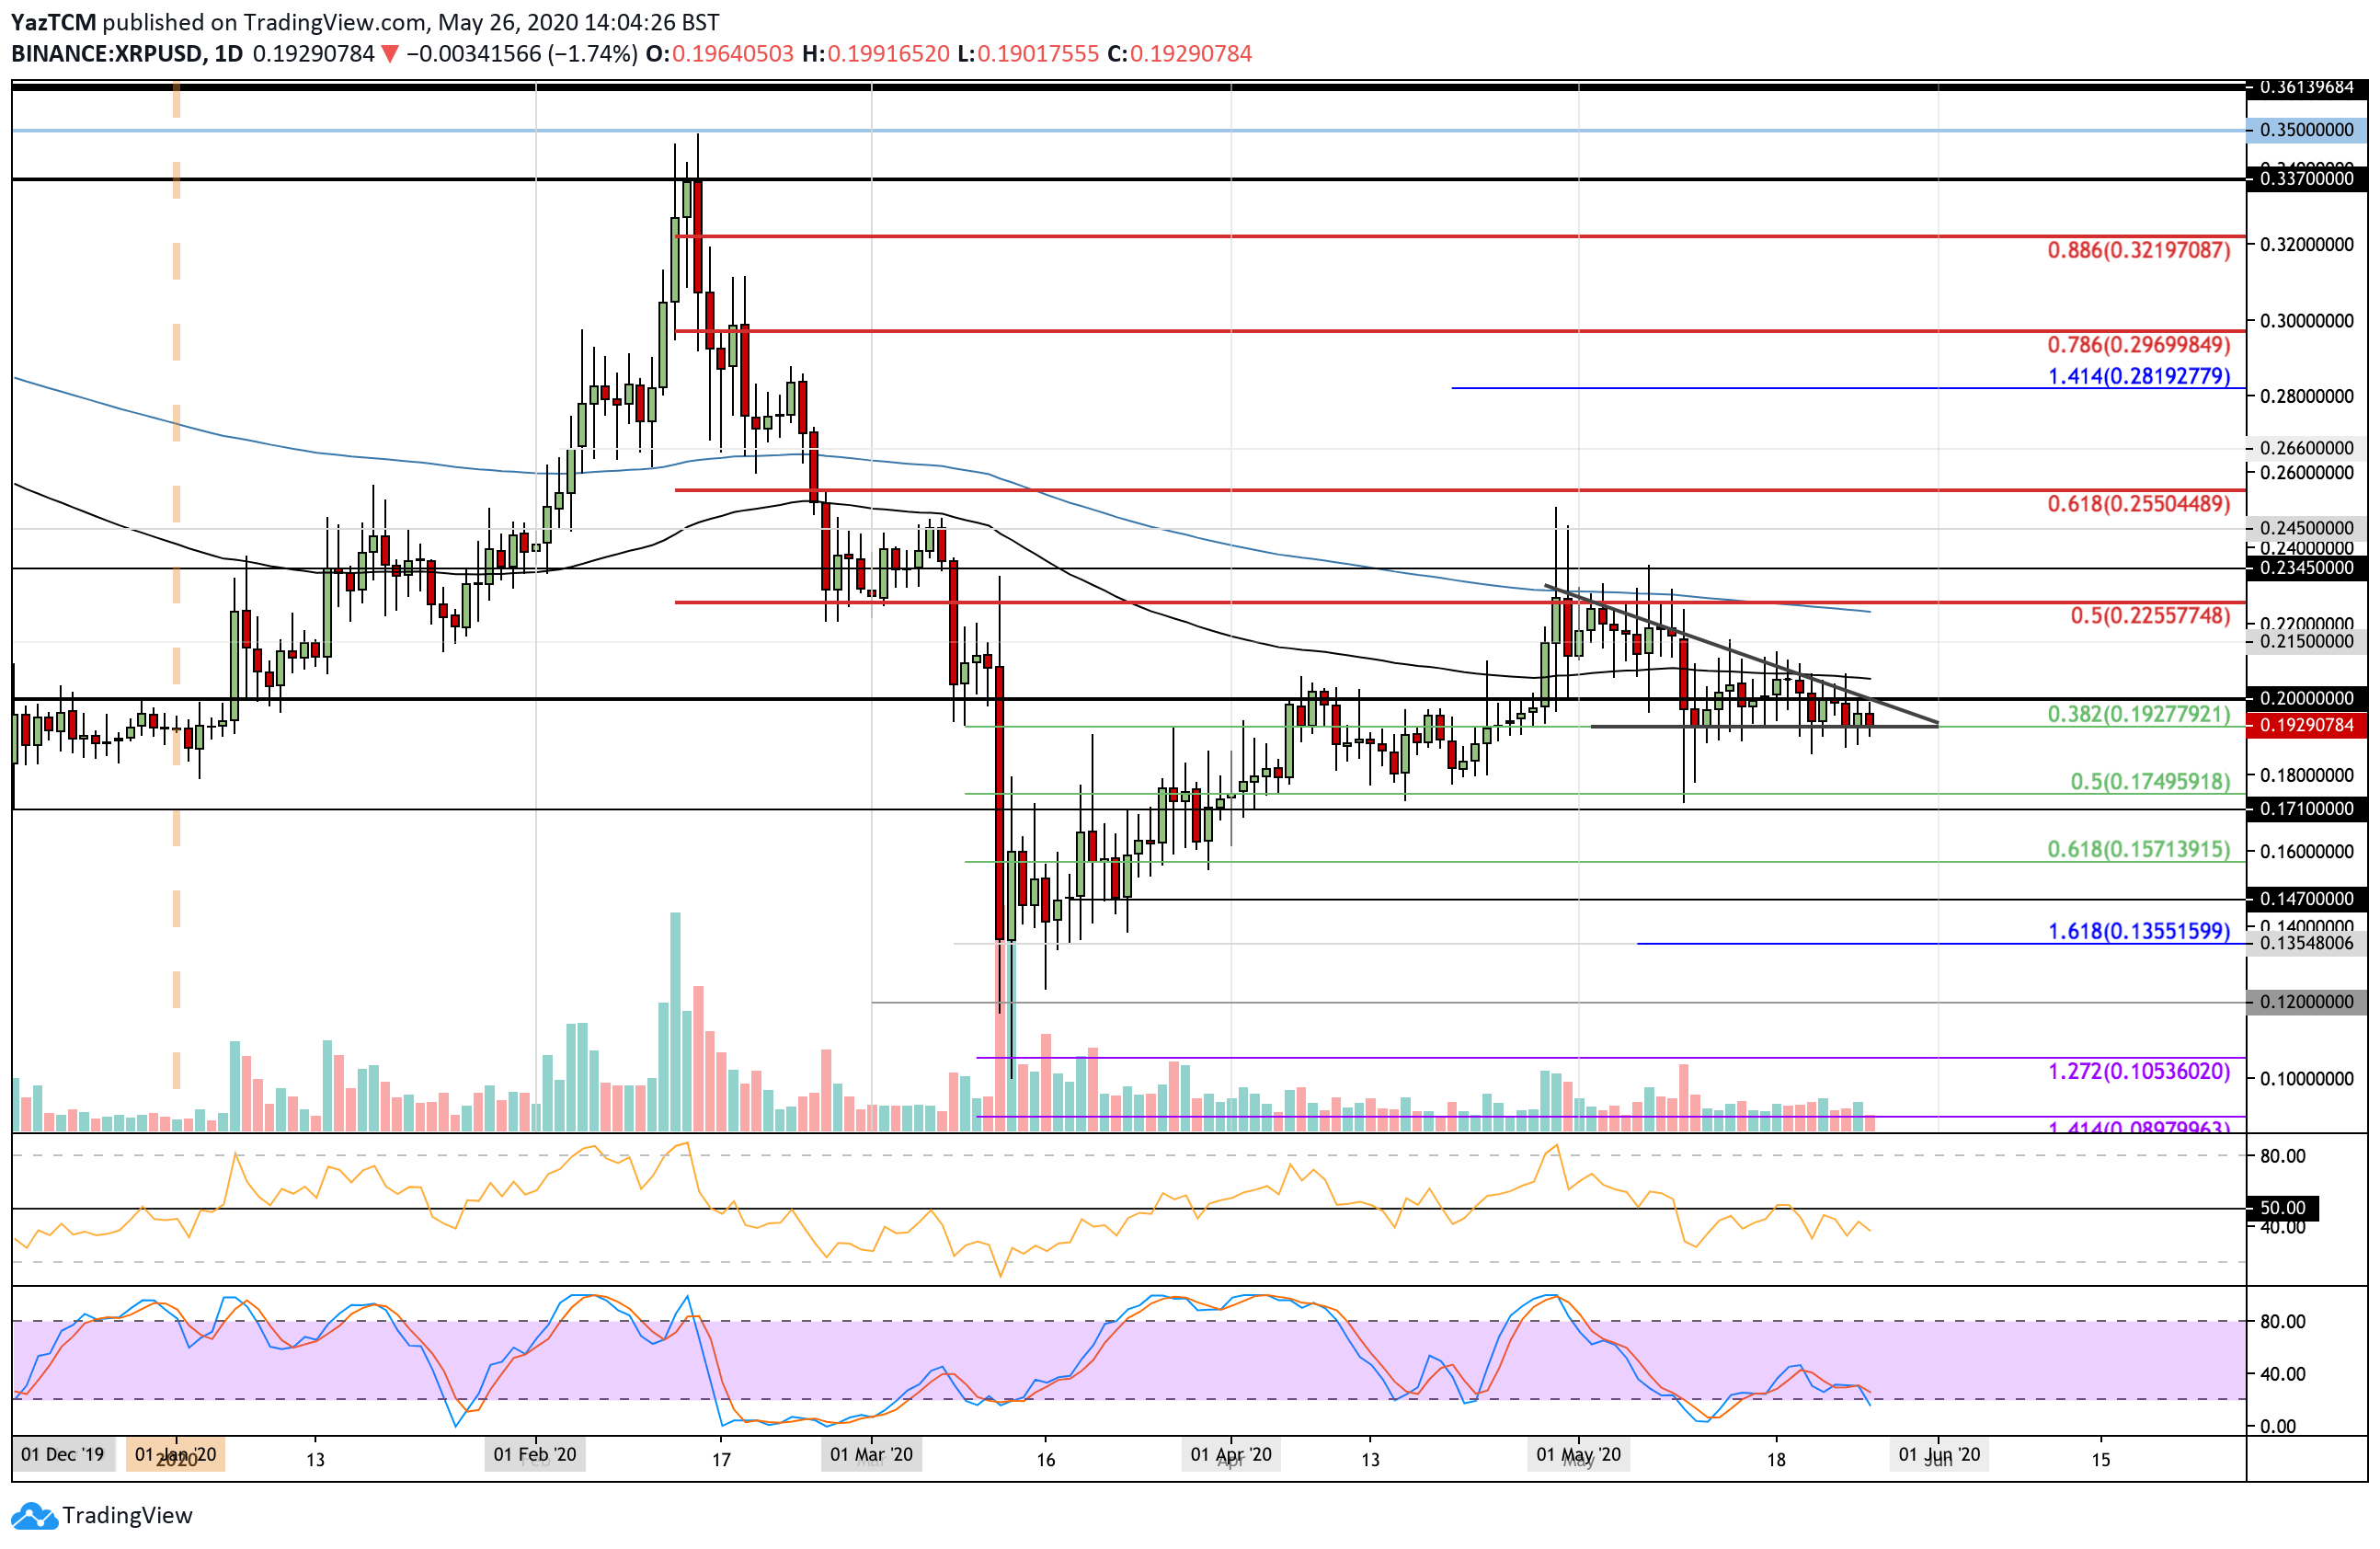
XRP/USD – XRP Forms Acute Descending Triangle
XRP has formed an acute descending triangle pattern with the floor at the support provided by a .382 Fib Retracement at $0.192. The coin has failed to break the upper boundary of this pattern for the entire month and is quickly approaching the apex where a breakout is expected.
As the days pass, it is looking ever more likely that XRP will break to the downside after it continuously failed to break the 100-day EMA resistance for the majority of May 2020. The pattern is reaching the apex, so a breakout in either direction could be seen before the end of the month.
XRP-USD Short Term Price Prediction
If the bears do push beneath the lower boundary of the triangle, the first level of support is located at $0.18. Beneath this, added support lies at $0.175 (.5 Fib Retracement), $0.171, and $0.157 (.618 Fib Retracement).
On the other side, the upper boundary of the triangle now lies at $0.2. If the buyers can push above this, resistance is expected at the 100-days EMA at around $0.207. Additional resistance is located at $0.215, $0.225 (bearish .5 Fib Retracement & 200-days EMA), and $0.234.
The RSI is beneath the 50 line to show that the sellers control the market momentum. For a positive breakout, the RSI would have to reverse and break above 50 to allow the buyers to take control of the momentum.
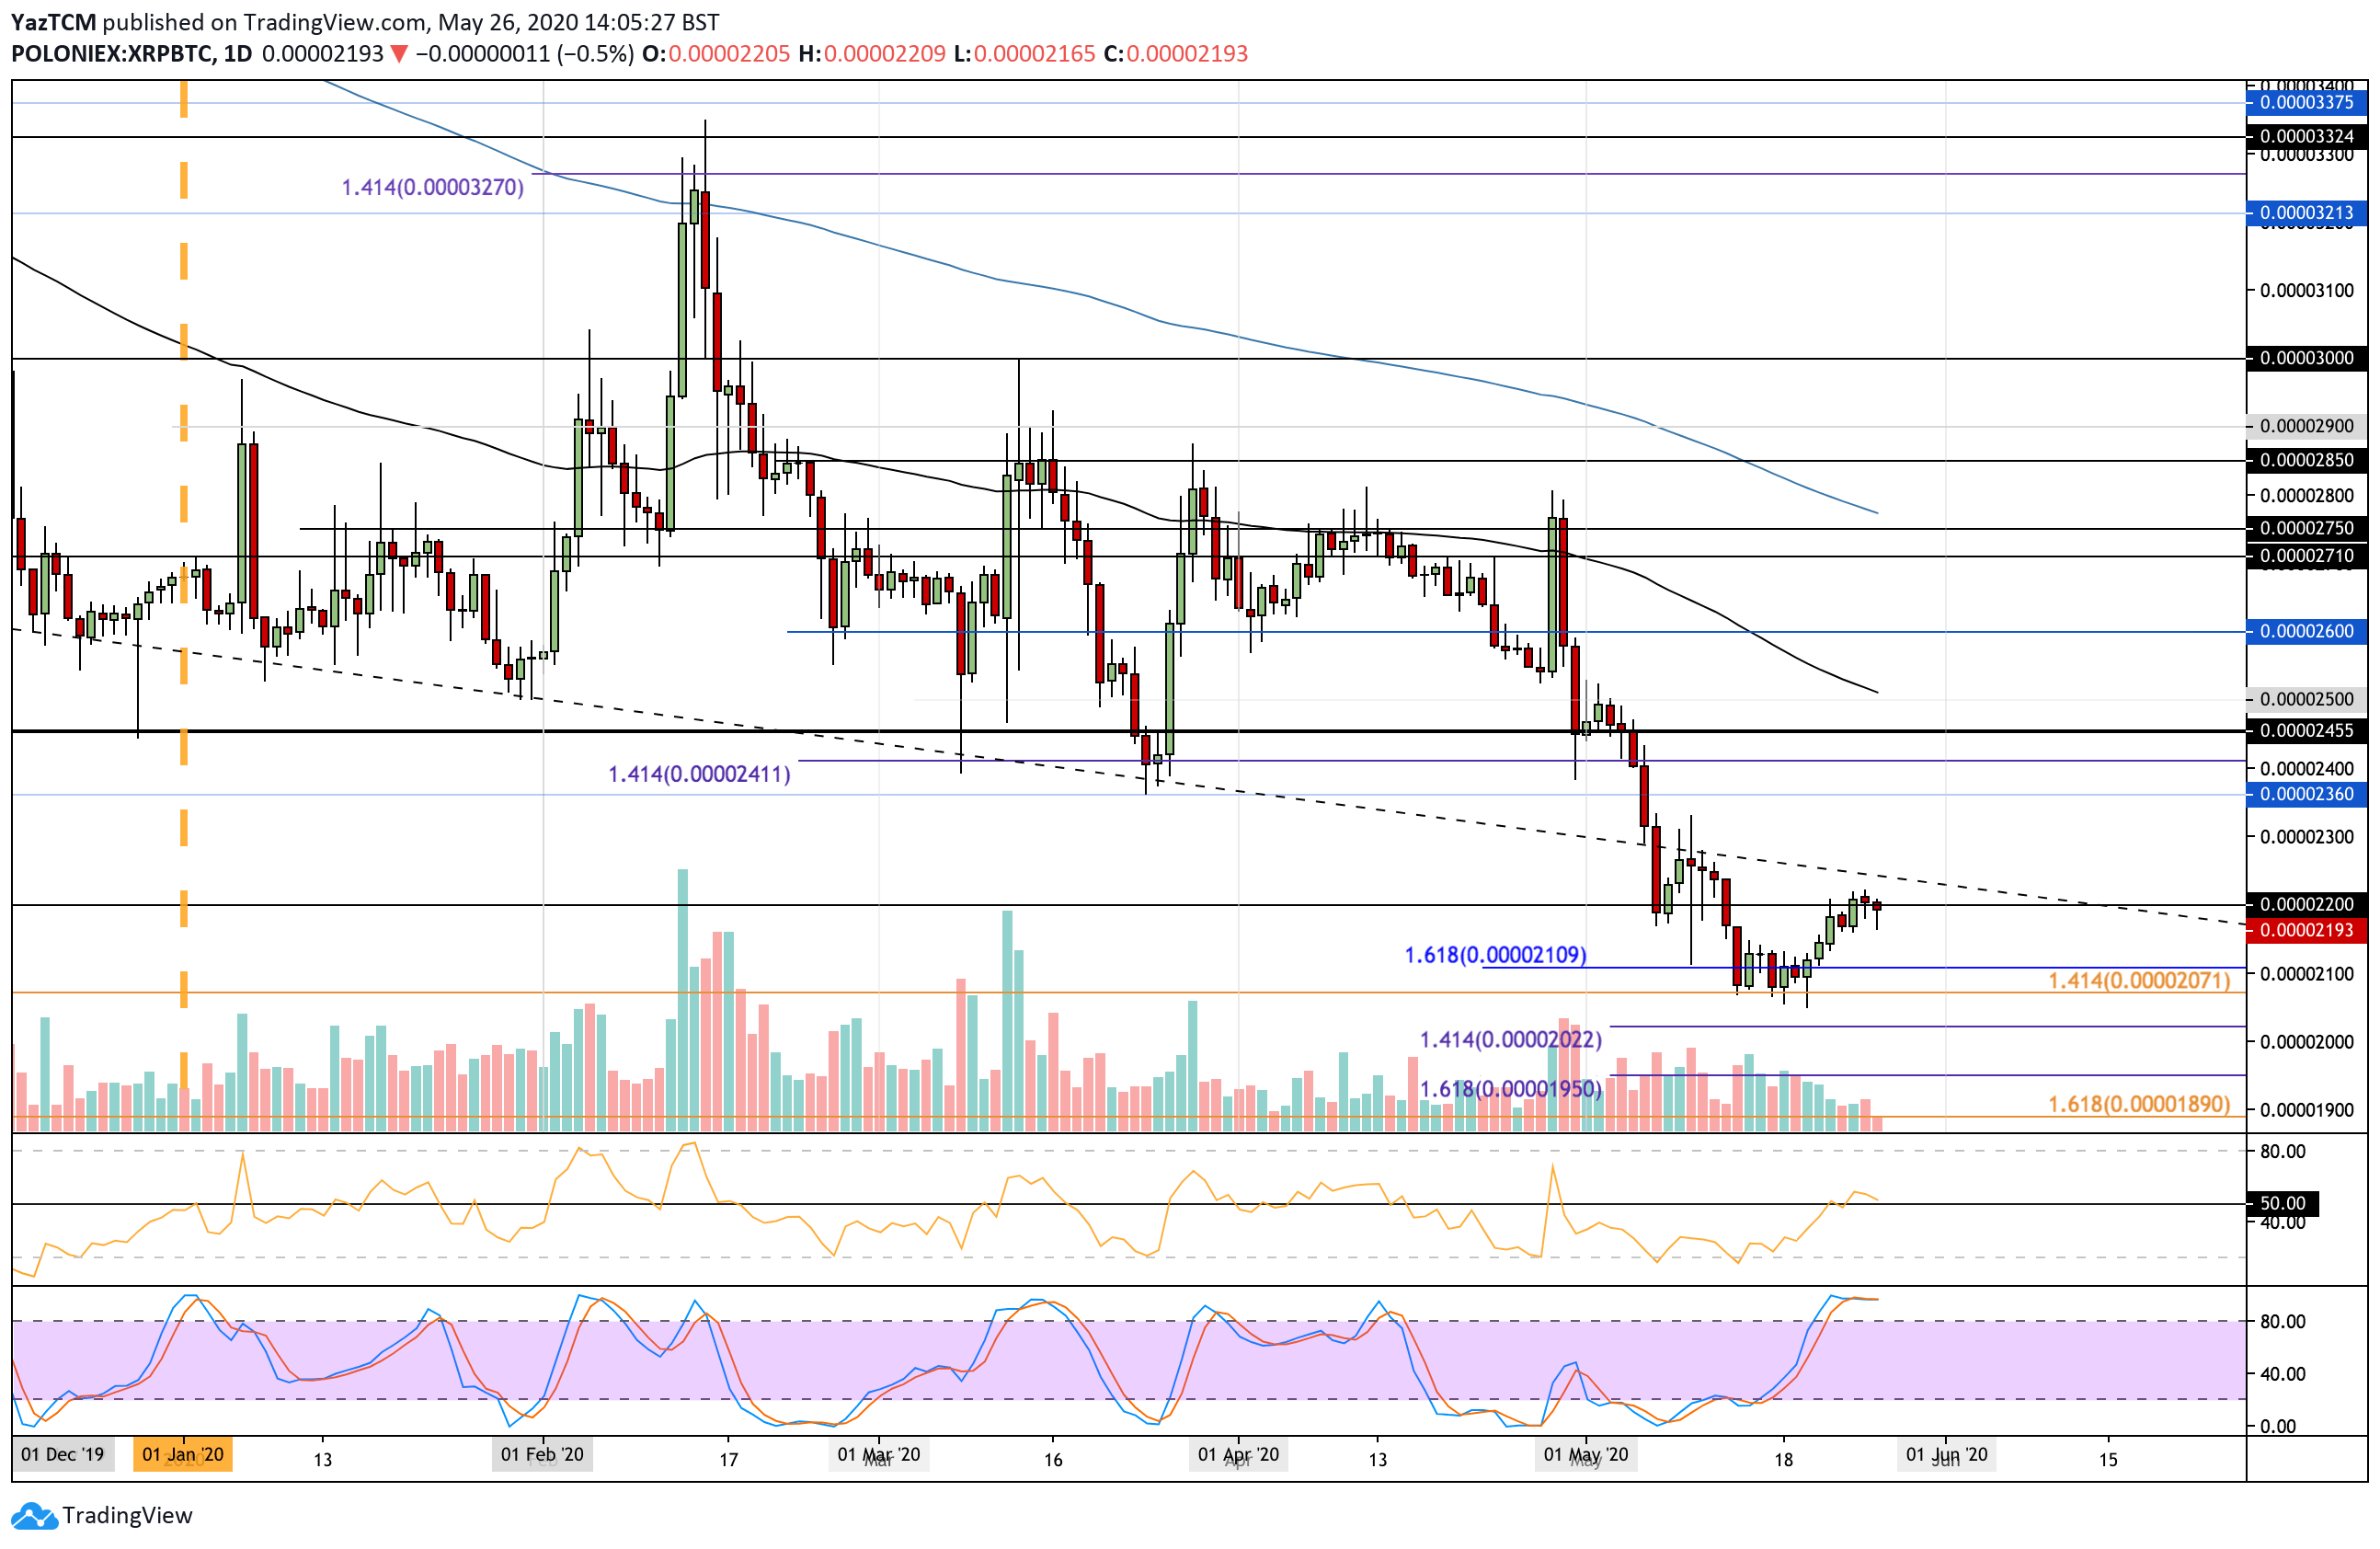
XRP/BTC – XRP Recovery Stalls At 2200 SAT
Against Bitcoin, XRP managed to rebound from the support at 2071 SAT last week as it started to push higher. The coin reached above the 2200 SAT level yesterday but has since pushed back beneath it as it trades at 2190 SAT.
For the recovery to continue, XRP would have to continue above 2200 SAT and head toward 2300 SAT. Otherwise, XRP can be expected to head back to the multi-year lows at 2070 SAT.
XRP-BTC Short Term Price Prediction
If the buyers do push back above 2200 SAT, the first level of strong resistance lies at 2300 SAT. Above this, resistance lies at 2360 SAT, 2400 SAT, 2455 SAT, and 2500 SAT (100-days EMA).
On the other side, support is located at 2150 SAT, 2100 SAT, and 2070 SAT. Beneath this, added support lies at 2022 SAT, 2000 SAT, and 1950 SAT.
The RSI has dropped back into the 50 line after briefly stepping above it. For the recovery to continue, the RSI must remain above the 50 line to prevent the bears from taking control of the market.