XRP continues to move sideways along %excerpt%.2 today after seeing a very small 0.7% price increase.Over the past week, XRP increased by 4% after it bounced from %excerpt%.192 to break back above %excerpt%.20.Against Bitcoin, XRP continues to trade at multi-year lows as the bulls battle to remain above 2070 SAT.Key Support & Resistance LevelsXRP/USD:Support: %excerpt%.20, %excerpt%.192, %excerpt%.18.Resistance: %excerpt%.207, %excerpt%.225, %excerpt%.235.XRP/BTC:Support: 2070 SAT, 2022 SAT, 2000 SAT.Resistance: 2200 SAT, 2300 SAT, 2360 SAT.XRP/USD – Ripple Continues To Fail To Break 100-days EMAXRP managed to break above the %excerpt%.20 level this week after bouncing from the support at %excerpt%.192, provided by a .382 Fib Retracement. However, the coin continues to struggle to close above the resistance at the 100-days EMA around %excerpt%.207.XRP has failed to break
Topics:
Yaz Sheikh considers the following as important: Ripple (XRP) Price, XRP Analysis, xrpbtc, xrpusd
This could be interesting, too:
Jordan Lyanchev writes Ripple’s (XRP) Surge to Triggers Over Million in Short Liquidations
Jordan Lyanchev writes Trump Confirms Work on Strategic Crypto Reserve: XRP, ADA, SOL Included
Dimitar Dzhondzhorov writes Is a Major Ripple v. SEC Lawsuit Development Expected This Week? Here’s Why
Mandy Williams writes Ripple Releases Institutional DeFi Roadmap for XRP Ledger in 2025
- XRP continues to move sideways along $0.2 today after seeing a very small 0.7% price increase.
- Over the past week, XRP increased by 4% after it bounced from $0.192 to break back above $0.20.
- Against Bitcoin, XRP continues to trade at multi-year lows as the bulls battle to remain above 2070 SAT.
Key Support & Resistance Levels
XRP/USD:
Support: $0.20, $0.192, $0.18.
Resistance: $0.207, $0.225, $0.235.
XRP/BTC:
Support: 2070 SAT, 2022 SAT, 2000 SAT.
Resistance: 2200 SAT, 2300 SAT, 2360 SAT.
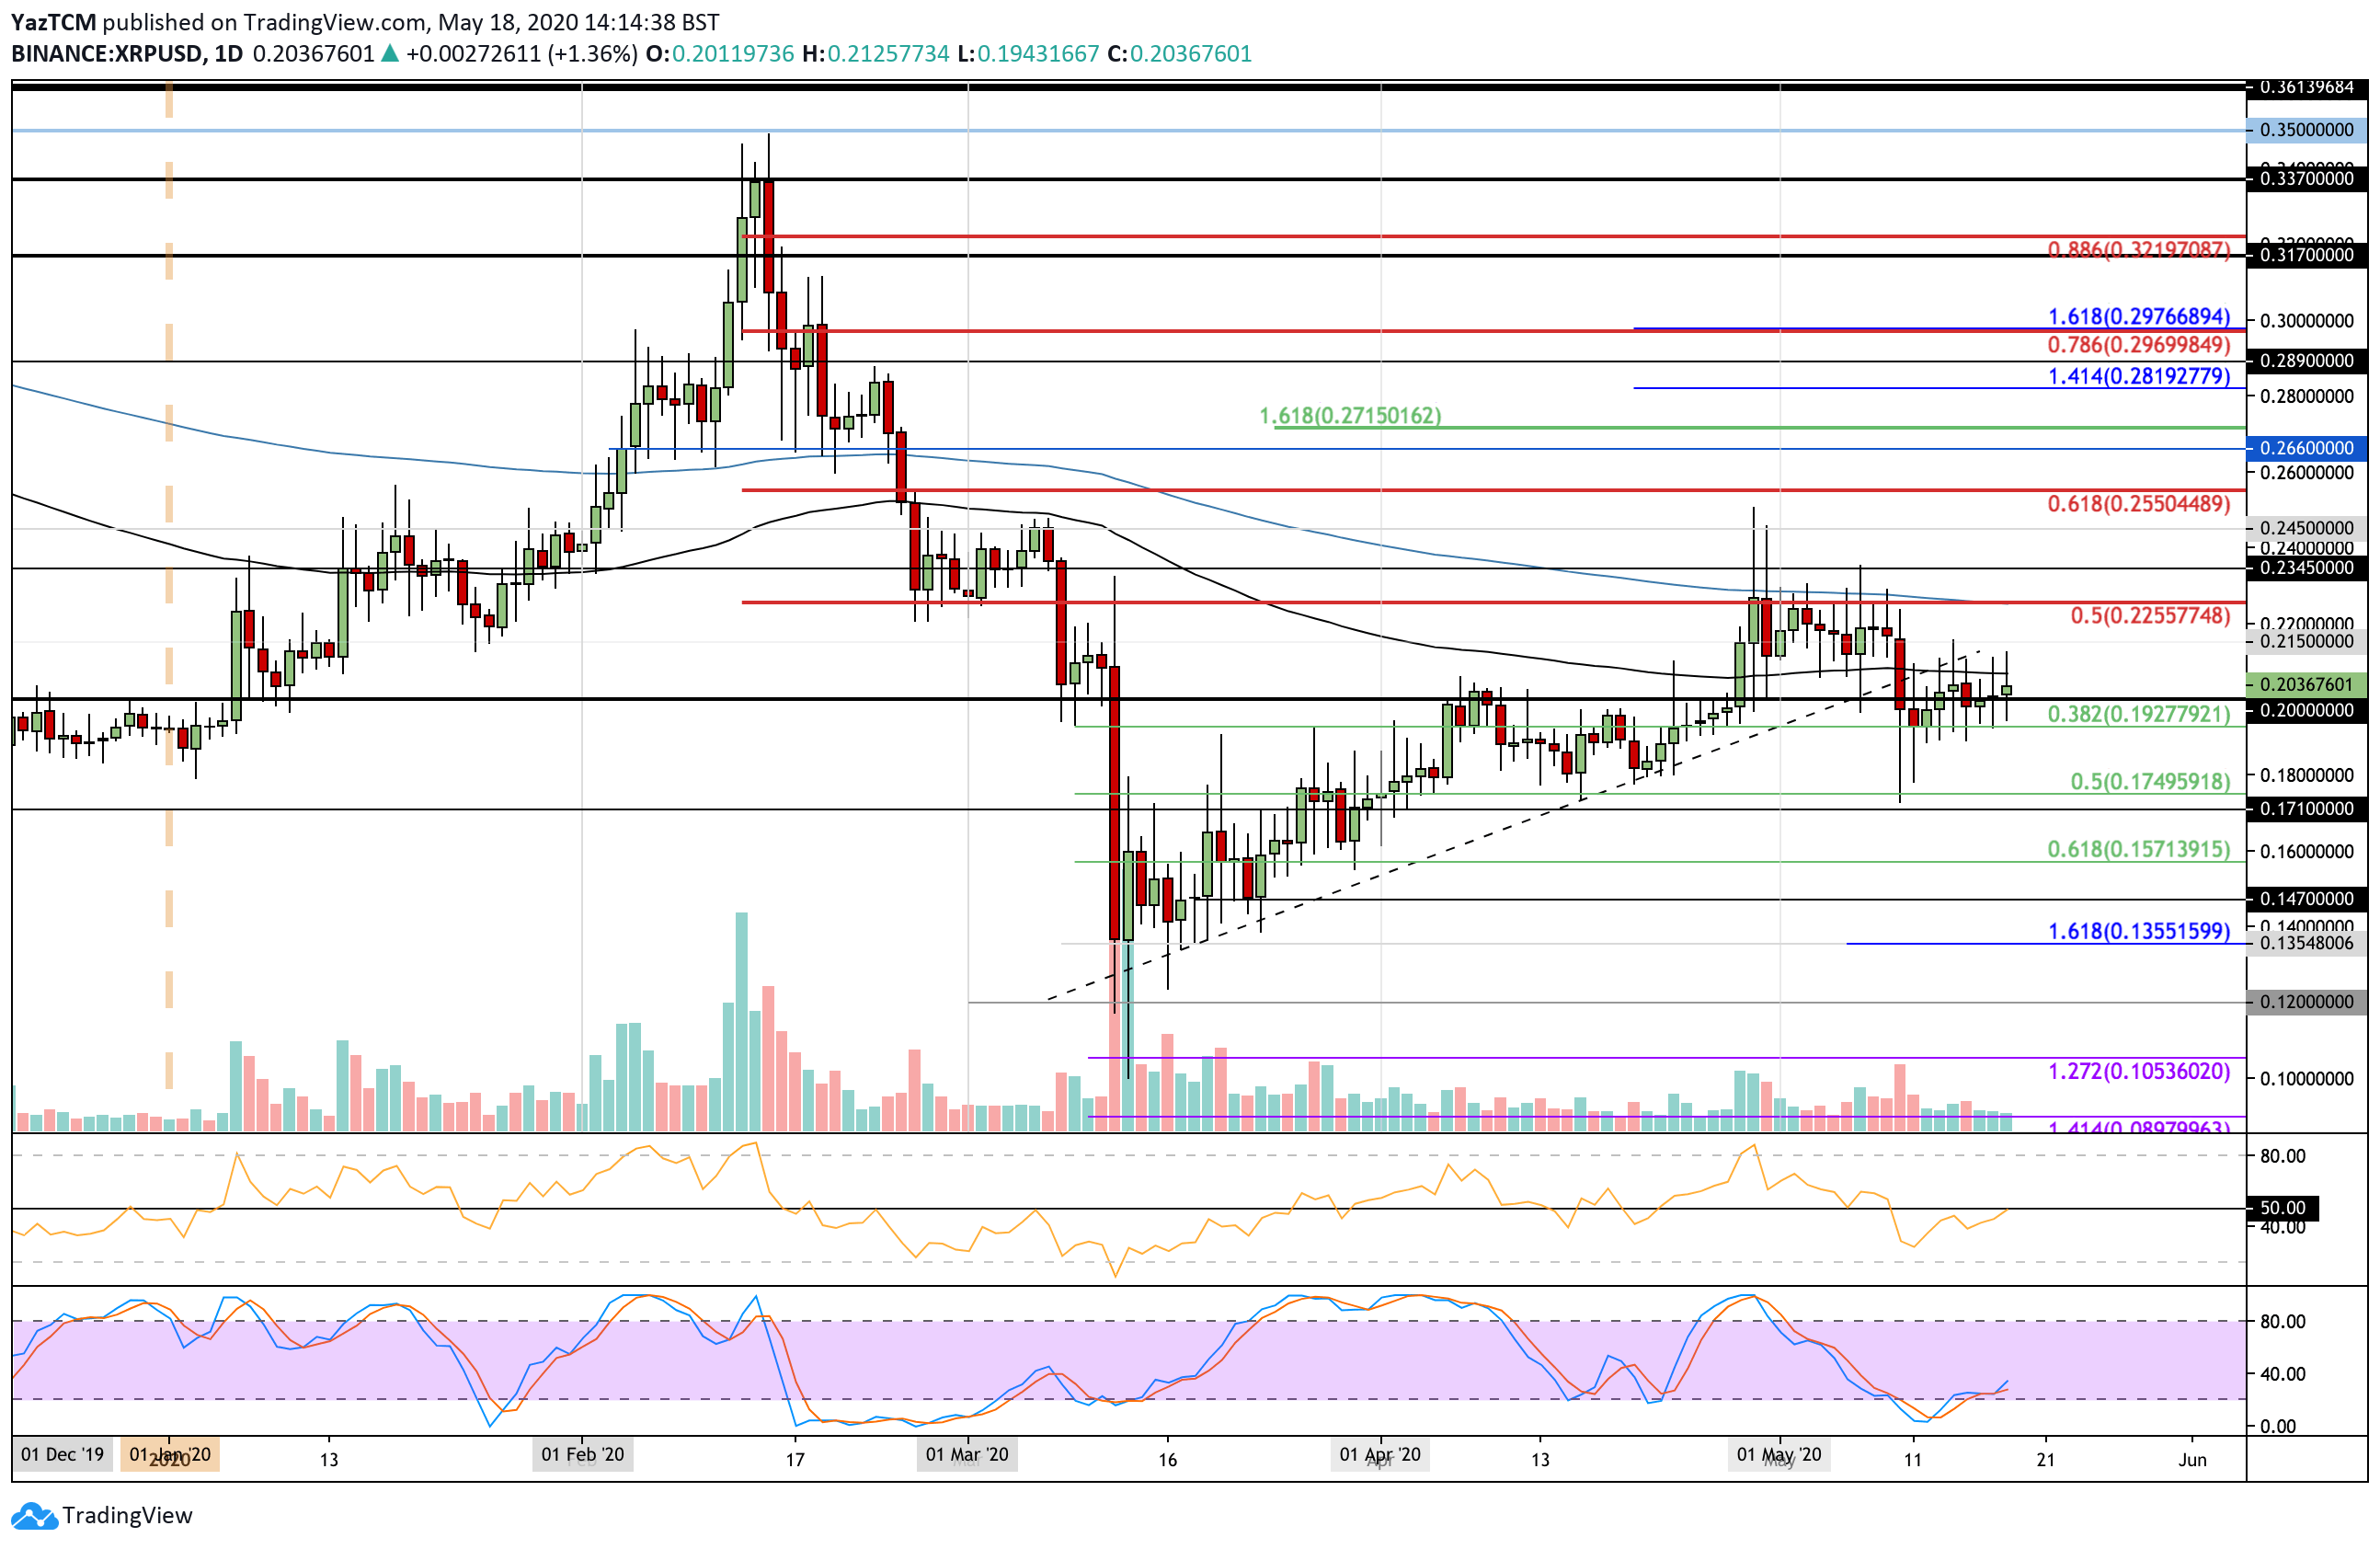
XRP/USD – Ripple Continues To Fail To Break 100-days EMA
XRP managed to break above the $0.20 level this week after bouncing from the support at $0.192, provided by a .382 Fib Retracement. However, the coin continues to struggle to close above the resistance at the 100-days EMA around $0.207.
XRP has failed to break above this resistance over the past 8-days of trading and must climb above if it would like to head back toward the $0.225 level (200-day EMA) or else it is likely to head back lower beneath $0.20.
XRP-USD Short Term Price Prediction
If the buyers can break the 100-days EMA, resistance is located at $0.215. Above this, strong resistance lies at $0.225 (bearish .5 Fib Retracement & 200-days EMA), $0.234, and $0.245. This is followed by added resistance at $0.255 (bearish .618 Fib Retracement).
On the other hand, if the sellers push back beneath $0.20, support is firstly found at $0.192 (.382 Fib Retracement). Beneath this, support lies at $0.18, $0.175 (.5 Fib Retracement), and $0.171.
The RSI has returned to the 50 line to indicate indecision within the market. For a break above the 100-days EMA, the RSI must break above the 50 line to show the bulls are in charge of the market momentum.
The Stochastic RSI is primed for a strong bullish crossover signal that should help to break the 100-days EMA.
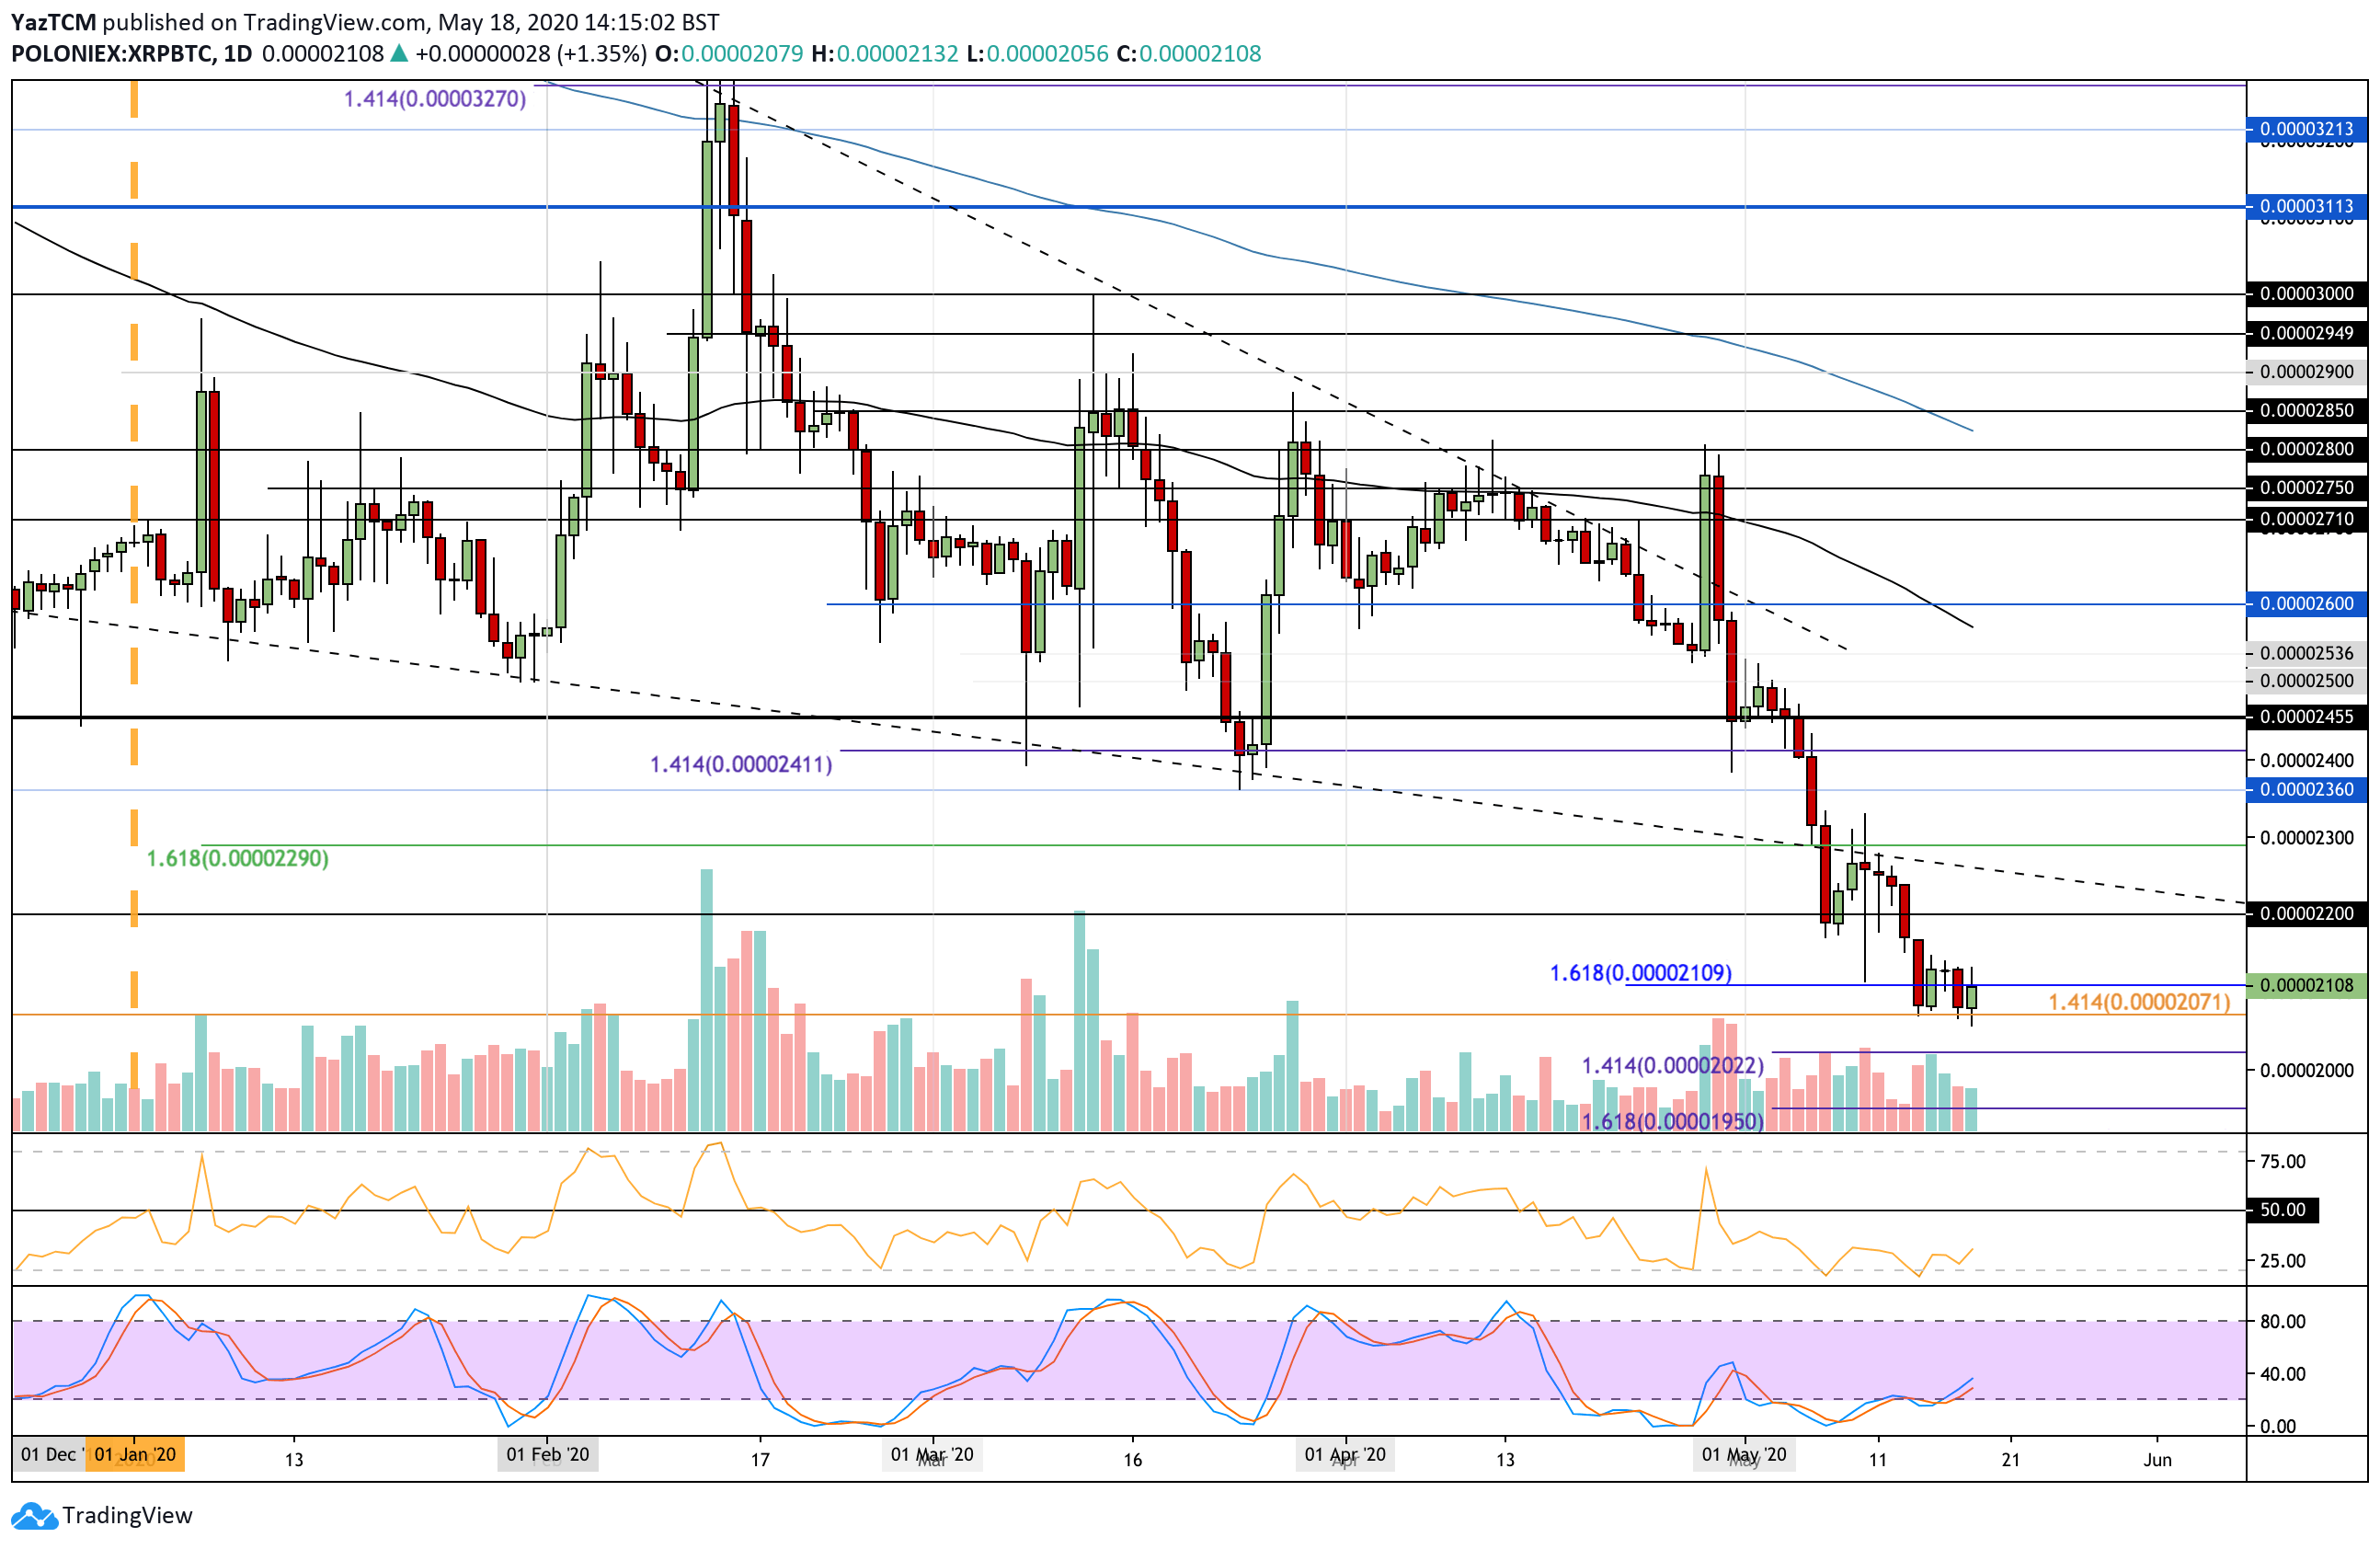
XRP/BTC – Bulls Batling To Remain Above 2070 SAT
Against BTC, XRP continues to struggle as the buyers battle to remain above the multi-year lows at 2070 SAT. The coin had dropped from a high of around 2500 SAT at the start of May to reach this 2-year price low at 2070 SAT, provided by a long term downside 1.414 Fib Extension.
If XRP continues to slide beneath this level, it is likely that XRP will not break the $0.207 level (100-days EMA) against the USD.
XRP-BTC Short Term Price Prediction
If the sellers do push beneath 2070 SAT, the first level of support toward the downside lies at 2022 SAT (short term downside 1.414 Fib Extension). Beneath this, support is located at 2000 SAT and 1950 SAT (short term downside 1.618 Fib Extension).
If the bulls can rebound from 2070 SAT and push higher, resistance is located at 2200 SAT. Above this, resistance lies at 2300 SAT and 2360 SAT.
The RSI remains in oversold conditions. However, it is starting to point higher. This shows that the selling pressure might begin to fade over the coming days if it can rise back toward 50. Additionally, the Stochastic RSI also produced a bullish crossover signal that could help to push XRP higher against BTC.