XRP saw a small 1% decline as it dropped into the %excerpt%.185 level.The cryptocurrency has now broken beneath a rising trend line as it looks to head lower.Against Bitcoin, XRP failed to close above the 100-days EMA and has fallen 2710 SAT.Key Support & Resistance LevelsXRP/USD:Support: %excerpt%.182, %excerpt%.171, %excerpt%.16.Resistance: %excerpt%.191, %excerpt%.2, %excerpt%.215.XRP/BTC:Support: 2710 SAT, 2680 SAT, 2620 SAT.Resistance: 2750 SAT, 2800 SAT, 2850 SAT.XRP/USD: Ripple Drops Beneath The Rising Trend LineXRP had rolled over from the %excerpt%.2 resistance last week, causing the cryptocurrency to initially drop into support at a rising trend line. The cryptocurrency broke beneath this rising trend line support today as it reaches %excerpt%.185.XRP is now in a predicament as it enters bearish territory beneath the trend line. If Bitcoin
Topics:
Yaz Sheikh considers the following as important: Ripple (XRP) Price, XRP Analysis, xrpbtc, xrpusd
This could be interesting, too:
Jordan Lyanchev writes Ripple’s (XRP) Surge to Triggers Over Million in Short Liquidations
Jordan Lyanchev writes Trump Confirms Work on Strategic Crypto Reserve: XRP, ADA, SOL Included
Dimitar Dzhondzhorov writes Is a Major Ripple v. SEC Lawsuit Development Expected This Week? Here’s Why
Mandy Williams writes Ripple Releases Institutional DeFi Roadmap for XRP Ledger in 2025
- XRP saw a small 1% decline as it dropped into the $0.185 level.
- The cryptocurrency has now broken beneath a rising trend line as it looks to head lower.
- Against Bitcoin, XRP failed to close above the 100-days EMA and has fallen 2710 SAT.
Key Support & Resistance Levels
XRP/USD:
Support: $0.182, $0.171, $0.16.
Resistance: $0.191, $0.2, $0.215.
XRP/BTC:
Support: 2710 SAT, 2680 SAT, 2620 SAT.
Resistance: 2750 SAT, 2800 SAT, 2850 SAT.
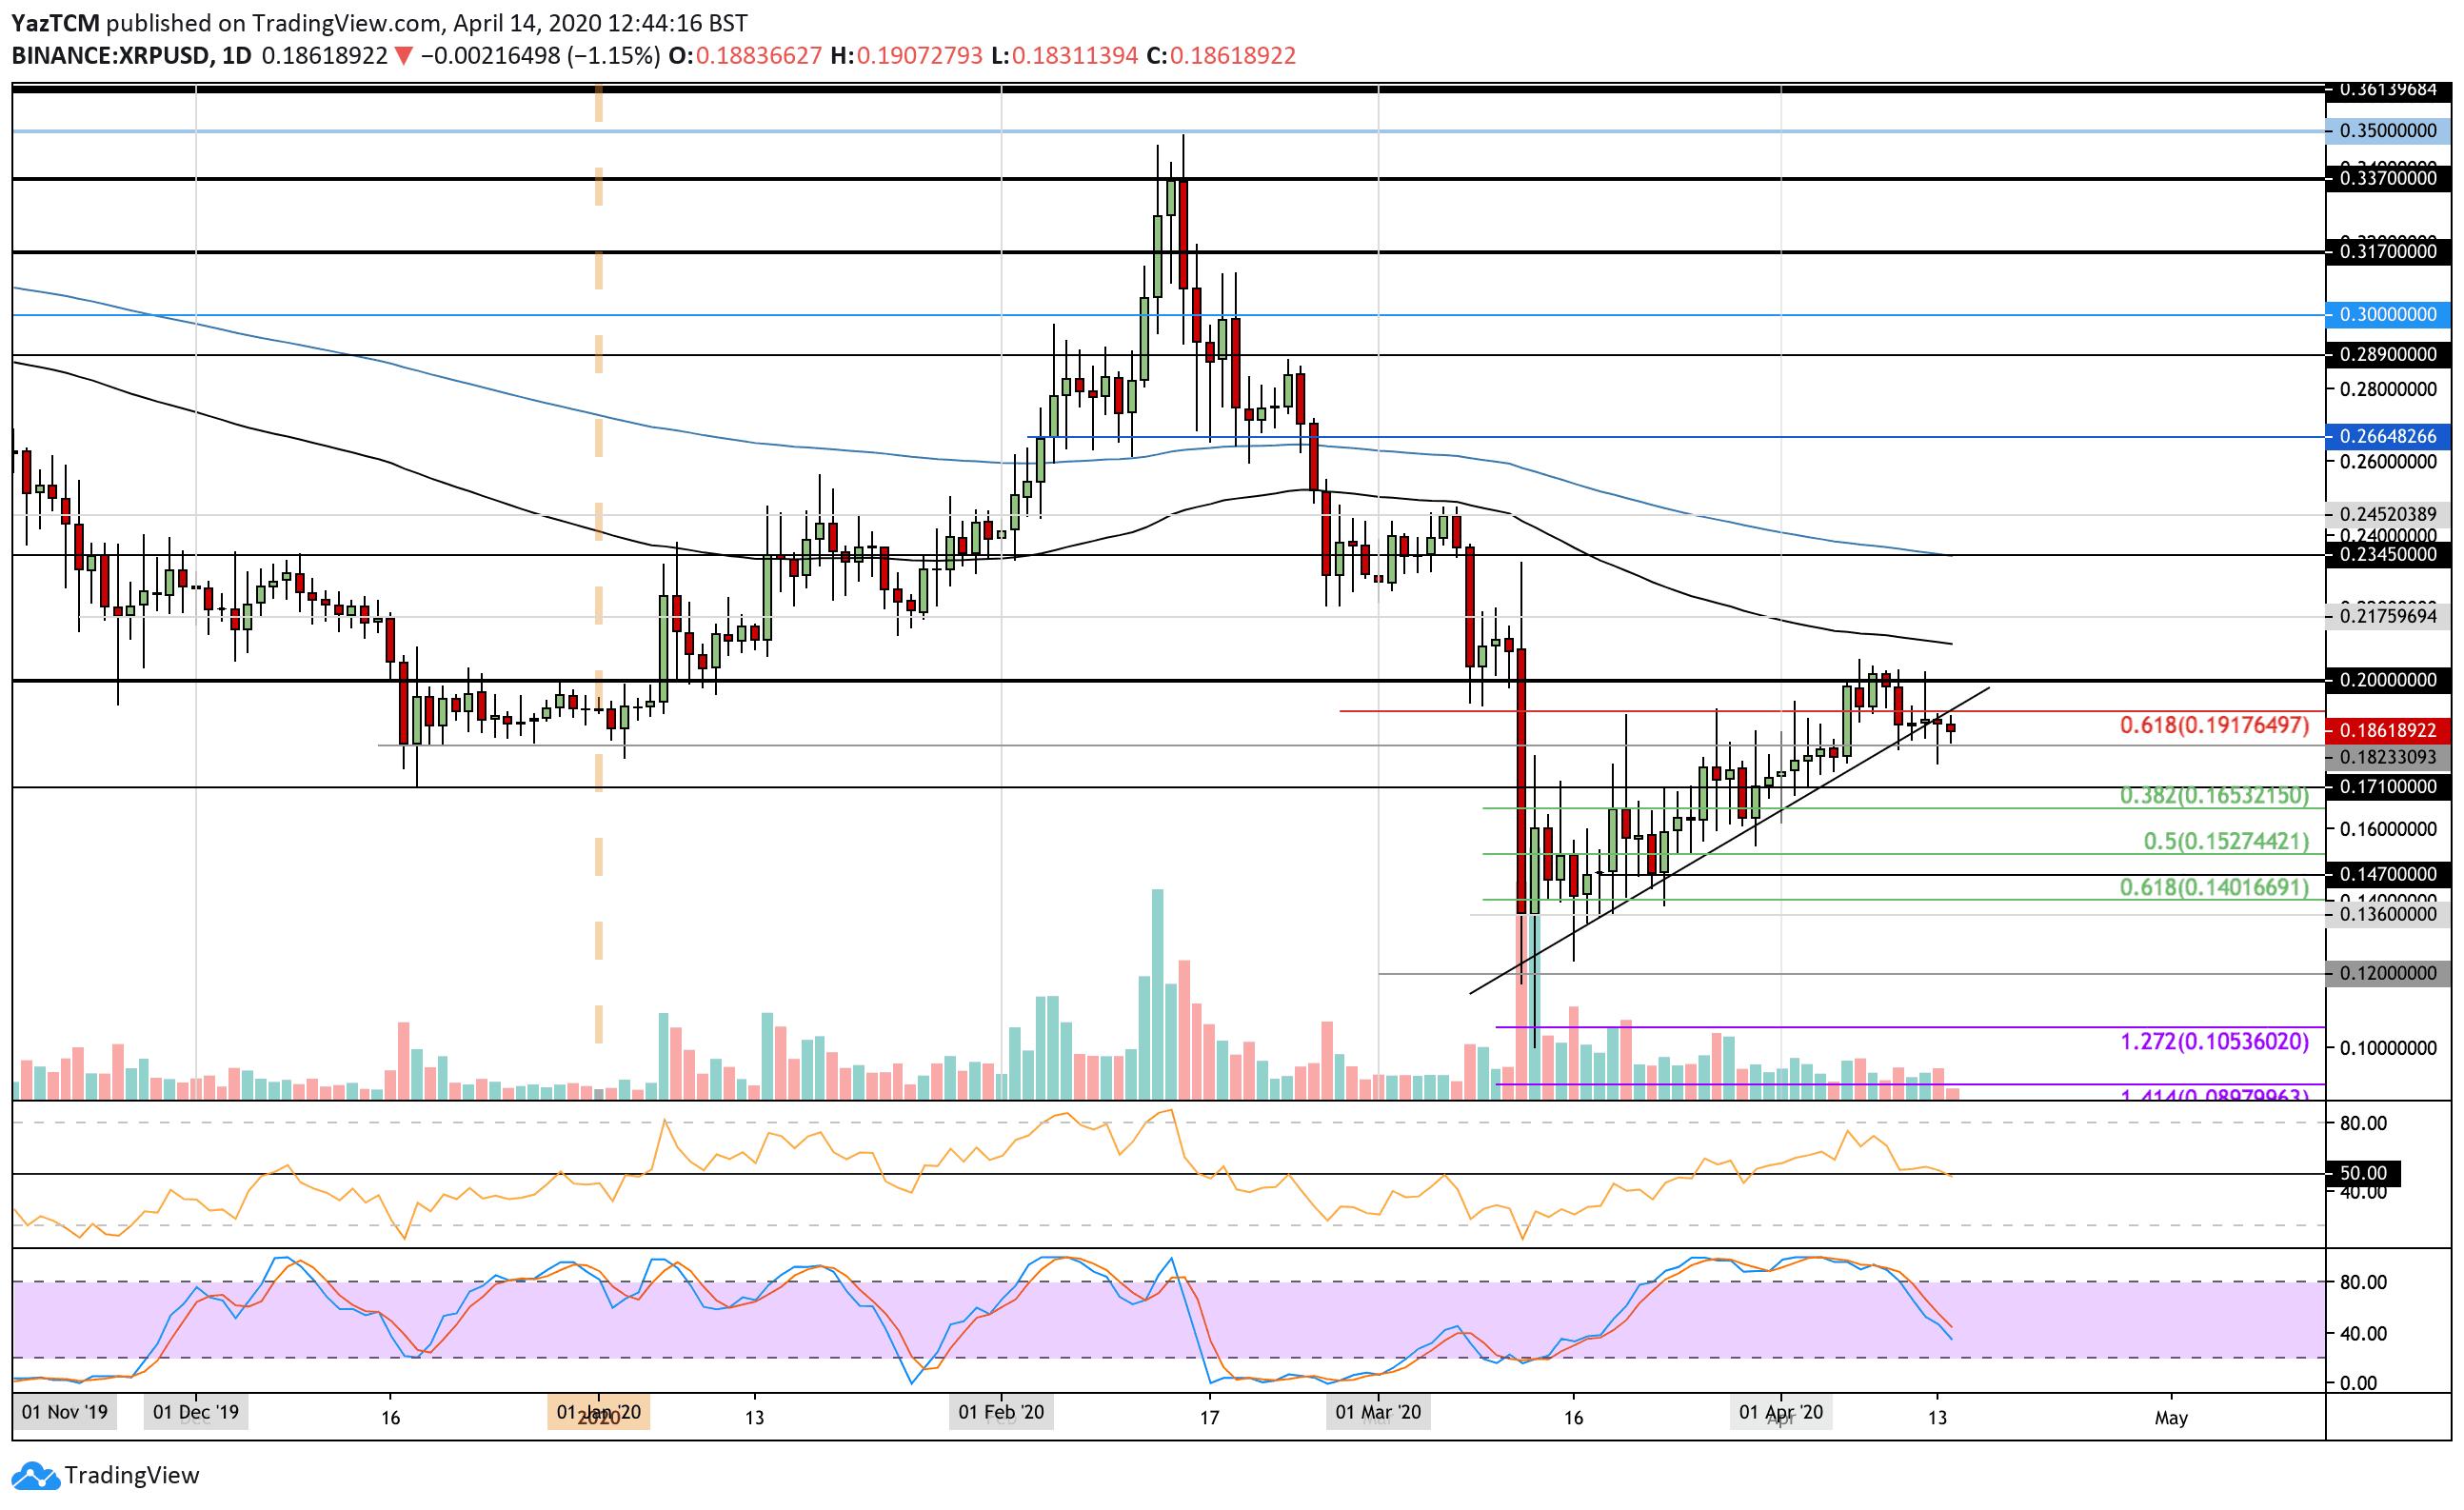
XRP/USD: Ripple Drops Beneath The Rising Trend Line
XRP had rolled over from the $0.2 resistance last week, causing the cryptocurrency to initially drop into support at a rising trend line. The cryptocurrency broke beneath this rising trend line support today as it reaches $0.185.
XRP is now in a predicament as it enters bearish territory beneath the trend line. If Bitcoin continues to fall and XRP closes beneath $0.18 today, it is likely that XRP will head lower toward $0.16.
XRP/USD Short Term Price Prediction
If the sellers push lower, the first level of support lies at $0.182. Beneath this, support lies at $0.171, $0.165 (.382 Fib Retracement), and $0.152 (.5 Fib Retracement).
On the other side, the first level of resistance lies at $0.191 (bearish .618 Fib Retracement). Above this, resistance lies at $0.2, $0.21 (100-days EMA), and $0.235 (200-days EMA).
The RSI has now marginally slipped beneath the 50 level to indicate the sellers have taken control of the market momentum. If it continues to fall further beneath here, the selling pressure will increase, which would cause XRP to head beneath $0.17.
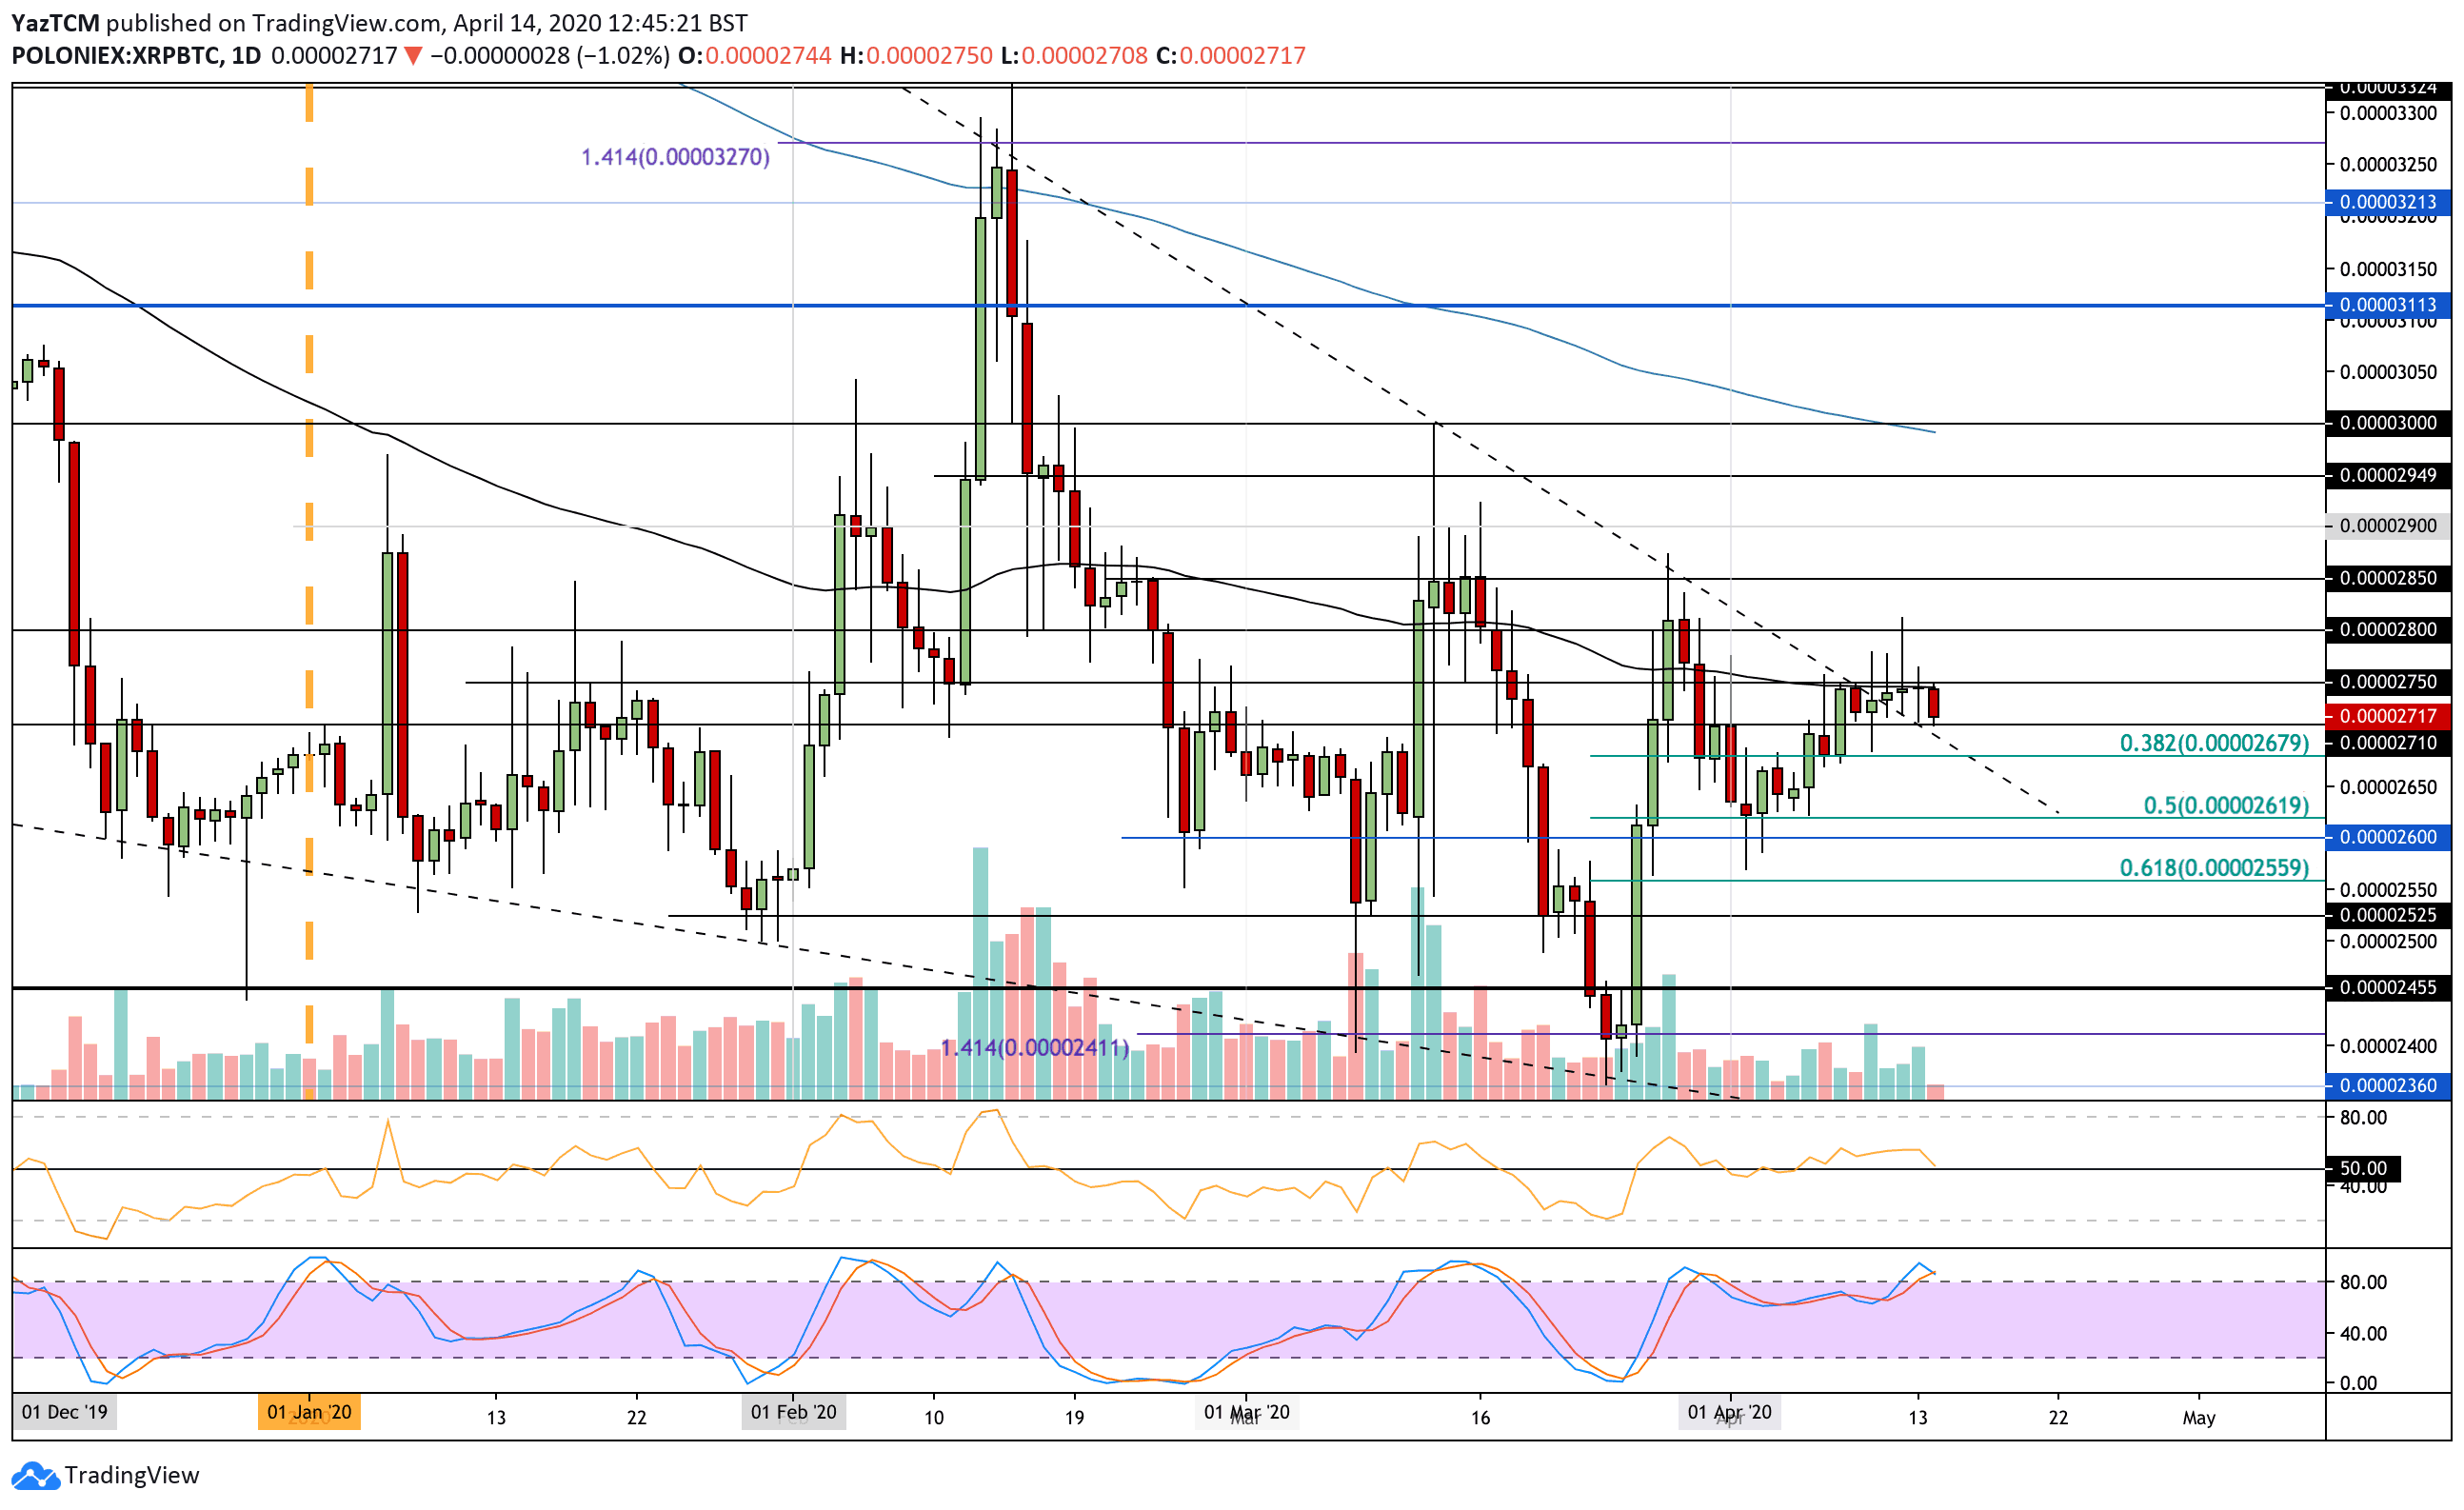
XRP/BTC: Ripple Fails To Close Above 100-days EMA.
Against Bitcoin, XRP had attempted to break above the 100-days EMA as it reached a high above 2800 SAT. However, it failed to close above the 100-days EMA at 2750 SAT over the past 4-days of trading.
In today’s trading session, XRP dropped lower to find the support at 2710 SAT, where it currently trades.
XRP/BTC Short Term Price Prediction
If the sellers push beneath 2710 SAT, the first level of support lies at 2680 SAT (.382 Fib Retracement). Beneath this, support lies at 2650 SAT, 2620 SAT (.5 Fib Retracement), and 2600 SAT.
On the other hand, if the buyers rebound from here, resistance is expected at 2750 SAT (100-days EMA). Above this, resistance lies at 2800 SAT, 2850 SAT, and 2900 SAT.
The RSI is approaching the 50 level as the bullish market momentum starts to fade. A break beneath 50 would indicate that the sellers have taken control. Furthermore, the Stochastic RSI is primed for a bearish crossover signal that is another bearish signal.